 2022, Vol. 33


b Key Laboratory of Marine Environmental Corrosion and Bio-fouling, Institute of Oceanology, Chinese Academy of Sciences, Qingdao 266071, China
As an important parameter, polarity significantly impacts on a number of organic and inorganic processes [1]. In biological systems, polarity affects the interaction of extensive proteins and enzymes and the stability of lipid membrane [2, 3]. The change of polarity reflects the variation of cell state, and is closely related to a series of diseases [4-6]. Moreover, due to the significant polarity difference of cellular organelles [7], it is necessary to test the polarity of specific organelle. As the main digestive organelles in cells, lysosomes receive macromolecules from various membrane-trafficking pathways through membrane fusion, and degrade them by a series of acid hydrolases, which is critical for maintaining cell homeostasis and effectively protecting cells from infection, starvation and stress [8, 9]. Lysosomal polarity significantly affects membrane fluidity and enzymatic reactions in lysosomes [10], and is considered a key indicator of lysosomal function. The change of lysosomal polarity can reflect the variation of cell states caused by related physiological and pathological processes. For example, cancer, inflammation and fatty liver reduce lysosomal polarity [10, 11], and lysosomal polarity increases with cell aging [12]. Cancer detection tools also have been developed based on the difference of lysosomal polarity [13]. Monitoring lysosomal polarity can gain insight into the related physiological and pathological processes and develop new diagnostic methods. However, polarity is a complex factor and covers a series of noncovalent interactions including dipole/depolarization and hydrogen bonding [14], so real time monitoring lysosomal polarity remains a challenge. Hence, it is an important and urgent task to develop new tools to detect lysosomal polarity in living cells.
Recent years, the fluorescent probes with polarity response have achieved great development. Their response mechanisms can be divided into three categories, including intramolecular charge transfer (ICT) [11], photoinduced electron transfer (PET) [4] and excited state intramolecular proton transfer (ESIPT) [15]. Among them, a series of lysosome-specific probes have been successfully applied to lysosomal polarity imaging [4, 10-13, 16]. Since most fluorescent probes with lysosomal polarity response are small molecules based on the fluorescence intensity change at single emission-wavelength, they have the problem of photobleaching and complex synthesis, and are interfered by uneven distribution and instrument factors. In addition, narrow linear range also limits their applications. Carbon dots (CDs), as a new class of nanomaterials, have the advantages of robust photostability, favorable biocompatibility and simple synthesis [17-22]. Recently, it is noted that CDs possess the solvent dependent fluorescence, especially CDs with phenylenediamine as precursor [23-26]. Based on this feature, several CDs have been used as fluorescent probes with polarity response [16, 26, 27]. Among them, Sun et al. developed CDs as a fluorescent probe for lysosomal polarity [16]. However, they also suffer from single wavelength signal and a narrow linear range. Therefore, it is necessary to develop a ratiometric fluorescence probe based on CDs with a wide linear range.
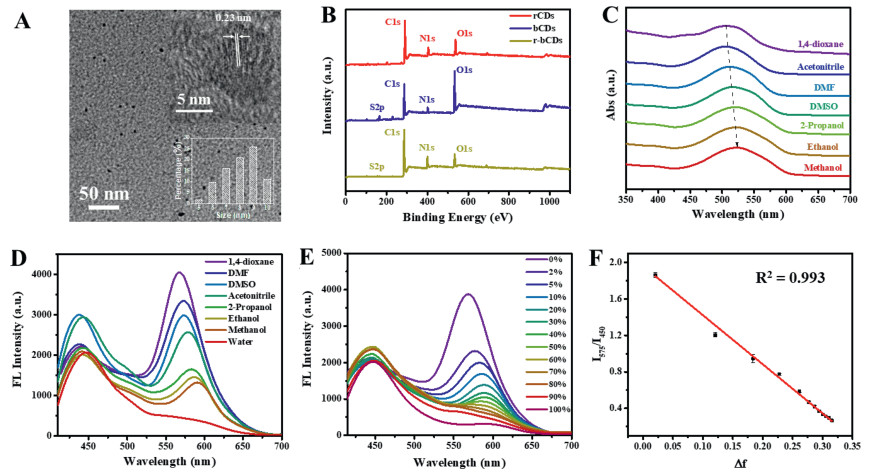
Herein, a ratiometric fluorescent probe (r-bCDs) with lysosomal polarity response was prepared by amide bond assembly of polarity-sensitive red fluorescent carbon dots (rCDs) and referenced blue fluorescent carbon dots (bCDs). With the increase of polarity, the red emission of r-bCDs decreases and the blue emission remains unchanged. The ratio of the fluorescence intensities at 575 and 450 nm (I575/I450) has linearly relationship to the orientation polarizability Δf within a wide range from 0.020 to 0.315, which is much wider than other fluorescent probes with polarity response. In addition, the ratiometric fluorescent signal can effectively reduce the error caused by uneven distribution of probes and instrument factors, which is valuable for bioimaging. Due to internalization by endocytosis and abundance of amino groups, r-bCDs show excellent lysosomal specificity. Observation of lysosomal polarity variation in different cell states and distinguishing cancer cells and normal cells were achieved by ratiometric fluorescent imaging with r-bCDs. Therefore, r-bCDs provide a promising tool for studying the related physiological and pathological processes and developing new diagnostic methods. rCDs were synthesized by one-step solvothermal method with o-phenylenediamine and dopamine hydrochloride as precursors [19]. bCDs were synthesized by solvothermal method with l-cysteine and citric acid as precursors [28]. After activation of carboxyl groups on the surface of bCDs by DMAP and EDC HCl, r-bCDs were produced by amidation reaction of rCDs and bCDs at room temperature. The synthesis process is shown in Scheme S1 (Supporting information). The morphology of rCDs, bCDs and r-bCDs was characterized by transmission electron microscopy (TEM). rCDs, bCDs and r-bCDs all show favorable monodisperse and spherical morphologies with average diameters of 2.75, 7.25 and 8.67 nm, respectively (Fig. 1A and Fig. S1 in Supporting information). The particle size of r-bCDs is larger than rCDs and bCDs, because r-bCDs are from the combination of rCDs and bCDs. The high-resolution TEM (HRTEM) images show that rCDs (Fig. S1C) and r-bCDs (Fig. 1A) have lattice fringes with the spacing of 0.20 and 0.23 nm, respectively, which are similar to the (100) lattice distance of the graphitic carbon, but bCDs (Fig. S1D) are amorphous.

|
Download:
|
| Fig. 1. (A) TEM image, HRTEM (inset) image and particle size distribution (inset) of r-bCDs. (B) Full-scan XPS of bCDs, rCDs and r-bCDs. (C) Absorption spectra and (D) emission spectra of r-bCDs in different solvents. (E) Emission spectra of r-bCDs in the mixture of H2O and 1, 4-dioxane. (F) Relationship between I575/I450 and orientation polarizability Δf. | |
To further investigate the chemical composition of rCDs, bCDs and r-bCDs, fourier transform-infrared (FT-IR) and X-ray photoelectron spectroscopy (XPS) spectra were determined (Figs. S2-S5 and Table S1 in Supporting information, Fig. 1B). FT-IR spectrum of bCDs shows the absorption peak of N-H and O-H stretching vibration within 3500-3200 cm−1 and the absorption peak of C=O vibration at 1602 cm−1, indicating that there are a large number of -COOH on the surface of bCDs. FT-IR spectrum of rCDs shows the stretching vibration peaks of N-H at 3382 and 3367 cm−1, C=O/C=N at 1622 cm−1 and C-N at 1477 cm−1, indicating the presence of polyaniline structure and -NH2. r-bCDs have the characteristic absorption bands of amide at 1641cm−1 and 1572 cm−1, indicating that bCDs and rCDs were successfully connected by covalent bond. The abundant -NH2 in rCDs and -COOH in bCDs can be clearly observed from XPS spectra. Compared with rCDs, r-bCDs have more C-N and pyrrolic N and less amino N. r-bCDs and bCDs are consistent in S 2p high resolution spectrum, while rCDs without S element. These results indicate that r-bCDs are derived from the assembly of rCDs and bCDs by amide bond.
UV-vis absorption and fluorescence spectra were used to study the optical properties of rCDs, bCDs and r-bCDs. The absorption peak of bCDs is located at 345 nm, which could be attributed to the n-π* transition of C=O (Fig. S6B in Supporting information). The characteristic absorption peak of rCDs is located at 536 nm and 568 nm (Fig. S6A in Supporting information), and r-bCDs have a similar absorption peak at 523 nm (Fig. S6C in Supporting information), which could be attributed to the surface state derived from rCDs. bCDs have typical excitation-dependent emission characteristic. At the optimal excitation wavelength of 345 nm, the emission peak of bCDs is located at 423 nm (Fig. S6B). rCDs exhibit an excitation independent emission at 595 nm (Fig. S6A). As an assembly of rCDs and bCDs, at the excitation wavelength of 390 nm, r-bCDs have two emission peaks at 439 nm and 588 nm, respectively (Fig. S6C).
In order to investigate the effect of polarity on spectroscopic properties, UV-vis absorption spectra and fluorescence spectra of rCDs, bCDs and r-bCDs in a variety of solvents covering a large range of polarity were measured. Ignorable changes were observed in the absorption maxima of bCDs in all of solvents (Fig. S7A in Supporting information). In contrast, the absorption bands of rCDs (Fig. S7C in Supporting information) and r-bCDs (Fig. 1C) show obviously red shift with the increase of solvent polarity. The emission intensity of bCDs increases with polarity, while the peak location remains unchanged (Fig. S7B in Supporting information). By contrast, the emission of rCDs (Fig. S7D in Supporting information) and the red emission of r-bCDs (Fig. 1D) display notable red shift, and their intensities decrease with increasing solvent polarity. The substructures of oxygen and nitrogen on the surface of rCDs increase the density of charge carriers, resulting in the electron transfer to the edge, and the stable excited state of rCDs is strongly affected by the dipole moment of the solvent [23]. Interestingly, the blue emission intensity of r-bCDs is basically unaffected by polarity. It is speculated that the polarity sensitivity of bCDs is derived from the special interaction between the surface -COOH and the solvent molecules, but the connection reaction generating r-bCDs consumes the -COOH of bCDs.
For further studying the quantitative relationship between fluorescence of r-bCDs and polarity, 30 µg/mL r-bCDs were dissolved in a H2O/1, 4-dioxane system. The solvent polarity of the testing system can be tuned by the volume ratio of H2O to 1, 4-dioxane (Table S2 in Supporting information). As the polarity increases, the fluorescence intensity of red emission decreases, and blue emission remains constant (Fig. 1E). The ratio of the fluorescence intensities at 575 and 450 nm (I575/I450) is linearly related to Δf within the range of 0.020-0.315 (y = –5.383 x + 1.960, R2 = 0.993) (Fig. 1F). The linear range of r-bCDs is much wider than other fluorescent probes with polarity response (Table S3 in Supporting information), making r-bCDs possess more potential in application. When Δf increases from 0.020 to 0.320, the fluorescence ratio increases from 0.145 to 1.862, providing a 13-fold contrast window.
In order to evaluate the applicability as a fluorescent probe with polarity response, the stability and selectivity of r-bCDs were explored. It is found that only a slight variation of I575/I450 was observed over a wide range of pH (3-11), and negligible compared with the effect of polarity (Fig. S8A in Supporting information). The effect of ionic strength was evaluated through dissolving r-bCDs in ethanol/water 1:1 mixture containing different concentrations of NaCl (Fig. S8C in Supporting information). The fluorescence ratio is not affected at NaCl concentration up to 1 mol/L. Additionally, light stability of r-bCDs was also studied. After continuous irradiation of r-bCDs in ethanol solution for 1 h, the fluorescence intensities at both 450 nm and 575 nm are almost no change (Fig. S8D in Supporting information), demonstrating the favorable light stability of r-bCDs. Finally, the selectivity of r-bCDs was investigated by testing the fluorescence response of r-bCDs to common anions, cations, amino acids and intracellular active substances (Fig. S8B in Supporting information). All of the tested species did not significantly alter the fluorescence signal, indicating the excellent selectivity of r-bCDs. Thus, r-bCDs have potential as a probe for polarity imaging in complicated biological environments.
MTT assays were conducted to evaluate the cytotoxicity of r-bCDs. After treatment with r-bCDs for 24 h, even if r-bCDs concentration was up to 100 mg/mL, cell viability was more than 90% (Fig. S9 in Supporting information). This concentration is much higher than that used in imaging, showing that r-bCDs have favorable biocompatibility. For later imaging experiments, the incubation time was optimized (Figs. S10 and S11 in Supporting information). The fluorescence intensity of cells would reach saturation in ca. 8 h. Compared with control group, the fluorescence of cells in the 4 ℃ group (inhibiting the energy supply) significantly declined (Fig. S12 in Supporting information), indicating that the cellular uptake of r-bCDs is energy-dependent. The endocytic pathways of r-bCDs were studied by inhibitors. Commonly, there are four types of endocytosis including macropinocytosis, clathrin-mediated endocytosis, caveolae-mediated endocytosis and lipid raft-mediated endocytosis, inhibited by amiloride (AMI), chlorpromazine (CPZ), genistein (GEN) and methyl-β-cyclodextrin (MβCD) respectively [25]. Cellular internalization of r-bCDs is mainly mediated by clathrin-mediated endocytosis, (Fig. S12). Moreover, cells can also achieve the uptake of r-bCDs by caveolae-mediated endocytosis.
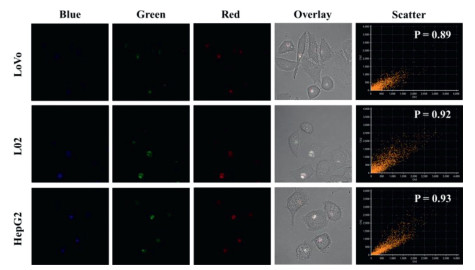
To further study the intracellular distribution of r-bCDs, colocalization experiment was implemented. After treating LoVo, HepG2 and L02 cells by r-bCDs and commercial lysosome indicator Lyso-Traker Green, overlapped red and blue fluorescence from r-bCDs and green fluorescence from Lyso-Traker Green were clearly observed. Pearson's colocalization coefficients of green and red channel in LoVo, HepG2 and L02 cells are calculated to be 0.89, 0.92 and 0.93, respectively (Fig. 2). The fine merged image and high colocalization coefficient clearly show that r-bCDs could be specifically distributed in lysosomes. In order to explore the source of the lysosomal specificity of r-bCDs, co-location experiments of bCDs and rCDs were conducted. bCDs hardly have lysosomal specificity, while rCDs can specifically target the lysosomes (Figs. S13 and S14 in Supporting information). Therefore, it is speculated that the lysosomal specificity of r-bCDs is from rCDs. rCDs have abundant -NH2 on the surface, and the -NH2 is largely reserved in r-bCDs (Fig. S2). Once entering lysosome, -NH2 will be protonated due to the acidic environment of lysosome, making rCDs and r-bCDs become positively charged and trapped inside lysosome [29]. In addition, the lysosomal specificity of r-bCDs is also related to the endocytosis pathways. r-bCDs enter cells by clathrin-mediated endocytosis, which would make r-bCDs transported to lysosome through endosome and trapped inside due to -NH2 [30].

|
Download:
|
| Fig. 2. Confocal fluorescence images of lysosome colocalization assays of r-bCDs with commercial organelle dye Lyso-Tracker Green. | |
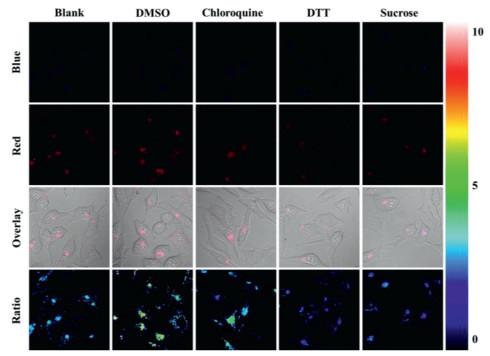
The utility of r-bCDs for visualizing the polarity variation of lysosomes in living cells was further tested. Lysosomal storage disorders induced by high concentration sucrose will cause lysosomal polarity increase, and chloroquine can induce lysosomal polarity decrease by lysosome membrane permeabilization [4]. Uptake of DMSO by the cells decreases the polarity of lysosomes in living cells [13]. Furthermore, it is also reported that dithiothreitol (DTT) can increase lysosomal polarity [16]. LoVo cells stained by r-bCDs were incubated in 1640 medium containing 80 mmol/L sucrose, 100 µmol/L chloroquine, 1% DMSO and 50 mmol/L DTT for 20 min, respectively. It is observed that the fluorescence ratio of the LoVo cells treated by sucrose and DTT is lower than control group (Fig. 3), illustrating that lysosomal storage disorders and DTT lead to lysosomal polarity increase. By contrast, LoVo cells treated by chloroquine and DMSO show higher fluorescence ratio, illustrating lower lysosomal polarity caused by DMSO and lysosome membrane permeabilization. The above results prove that r-bCDs can be used to sense the change of lysosomal polarity in living cells.

|
Download:
|
| Fig. 3. Confocal fluorescence images of LoVo cells stained with r-bCDs and stimulated with sucrose, chloroquine, DTT and DMSO. | |
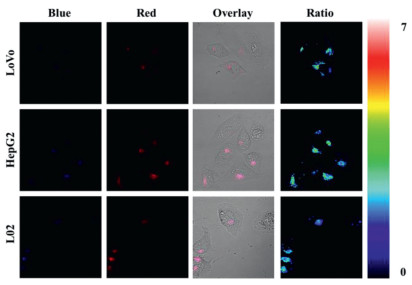
The polarity difference between normal cells and cancer cells has attracted attention in recent years [6, 11, 13]. r-bCDs were used to stain cancer cells (LoVo cells and HepG2 cells) and normal cells (L02 cells), respectively. The fluorescence ratio of cancer cells was significantly higher than that of normal cells (Fig. 4). This phenomenon indicates lower lysosomal polarity of cancer cells, which was consistent with reports in previous literatures. These results suggest that r-bCDs can serve as a probe with lysosomal polarity response for research on the related physiological and pathological processes and medical diagnosis.

|
Download:
|
| Fig. 4. Confocal fluorescence images of LoVo cells, HepG2 cells and L02 cells stained with r-bCDs. | |
In conclusion, a ratiometric fluorescent probe r-bCDs with polarity response was constructed though assembling two CDs. r-bCDs have favorable selectivity, stability and low toxicity. The fluorescence ratio of r-bCDs is linearly related to Δf within a wide range from 0.020 to 0.315. In addition, r-bCDs are targeted to lysosomes with high specificity. By ratiometric fluorescent imaging, r-bCDs can reflect the changes of lysosomal polarity in living cells and distinguish normal cells and cancer cells without the influence of concentration, and the excellent characteristics of r-bCDs provide the advantages for long-term monitoring. It is helpful to further study the physiological and pathological processes related to lysosome, and to develop new medical diagnostic tools based on lysosomal polarity. Up to now, there is little report on the assembly of various CDs. This work provides a new way for achieving more functions or better performance by combining different CDs.
Declaration of competing interestThe authors declare that they have no known competing financial interests or personal relationships that could have appeared to influence the work reported in this paper.
AcknowledgmentsThis work is financially supported by the National Natural Science Foundation of China (Nos. 21922402, 21874017 and 21727811), and the Fundamental Research Funds for the Central Universities (No. N2005027).
Supplementary materialsSupplementary material associated with this article can be found, in the online version, at doi:10.1016/j.cclet.2021.08.076.
| [1] |
Z.J. Yang, J.F. Cao, Y.X. He, Chem. Soc. Rev. 43 (2014) 4563-4601. DOI:10.1039/C4CS00051J |
| [2] |
Y.D. Zhuang, P.Y. Chiang, C.W. Wang, Angew. Chem. Int. Ed. 52 (2013) 8124-8128. DOI:10.1002/anie.201302884 |
| [3] |
L. Huang, S.W. Tam-Chang, J. Fluoresc. 21 (2011) 213-222. DOI:10.1007/s10895-010-0708-z |
| [4] |
H. Zhu, J.L. Fan, H.Y. Mu, Sci. Rep. 6 (2016) 35627. DOI:10.1038/srep35627 |
| [5] |
M. Simons, M. Mlodzik, Annu. Rev. Genet. 42 (2008) 517-540. DOI:10.1146/annurev.genet.42.110807.091432 |
| [6] |
J.L. Yin, M. Peng, Y.Y. Ma, Chem. Commun. 54 (2018) 12093-12096. DOI:10.1039/C8CC07398H |
| [7] |
S.J. Park, V. Juvekar, J.H. Jo, Chem. Sci. 11 (2020) 596-601. DOI:10.1039/C9SC04859F |
| [8] |
C. de Duve, R. Wattiaux, Annu. Rev. Physiol. 28 (1966) 435-492. DOI:10.1146/annurev.ph.28.030166.002251 |
| [9] |
J.P. Luzio, P.R. Pryor, N.A. Bright, Nat. Rev. Mol. Cell Biol. 8 (2007) 622-632. DOI:10.1038/nrm2217 |
| [10] |
M. Li, J.L. Fan, H.D. Li, Biomaterials 164 (2018) 98-105. DOI:10.1016/j.biomaterials.2018.02.044 |
| [11] |
J.L. Yin, M. Peng, W.Y. Lin, Chem. Commun. 55 (2019) 11063-11066. DOI:10.1039/C9CC04739E |
| [12] |
D.L. Shi, L.H. Hu, X.M. Li, Sens. Actuators B: Chem. 319 (2020) 128302. DOI:10.1016/j.snb.2020.128302 |
| [13] |
L. Fan, X.D. Wang, J.Y. Ge, Chem. Commun. 55 (2019) 4703-4706. DOI:10.1039/C9CC00962K |
| [14] |
C. Reichardt, Chem. Rev. 94 (1994) 2319-2358. DOI:10.1021/cr00032a005 |
| [15] |
Y.A. Kyriukha, O.A. Kucherak, T.I. Yushchenko, Sens. Actuators B: Chem. 265 (2018) 691-698. DOI:10.1016/j.snb.2018.03.058 |
| [16] |
Y.Q. Sun, H.Y. Qin, X. Geng, ACS Appl. Mater. Interfaces 12 (2020) 31738-31744. DOI:10.1021/acsami.0c05005 |
| [17] |
Y.X. Lin, Q. Zhou, D.P. Tang, Anal. Chem. 89 (2017) 5637-5645. DOI:10.1021/acs.analchem.7b00942 |
| [18] |
S.Z. Lv, Y. Li, K.Y. Zhang, ACS Appl. Mater. Interfaces 9 (2017) 38336-38343. DOI:10.1021/acsami.7b13272 |
| [19] |
S.Y. Lu, L.Z. Sui, J.J. Liu, Adv. Mater. 29 (2017) 1603443. DOI:10.1002/adma.201603443 |
| [20] |
W.D. Li, Y. Liu, B.Y. Wang, Chin. Chem. Lett. 30 (2019) 2323-2327. DOI:10.1016/j.cclet.2019.06.040 |
| [21] |
B.Y. Wang, J. Li, Z.Y. Tang, Sci. Bull. 64 (2019) 1285-1292. DOI:10.1016/j.scib.2019.07.021 |
| [22] |
L. Ai, Y.S. Yang, B.Y. Wang, Sci. Bull. 66 (2021) 839-856. DOI:10.1016/j.scib.2020.12.015 |
| [23] |
H. Wang, C. Sun, X.R. Chen, Nanoscale 9 (2017) 1909-1915. DOI:10.1039/C6NR09200D |
| [24] |
J. Xia, S. Chen, G.Y. Zou, Nanoscale 10 (2018) 22484-22492. DOI:10.1039/C8NR08208A |
| [25] |
X.W. Hua, Y.W. Bao, J. Zeng, ACS Appl. Mater. Interfaces 11 (2019) 32647-32658. DOI:10.1021/acsami.9b09590 |
| [26] |
E S., Q.X. Mao, J.H. Wang, Nanoscale 12 (2020) 6852-6860. DOI:10.1039/C9NR10982J |
| [27] |
J.H. Liu, D.Y. Li, J.H. He, ACS Appl. Mater. Interfaces 12 (2020) 4815-4820. DOI:10.1021/acsami.9b18934 |
| [28] |
Y.Q. Dong, H.C. Pang, H.B. Yang, Angew. Chem. Int. Ed. 52 (2013) 7800-7804. DOI:10.1002/anie.201301114 |
| [29] |
W. Xu, Z. Zeng, J.H. Jiang, Angew. Chem. Int. Ed. 55 (2016) 13658-13699. DOI:10.1002/anie.201510721 |
| [30] |
H. Hillaireau, P. Couvreur, Cell. Mol. Life Sci. 66 (2009) 2873-2896. DOI:10.1007/s00018-009-0053-z |