 2022, Vol. 33


b School of Electronics and Information, Qingdao University, Qingdao 266071, China;
c College of Physics and Electronic Engineering, Qilu Normal University, Ji'nan 250200, China;
d Materials Science and Technology Program, College of Arts and Sciences, Qatar University, PO Box 2713, Doha, Qatar
In addition to the maturity and commercial promotion of 5 G technology, the internet of things (IoT), artificial intelligence and wearable electronics are bound to cause significant development in the industry-university research cooperation. Among them, smart sensors are widely used in IoT, wearable devices and artificial intelligence fields owing to their excellent performance in the real-time acquisition, feedback and analysis of large amounts of data [1, 2]. Thus, sensor technology has broad market demand and application prospects. In particular, research on gas sensors has attracted research interest because of the gradual increase in human environmental awareness and the demand for a better environment [3]. Gas sensors can directly detect dangerous situations caused by toxic and harmful components in the air [4]. Therefore, the design and fabrication of gas sensors with good sensitivity, fast response, a low detection limit, excellent selectivity and effective cost are also highly desirable [5].
Among the several types of available gas sensors, such as oxide semiconductor [6], catalytic combustion [7], thermal conductivity cell [8], electrochemical [9] and solid electrolyte [10], metal oxide semiconductor (MOS) gas sensors have been extensively studied owing to their controllability, high sensitivity and good stability [11, 12]. According to literature, MOS-based sensors play an important role in monitoring toxic and harmful gases, such as triethylamine (TEA) [13], toluene [14], acetone [15, 16], CO [17, 18], H2 [19], H2S [20], NH3 [21], NOx [22], ethanol [23-26] and formaldehyde [27]. Of the various available metal oxide semiconductors, such as MoO3 [28-30], ZnO [31], SnO2 [32], WO3 [33], Fe2O3 [34], Co3O4 [35, 36] and In2O3 [37-39], MoO3 has unique advantages as a traditional sensing material in gas monitoring owing to its special electrical characteristics, excellent high stability, high reactivity and surface effect [40]. For example, chemical sensing performance can be significantly enhanced from 7 to 33 via the introduction of 2D-MoO3 nanosheets compared with sensors using bulk MoO3 [41]. In 2019, Zhu et al. fabricated hollow MoO3 microcages that exhibited larger ethanol gas response than that of solid polyhedrons [42]. In their study, porous ultrathin α-MoO3 nanosheets with oxygen vacancies were obtained via the solvothermal approach and their sensor demonstrated the fastest response to trimethylamine (TMA) at 133 ℃ (the response of the sensor was 198 ppm to 50 ppm TMA) [43]. Very recently, α-MoO3/BiVO4 composites with a heterojunction were synthesized via the hydrothermal method and the results showed that the response of the α-MoO3/BiVO4 composite to 20 ppm TEA was 1.86 times and 15 times higher than those of α-MoO3 and BiVO4, respectively, at 125 ℃ [44].
TEA, a volatile organic compound (VOC), is extensively used in catalysts, preservatives, curing agents, synthetic dyes and industrial raw materials [45, 46]. However, the toxic, volatile, flammable and explosive nature of TEA is disadvantageous in its practical applications [47]. Once an industrial leakage occurs, it is extremely easy to cause serious injuries or destruction to the public environment and human body [48]. Therefore, developing a TEA gas sensor with fast response, wide detection limitation, good selectivity, low working temperature and long-term stability is important and urgent for industrial and agricultural production activities. Thus far, TEA sensors based on MOSs, such as ZnO [49], SnO2 [50], Fe2O3 [51, 52], V2O5 [53], In2O3 [54] and ZnCo2O4 [55], have been widely investigated. Although it has been found that molybdenum oxide (MoO3) also has TEA sensing properties, the potential benefits of MoO3 to TEA gas warrant further exploration [56]. SnS2 is a multifunctional narrow bandgap (2.2 eV) n-type semiconductor that has been widely used in various fields, such as photoelectric, photoelectrochemical and lithium-ion batteries (LIBs) [57-59]. Very recently, SnS2 nanomaterials have attracted substantial research attention because they are good candidates for the synthesis of gas sensing nanocomposites with other MOSs [60]. For example, Gu et al. reported that a SnO2/SnS2 heterojunction based chemiresistive gas sensor exhibited excellent sensitivity and selectivity to different concentrations of NO2, from 1 ppm to 8 ppm, at 80 ℃ [61]. Yan et al. reported that SnS2/rGO nanohybrids show ultrasensitive room temperature ppb-level NO2 gas sensing performance [62], and Yan et al. demonstrated that Schottky-contacted n-type SnS2 gas sensors reveal excellent device sensitivities, as high as 13, 000% for 9 ppm and 97% for 1 ppb NO2 [63]. To the best of our knowledge, the development of a novel TEA sensing MoO3@SnS2 material with excellent sensing performance at low operating temperature is still a major challenge, despite the considerable progress in composite of SnS2 and other metal oxides.
Herein, MoO3@SnS2 composites with encapsulation structures were obtained via a two-step hydrothermal method wherein the thickness of the SnS2 shells was manipulated by controlling the second hydrothermal reaction time. Accordingly, the sensing performances of different MoO3@SnS2 composites were carefully studied. Furthermore, gas sensing measurements revealed that MoO3@SnS2 composites with encapsulation structures display excellent gas sensing performance as compared to individual MoO3 and SnS2.
The α-MoO3 nanosheets were successfully synthesized by the following processes, which have reported in detail in our previous works [64]. First, 1 g (NH4)2MoO4, 300 mg NH4F, 100 mg NaOH, and 3 g C6H12O6 were dissolved in 50 mL distilled water, followed by vigorous stirring for 30 min. Subsequently, the obtained solution was transferred into a 60 mL Teflon-lined autoclave and heated at 120 ℃ for 12 h. Next, the obtained suspension was washed several times with absolute ethanol and deionized water, to remove redundant ions, and centrifuged at 6900 rpm for 30 min. Then, the product was calcined at 400 ℃ for 2 h to obtain the final gray precursor. Then we synthesized foam shaped MoO3@SnS2 nanosheets through a second hydrothermal reaction. In this process, 360 mg of the obtained gray precursor, 175.3 mg SnCl4·5H2O, 6 mL CH3COOH and excess CH3CSNH2 were first dissolved into 40 mL ethanol, followed by vigorous stirring for 30 min. The resulting solution was then transferred into a 60 mL Teflon-lined autoclave and heated at 160 ℃ for 2, 6 and 10 h. Then, the obtained suspension was washed several times with absolute ethanol and deionized water, respectively. After drying at 60 ℃ overnight in a vacuum chamber, the MoO3@SnS2 composites were obtained. For convenience, we named the three composites MS2, MS6 and MS10 according to their second step hydrothermal reaction times of 2, 6 and 10 h, respectively.
The as-prepared sensing material was mixed with ethanol and continuously grounded to form a slurry. Then, the slurry was pasted onto a ceramic tube with a brush to form a thin and uniform sensing material coating. Four Pt wires and a pair of Au electrodes were pre-installed on the ceramic tube to facilitate the collection of electrical signals. A Ni–Cr coil pierced through the ceramic tube was used as a heater. Next, the Pt wires and the Ni–Cr heater were soldered on the pedestal of the gas sensor. The response (Rs) of the sensor was calculated by Rs = Ra/Rg, where Ra and Rg are the resistances in fresh air and target gas environment, respectively. The response and recovery times were defined as the time taken by the sensor to reach 90% of the total resistance variation [65].
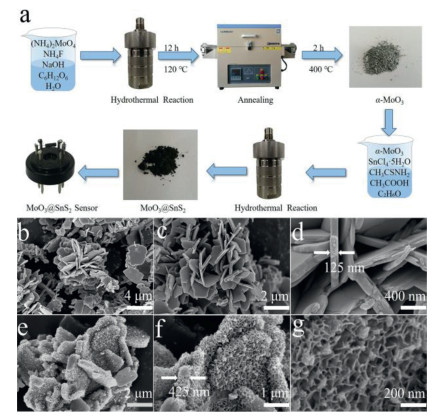
Fig. 1a provides a schematic of the overall process of material synthesis and device preparation. Herein, we first prepared the α-MoO3 precursor via the hydrothermal method and then annealed at 400 ℃. Thereafter, dark MoO3@SnS2 composites with encapsulation structures were obtained by the second hydrothermal reaction route. Finally, pure α-MoO3 and MoO3@SnS2 sensors were fabricated using brush-coating technology. FE-SEM was used to examine the microstructure and morphology of as-prepared samples. As Figs. 1b and c show, several MoO3 nanosheets were successfully synthesized with irregular sheet-like profiles. To scrutinize the morphology of the MoO3 nanosheets, high-magnification FE-SEM was employed. The average thickness of an α-MoO3 nanosheet was ~200 nm and its surface are rather smooth (Fig. 1d). Interestingly, MS6 exhibits markedly different morphology, though the overall profile indicates nanosheet structure (Figs. 1e and f). Additionally, the thickness of the nanosheets increases from 200 nm to 400 nm, which is attributed to the encapsulation of SnS2 to the positive and negative facets of α-MoO3 nanosheets. In addition, the thickness of SnS2 layer was determined by the second hydrothermal reaction time. According to a rough estimation, the average thickness of a SnS2 single face is about 100 nm. Tremendous changes also occurred in the morphology of the MoO3@SnS2 composite, from its original smooth surface to a foam-shape (Fig. 1g), which considerably increases the specific surface ratio. This can increase gas absorption capacity and create more active centers, which are beneficial to sensing performance.

|
Download:
|
| Fig. 1. (a) Schematic illustration of the synthesis processes for MoO3@SnS2 nanocomposites and an as-fabricated gas sensor. (b–d) Field-emission scanning electron microscopy (FE-SEM) images of α-MoO3 nanosheets and (e–g) FE-SEM images of the MS6 composite at increasing magnification. | |
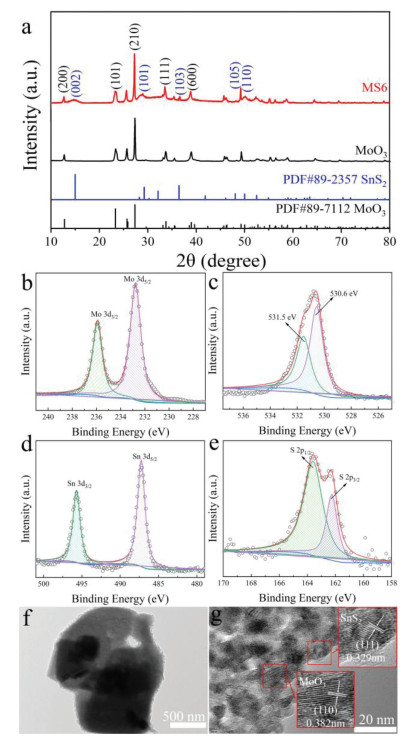
XRD patterns of MoO3 precursor and MS6 composite were measured because of the distinguished difference sensing performance (Fig. 2a). In this work, MoO3 is the reference material, MS6 exhibits the best sensing performance among MoO3, MS2, MS6 and MS10. For pure MoO3 nanosheets, diffraction peaks were located at 2θ = 12.8°, 23.3°, 27.3°, 33.7° and 38.9° that can be ascribed to the (200), (101), (210), (111) and (600) planes. These results agree well with standard diffraction patterns of orthorhombic α-MoO3 (JCPDS No. 89-7112). Furthermore, peaks corresponding to α-MoO3 and SnS2 were detected in the XRD patterns of the MS6 composite as the α-MoO3 nanosheets are coated by ultrathin SnS2 sheets. Five small peaks are observed at 2θ = 15.0°, 29.2°, 36.4°, 48.0° and 50.0°, corresponding to the (002), (101), (103), (105) and (110) planes, respectively, in the hexagonal phase of SnS2 (JCPDS card no. 89-2357). No diffraction peaks from impurities were detected. Furthermore, it was found that the intensity of the diffraction peaks of α-MoO3 is stronger than those of SnS2 due to the higher crystallinity of α-MoO3. These results confirm that MoO3@SnS2 nanocomposites with high crystallinity were successfully synthesized.

|
Download:
|
| Fig. 2. (a) XRD pattern of pure α-MoO3 precursor and MS6 nanocomposites. XPS spectra of MS6 indicated (b) Mo 3d, (c) O 1s, (d) Sn 3d and (e) S 2p. (f) TEM and (g) HR-TEM images of MS6 composite. | |
High-resolution XPS measurements were performed to further analyze the chemical components and valence states of the MoO3@SnS2 composites. The peaks of Mo 3d, O 1s, Sn 3d, and S 2p can be clearly identified in the XPS spectrum of MoO3@SnS2 (Figs. 2b–e). This indicates that the final product only contains Mo, O, Sn and S. In Fig. 2b, peaks at 235.8 and 232.7 eV belong to the doublet Mo 3d3/2 and Mo 3d5/2, respectively, which is attributed to the Mo6+ of α-MoO3 phase [66]. Fig. 2c displays the O 1s XPS spectrum. Two peaks at 530.6 and 531.5 eV indicate two independent types of O species in MoO3@SnS2. According to literature, the peak at 530.6 eV could be ascribed to surface lattice oxygen in MoO3@SnS2 nanocomposites and the peak at 531.5 eV could be surface absorbed oxygen species, such as O−, O2− and O2−, that are in oxygen deficient regions within the matrix of MoO3@SnS2. As shown in Fig. 2d, there are two sharp peaks in the XPS spectrum of Sn 3d, at 495.69 and 487.27 eV, which are the peaks of Sn 3d3/2 and Sn 3d5/2, respectively [67]. In Fig. 2e, the S 2p spectra was assigned to the binding energy of S 2p1/2 (163.65 eV) and S 2p3/2 (162.25 eV), which contributed to the S2− in the SnS2.
Figs. 2f and g display TEM and HR-TEM images of the MS6 nanocomposite. It can be clearly seen that the SnS2 phase is connected to the surface of the α-MoO3 phase. The 0.329 nm fringe spacing corresponds to the (111) plane of SnS2 and the 0.382 nm fringe spacing fits well with the (110) plane of α-MoO3. We further verified the constituent elements and corresponding ratio of MoO3@SnS2 nanocomposites via energy dispersive X-ray (EDS) analysis (Fig. S1 in Supporting information). The EDS results reveal that the MS6 composites are composed of Mo, O, S and Sn, and the weight ratio meets the chemical formula of MoO3@SnS2. On the other hand, the elements are uniformly distributed on the surface of MoO3@SnS2, which was identified by EDS mapping in Fig. S1. This means that α-MoO3 nanosheets have been successfully coated with the SnS2 ultrathin sheets.
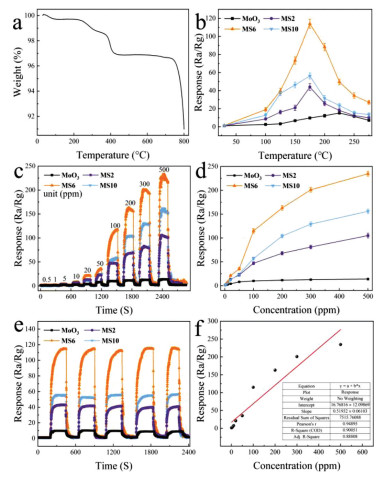
The schematic internal circuit of the homemade sensor was displayed (Fig. S2 in Supporting information). In order to investigate the thermal stability of MoO3@SnS2 composites, the TG curve of MS6 was measured, as shown in Fig. 3a. Clearly, the weight of the sample begins to decrease after 250 ℃, which can be attributed to the loss of absorbed water and the decomposition of residual reagents, such as NH4F. Thereafter, a significant decrease can be observed in weight between 350 ℃ and 430 ℃, which should be related to the oxidation behavior of SnS2 to SnO2 in the MoO3@SnS2 composite. In the next stage (430–740 ℃), no obvious changes are observed in the TG curve, indicating formation of thermally stable composite. In contrast, there is another sudden weight loss after 740 ℃, which is ascribed to the melt and sublimation behavior of MoO3. Thus, it is demonstrated that the MS6 composite can effectively work below 350 ℃.

|
Download:
|
| Fig. 3. (a) TG curve of the MS6 composite and (b) sensing performance of pure α-MoO3 precursor, MS2, MS6 and MS10 samples for 100 ppm TEA gas at different operating temperatures. (c) Dynamic response curves of MoO3, MS2, MS6 and MS10 sensors for TEA, from 0.5 ppm to 500 ppm, at 175 ℃. (d) response versus gas concentrations for MoO3, MS2, MS6 and MS10 sensors. (e) Repeatability test (five periods) of MoO3, MS2, MS6 and MS10 sensors for 100 ppm of TEA at 175 ℃. (f) Fitting curve between concentration and response used to obtain LoD. | |
The operating temperature is an important factor for a gas sensor. Fig. 3b shows the relationship between the sensitivity and the temperature of the device. The sensing properties of pure α-MoO3 precursor and MoO3@SnS2 composites were tested for 100 ppm TEA gas over a wide range of temperatures, from room temperature to 275 ℃. All samples exhibit an inverted V-type curve with the increase of temperature; however, the MS6 composite displays the highest sensor response of 114.9 at 175 ℃. On the one hand, the inverted V-type curve (i.e., the response of the sensor to TEA increases first and then decreases with the increase of temperature) can be attributed to the sensor material being insufficiently active at low temperature and the TEA molecules not having sufficient energy to overcome the activation energy barrier and surface adsorption of the oxygen reaction. With the increasing temperature, the material activity is enhanced, the TEA gains energy, and the sensing performance is improved. In contrast, as the temperature continues to increase, the sensing material has difficulty absorbing the test gas, which results in desorption phenomenon on the surface of the material and degradation of sensing performance at high temperature. Therefore, 175 ℃ is defined as the optimum working temperature for the MoO3@SnS2 sensor.
Fig. 3c depicts the dynamic response curves of the pure α-MoO3, MS2, MS6 and MS10 sensors at 175 ℃ for different concentrations of TEA vapor, ranging from 500 ppb to 500 ppm. The results reveal that the response values of all MoO3@SnS2 composite sensors climb significantly with increasing TEA concentration while the pure α-MoO3 sensor shows sluggish rising performance. Among the samples, the MS6 composite sensor shows the highest response (Fig. 3d). The sensing response of the MS6 composite is as high as 234.7 at 500 ppm TEA, which is 16.88 times that of the pure α-MoO3 sensor. Even when the concentration of TEA decreases to 0.5 ppm, the response of the MS6 sensor reaches 1.38. This indicates that MS6 has good sensitivity and response to TEA at a low temperature of 175 ℃. For comparison, the specific response values of α-MoO3 and MS6 sensors to different concentrations are listed in Table S1 (Supporting information). From the Table S1, it can be concluded that MS6 sensors have a much higher response to TEA than pure α-MoO3 sensors; therefore, MS6 sensors have great application prospects. Additionally, the sensing performance comparison between our sensor and recent literature results are summarized in Table S2 (Supporting information). It is worth noting that the MS6 sensor exhibits the highest response in comparison with those reported. In Fig. 3e, the repeatability of pure α-MoO3, MS2, MS6 and MS10 composites is evaluated. These results were collected when the pure α-MoO3, MS2, MS6, and MS10 sensors were exposed to fresh air and TEA target gas (100 ppm) at the optimal working temperature of 175 ℃. The results show that both α-MoO3 and MoO3@SnS2 composites have excellent response and recovery stability after five cycles. The limit of detection (LoD) of TEA gas is studied by linear extrapolation of the response sensitivity as a function of TEA concentration LoD (Fig. 3f). The calculating formula of the LoD is: LoD = 3 × (standard deviation/slope of response versus concentration plot). An ultra-low TEA detection concentration of 177.06 ppb was predicted for MS6.
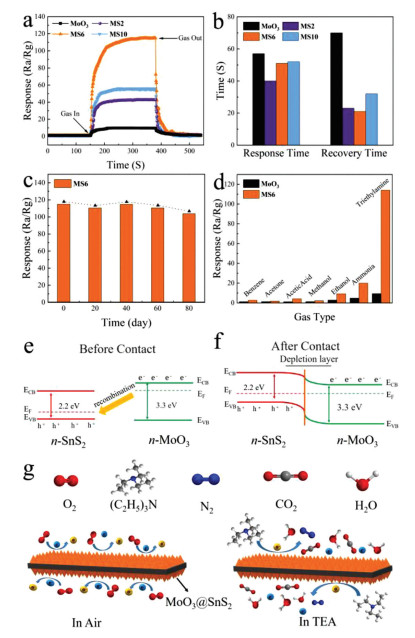
Fig. 4a shows the dynamic response curves of all sensors for 100 ppm TEA at 175 ℃. Compared to the α-MoO3 sensor, the response time (τres) and recovery time (τrec) of MS2, MS6 and MS10 sensors are shortened (see the bar chart in Fig. 4b). Overall, MoO3@SnS2 composite sensors exhibit fast recovery performance; that is, MS2 is 23 s, MS6 is 21 s, and MS10 is 32 s. Additionally, the MS6 sensor exhibits the shortest τres of 51 s and the τres of the pure α-MoO3 sensor is 57 s, which is slower than that of MS6. This is because the heterostructure interface formed between MoO3 and SnS2 can activate conducting electrons and accelerate electron transfer behavior. Additionally, an optimal Mo/Sn weight ratio is another beneficial reason for shorter response time.

|
Download:
|
| Fig. 4. (a, b) Response and recovery characteristics of the pure α-MoO3, MS2, MS6 and MS10 sensors for 100 ppm TEA at 175 ℃. (c) Bar chart of the long-term stability of the MS6 sensor and (d) selectivity of the MoO3 and MS6 sensors to different gases at 175 ℃. The formation mechanism of the electron depletion layer at the n-n heterojunction energy band structure (e) before contact of n-type MoO3 and n-type SnS2 and (f) after contact of n-type MoO3 and n-type SnS2. (g) Schematics of the gas sensing reaction mechanism of MoO3@SnS2 nanocomposite. | |
From the perspective of industrial applications, a good sensor should have long-term stability. Thus, the stability of MS6 to 100 ppm TEA was evaluated at 175 ℃ over 80 days, as shown in Fig. 4c. It is evident that the maximum deviation of the response for the MS6 gas sensor to TEA is less than 10%, which exhibits good stability after 80 days. Selectivity another important function of a gas sensor. In order to study the selectivity of pure α-MoO3 and MS6 composite sensors, the responses toward 100 ppm benzene, acetone, acetic acid, methanol, ethanol, ammonia and TEA gases at 175 ℃ were investigated, as shown in Fig. 4d. Obviously, both pure α-MoO3 and MS6 are sensitive to TEA compared to other gases, which is very attractive for the detection of trace amounts of TEA. Meanwhile, the measured response of the MS6 sensor to TEA is remarkably larger than that of pure α-MoO3, demonstrating the gas sensing performance of α-MoO3 has been effectively enhanced by loading of SnS2 ultrathin nanosheets.
MoO3 and SnS2 are n-type semiconductors with bandgaps of about 3.3 eV and 2.2 eV (Fig. 4e), respectively, that have been intensively investigated as gas sensors [68]. As shown in Fig. 4f, when MoO3 and SnS2 contact each other, the intrinsically excited electrons (e−) flow from MoO3 to SnS2 due to the higher Fermi level (Ef) of MoO3. As the number of e− in the MoO3 conduction band increases, the system reaches an equilibrium Fermi level (E). Thus, energy-band bending and an additional electron depletion layer (EDL) at the interface between MoO3 and SnS2 are formed. When the MS6 sensor is exposed to fresh air, the change in resistance of the sensor is replaced by the absorption and desorption process of oxygen molecules (O2) on the surface of the sensing material; the absorbed O2 is ionized by capturing conducting electrons from MoO3@SnS2 heterojunctions [69]. Then, reactive oxygen ions (O2−, O2− or O−) are produced (Fig. 4g). In this process, O2 acts as the electron acceptor, leading to the creation of an EDL and the increase of sensor resistance. Once exposed to the TEA gas atmosphere at a suitable temperature, the TEA gas molecules will react with the reactive oxygen ions on the surface, then, the released electrons will go back into the conduction band (Eg). Consequently, the EDL becomes narrower, and the sensor resistance decreases. The reactive processes can be expressed by the following formulas:
|
(1) |
|
(2) |
|
(3) |

|
(4) |

|
(5) |
In summary, herein, MoO3@SnS2 composites were successfully prepared by a facile hydrothermal method. The sensing performance, based on α-MoO3 nanosheets and MoO3@SnS2 sensors, was carefully investigated with respect to TEA gas. The resultant MS6 composite exhibits superior sensing performance compared to pure α-MoO3 nanosheets. The sensor based on MS6 nanosheets displays a high response of 114.9 for 100 ppm TEA at a working temperature of 175 ℃; the sensitivity is much higher than those reported for other sensors. In addition, the MS6 device shows a wide concentration detection range, from 500 ppb to 500 ppm, very good stability after 80 days exposed in air, and excellent selectivity. The extraordinary performance is ascribed to a synergistic coupling effect between high crystalline α-MoO3/SnS2 heterojunctions, encapsulation design, and accessible large pores on the surface of SnS2. This study demonstrates a new avenue to effectively construct gas sensing materials with encapsulation nanostructures via a metal oxide and sulfide.
Declaration of competing interestThe authors report no declarations of interest.
AcknowledgmentsThis work was financially supported by the National Natural Science Foundation of China (No. 51227804). This work was also funded by the Postdoctoral Scientific Research Foundation of Qingdao, National College Students Innovation and Entrepreneurship Training Program of China (No. G201911065028), College Students Innovation and Entrepreneurship Training Program of Qingdao University (Nos. X201911065058, X202011065056). Natural Science Foundation of Shandong Province (No. ZR2019YQ24), Taishan Scholars and Young Experts Program of Shandong Province (No. tsqn202103057), the Qingchuang Talents Induction Program of Shandong Higher Education Institution (Research and Innovation Team of Structural-Functional Polymer Composites). The authors would like to thank Kehui Han from Shiyanjia Lab (shiyanjia.com) for the SEM and XRD analysis.
Supplementary materialsSupplementary material associated with this article can be found, in the online version, at doi:10.1016/j.cclet.2021.06.022.
| [1] |
Y. Yan, J. Liu, H. Zhang, et al., J. Alloy. Compd. 780 (2019) 193-201. DOI:10.1016/j.jallcom.2018.11.310 |
| [2] |
P. Wang, S.Z. Wang, Y.R. Kang, et al., J. Alloy. Compd. 854 (2021) 157152. DOI:10.1016/j.jallcom.2020.157152 |
| [3] |
J. Walker, P. Karnati, D.R. Miller, et al., Sens. Actuator. B: Chem. 321 (2020) 128591. DOI:10.1016/j.snb.2020.128591 |
| [4] |
L. Zhang, J. Shi, Y. Huang, et al., ACS Appl. Mater. Interfaces 11 (2019) 12958-12967. DOI:10.1021/acsami.8b22533 |
| [5] |
P. Karnati, S. Akbar, P.A. Morris, Sens. Actuator. B: Chem. 295 (2019) 127-143. DOI:10.1016/j.snb.2019.05.049 |
| [6] |
J. Warmer, P. Wagner, M.J. Schöning, P. Kaul, Phys. Status Solid A 212 (2015) 1289-1298. DOI:10.1002/pssa.201431882 |
| [7] |
X. Liu, H. Dong, S. Xia, Micro Nano Lett. 8 (2013) 668-671. DOI:10.1049/mnl.2013.0468 |
| [8] |
Y.X. Liu, J. Parisi, X.C. Sun, et al., J. Mater. Chem. A 2 (2014) 9919-9943. DOI:10.1039/C3TA15008A |
| [9] |
G. Jiang, M. Goledzinowski, F.J.E. Comeau, et al., Adv. Funct. Mater. 26 (2016) 1729-1736. DOI:10.1002/adfm.201504604 |
| [10] |
J. Zhang, G. Jiang, M. Goledzinowski, et al., Small Methods 1 (2017) 1700237. DOI:10.1002/smtd.201700237 |
| [11] |
Z. Yang, C. Su, S.T. Wang, et al., Nanotechnology 31 (2020) 075501. DOI:10.1088/1361-6528/ab5271 |
| [12] |
W.R. Li, H.Y. Xu, H.Q. Yu, et al., J. Alloy. Compd. 706 (2017) 461-469. DOI:10.1016/j.jallcom.2017.02.223 |
| [13] |
C.Y. Liu, H.Y. Xu, Z.R. Chen, et al., ACS Appl. Nano Mater. 2 (2019) 6715-6725. DOI:10.1021/acsanm.9b01630 |
| [14] |
K. Suematsu, Y. Shin, Z.Q. Hua, et al., ACS Appl. Mater. Interfaces 6 (2014) 5319-5326. DOI:10.1021/am500944a |
| [15] |
Y. Ren, Y. Zou, Y. Liu, et al., Nat. Mater. 19 (2020) 203-211. DOI:10.1038/s41563-019-0542-x |
| [16] |
P. Wang, S.Z. Wang, Q. Han, et al., Adv. Mater. Interfaces 8 (2020) 2001831. |
| [17] |
H. Yamaura, Y. Iwasaki, S. Hirao, H. Yahiro, Sens. Actuator. B: Chem. 153 (2011) 465-467. DOI:10.1016/j.snb.2010.10.044 |
| [18] |
S.L. Bai, C. Chen, Y. Tian, et al., Mater. Res. Bull. 64 (2015) 252-256. DOI:10.1016/j.materresbull.2014.12.049 |
| [19] |
S.Y. Zhang, C.B. Yin, L. Yang, Z.L. Zhang, Z.J. Han, Sens. Actuator. B: Chem. 283 (2019) 399-406. DOI:10.1016/j.snb.2018.12.051 |
| [20] |
N.S.A. Eoma, H.B. Chob, Y. Song, et al., Sens. Actuator. B: Chem. 273 (2018) 1054-1061. DOI:10.1016/j.snb.2018.06.098 |
| [21] |
L.L. Wang, H. Huang, S.H. Xiao, et al., ACS Appl. Mater. Interfaces 6 (2014) 14131-14140. DOI:10.1021/am503286h |
| [22] |
A. Afzal, N. Cioffi, L. Sabbatini, et al., Sens. Actuator. B: Chem. 171 (2012) 25-42. |
| [23] |
Z.C. Song, J. Zhang, J.L. Jiang, Ceram. Int. 46 (2020) 6634-6640. DOI:10.1016/j.ceramint.2019.11.151 |
| [24] |
P.S. Kuchi, H. Roshan, M.H. Sheikhi, J. Alloy. Compd. 816 (2020) 152666. DOI:10.1016/j.jallcom.2019.152666 |
| [25] |
D.L. Chen, M.N. Liu, L. Yin, et al., J. Mater. Chem. 21 (2011) 9332-9342. DOI:10.1039/c1jm11447f |
| [26] |
Q.X. Zhang, S.Y. Ma, R. Zhang, et al., Mater. Lett. 258 (2020) 126783. DOI:10.1016/j.matlet.2019.126783 |
| [27] |
Z. Wang, C. Hou, Q. De, F. Gu, D. Han, ACS Sens. 3 (2018) 468-475. DOI:10.1021/acssensors.7b00896 |
| [28] |
T. Nagyne-Kovacs, L. Studnicka, I.E. Lukacs, et al., Nanomaterials 10 (2020) 891. DOI:10.3390/nano10050891 |
| [29] |
G. Lei, Z. Wang, J. Xiong, et al., Int. J. Hydrog. Energy 45 (2020) 10257-10267. DOI:10.1016/j.ijhydene.2020.01.238 |
| [30] |
A.A. Felix, R.A. Silva, M.O. Orlandi, CrystEngComm 22 (2020) 4640-4649. DOI:10.1039/d0ce00599a |
| [31] |
H. Yuan, S.A.A.A. Aljneibi, J. Yuan, et al., Adv. Mater. 31 (2019) 1807161. DOI:10.1002/adma.201807161 |
| [32] |
D. Wang, K.C. Wan, M.L. Zhang, et al., Sens. Actuator. B: Chem. 283 (2019) 714-723. DOI:10.1016/j.snb.2018.11.125 |
| [33] |
Q. Hu, J.Q. He, J.Y. Chang, et al., ACS Appl. Nano Mater. 3 (2020) 9046-9054. DOI:10.1021/acsanm.0c01731 |
| [34] |
Y. Chen, H. Li, Q. Ma, et al., Appl. Surf. Sci. 439 (2018) 649-659. DOI:10.1016/j.apsusc.2018.01.084 |
| [35] |
K. Xu, W. Zhao, X. Yu, S. Duan, W. Zeng, Phys. E 117 (2020) 113825. DOI:10.1016/j.physe.2019.113825 |
| [36] |
P.G. Choi, T. Fuchigami, K.I. Kakimoto, Y. Masuda, ACS Sens. 5 (2020) 1665-1673. DOI:10.1021/acssensors.0c00290 |
| [37] |
Y. Sun, Z. Dong, D. Zhang, et al., Sens. Actuator. B: Chem. 326 (2021) 128791. DOI:10.1016/j.snb.2020.128791 |
| [38] |
X.Y. Huang, Z.T. Chi, J. Liu, et al., Sens. Actuator. B: Chem. 304 (2020) 127305. DOI:10.1016/j.snb.2019.127305 |
| [39] |
Y.C. Wang, Z.S. Sun, S.Z. Wang, et al., J. Mater. Sci. 54 (2019) 14055-14063. DOI:10.1007/s10853-019-03877-y |
| [40] |
L.L. Sui, X.X. Song, X.L. Cheng, et al., CrystEngComm 17 (2015) 6493-6503. DOI:10.1039/C5CE00693G |
| [41] |
F.X. Ji, X.P. Ren, X.Y. Zheng, et al., Nanoscale 8 (2016) 8696-8703. DOI:10.1039/C6NR00880A |
| [42] |
L. Zhu, W. Zeng, Y. Li, J. Yang, Phys. E 106 (2019) 170-175. DOI:10.1016/j.physe.2018.10.038 |
| [43] |
S. Shen, X. Zhang, X. Cheng, et al., ACS Appl. Nano Mater. 2 (2019) 8016-8026. DOI:10.1021/acsanm.9b02072 |
| [44] |
S. Bai, J. Han, X. Fan, et al., New J. Chem. 44 (2020) 2402-2407. DOI:10.1039/c9nj06198c |
| [45] |
Z. Shen, X. Zhang, R. Mi, et al., Sens. Actuator. B: Chem. 270 (2018) 492-499. DOI:10.1016/j.snb.2018.05.034 |
| [46] |
N. Luo, G. Sun, B. Zhang, et al., Sens. Actuator. B: Chem. 277 (2018) 544-554. DOI:10.1016/j.snb.2018.09.061 |
| [47] |
W. Li, H. Xu, T. Zhai, et al., J. Alloy. Compd. 695 (2017) 2930-2936. DOI:10.1016/j.jallcom.2016.11.380 |
| [48] |
P. Hao, P. Song, Z. Yang, Q. Wang, J. Alloy. Compd. 806 (2019) 960-967. DOI:10.1016/j.jallcom.2019.07.313 |
| [49] |
Y. Yang, X. Wang, G. Yi, et al., Nanomaterials 9 (2019) 1599. DOI:10.3390/nano9111599 |
| [50] |
Y. Zou, S. Chen, J. Sun, et al., ACS Sens. 2 (2017) 897-902. DOI:10.1021/acssensors.7b00276 |
| [51] |
Q. Wei, J. Sun, P. Song, Z. Yang, Q. Wang, J. Alloy. Compd. 831 (2020) 154788. DOI:10.1016/j.jallcom.2020.154788 |
| [52] |
Q. Wei, J. Sun, P. Song, et al., Sens. Actuator. B: Chem. 304 (2020) 127306. DOI:10.1016/j.snb.2019.127306 |
| [53] |
M. Wu, X. Zhang, S. Gao, et al., CrystEngComm 15 (2013) 10123-10131. DOI:10.1039/c3ce41471j |
| [54] |
Q. Zhang, S. Wang, H. Fu, et al., ACS Omega 5 (2020) 11466-11472. DOI:10.1021/acsomega.0c00497 |
| [55] |
B. Zhang, Y. Li, N. Luo, et al., Sens. Actuator. B: Chem. 321 (2020) 128461. DOI:10.1016/j.snb.2020.128461 |
| [56] |
K. He, S. He, W. Yang, Q. Tian, J. Alloy. Compd. 808 (2019) 151704. DOI:10.1016/j.jallcom.2019.151704 |
| [57] |
X. Lu, D. Liu, T. Han, et al., J. Alloy. Compd. 765 (2018) 1061-1071. DOI:10.1016/j.jallcom.2018.06.245 |
| [58] |
W. He, X. Wu, Y. Li, et al., Chin. Chem. Lett. 31 (2020) 2774-2778. DOI:10.1016/j.cclet.2020.07.019 |
| [59] |
M. Liu, J. Yang, Q. Qu, P. Zhu, W. Li, J. Power Sources 273 (2015) 848-856. DOI:10.1016/j.jpowsour.2014.09.176 |
| [60] |
K.C. Kwon, J.M. Suh, T.H. Lee, et al., ACS Sens. 4 (2019) 678-686. DOI:10.1021/acssensors.8b01526 |
| [61] |
D. Gu, X. Li, Y. Zhao, J. Wang, Sens. Actuator. B: Chem. 244 (2017) 67-76. DOI:10.1016/j.snb.2016.12.125 |
| [62] |
Y. Huang, W. Jiao, Z. Chu, et al., J. Mater. Chem. C 7 (2019) 8616-8625. DOI:10.1039/c9tc02436k |
| [63] |
W.J. Yan, C. Lv, D. Zhang, et al., ACS Appl. Mater. Interfaces 12 (2020) 26746-26754. DOI:10.1021/acsami.0c07193 |
| [64] |
F.H. Zhang, Y.Y. Wang, L. Wang, et al., J. Alloy. Compd. 805 (2019) 180-188. DOI:10.1016/j.jallcom.2019.06.369 |
| [65] |
L. Deng, L. Bao, J. Xu, D. Wang, X. Wang, Chin. Chem. Lett. 31 (2020) 2041-2044. DOI:10.1016/j.cclet.2020.04.033 |
| [66] |
L.L. Sui, Y.M. Xu, X.F. Zhang, et al., Sens. Actuator. B: Chem. 208 (2015) 406-414. DOI:10.1016/j.snb.2014.10.138 |
| [67] |
Y. Zhang, S.J. Park, J. Mater. Chem. A 6 (2018) 20304-20312. DOI:10.1039/c8ta08385a |
| [68] |
X. Gao, Q. Ouyang, C. Zhu, X. Zhang, Y. Chen, Appl. Nano Mater. 2 (2019) 2418-2425. DOI:10.1021/acsanm.9b00308 |
| [69] |
C. Wang, Y. Li, P. Qiu, et al., Chin. Chem. Lett. 31 (2020) 1119-1123. DOI:10.1016/j.cclet.2019.08.042 |