 2022, Vol. 33


b Shanghai Normal University Tianhua College, Shanghai 201815, China;
c School of Environmental and Materials Engineering, College of Engineering, Shanghai Polytechnic University, Shanghai 201209, China;
d Department of Physics, Faculty of Science and Technology, Thammasat University, Pathumthani 12120, Thailand;
e Thammasat Research Unit in Innovative Sensor and Nanoelectronic Devices, Thammasat University, Pathumthani 12120, Thailand
Hydrogen sulfide (H2S) is a colorless, corrosive, inflammable, malodorous gas. It is always produced in sewage plants, oil, coal mines, etc. H2S is also widely used in laboratories, chemical industries, and serving as an essential reactant in the production of heavy water. It might be caused sore throat, cough, and eye irritation once people exposed to H2S, even at a small dose of such toxic gas [1]. Therefore, there is still a great requirement to find a way to easily and cost-effectively monitor trace amounts of H2S. So far, H2S has been monitored mainly by metal oxides or its composite based gas sensors, and the operating temperatures are normally higher than 200 ℃ [2]. Such a high temperature hinders their practical applications. Hence, it requires exploring new types of H2S sensors with enhanced response and low power consumption.
Metal-organic frameworks (MOFs), constructed from transition-metal cations and multidentate organic linkers with coordination bonds, possess tunable nano-scale porosity and structure [3-5], which attracts huge attention as a hot topic in catalysis [6], drug delivery [7], energy device [8], sensors and gas storage [9-11]. Benefiting from the unique structure, one critical feature of MOFs is that nanoscale metal particles are easily filled in their cavities, which improves the stability of nanoparticles and endows MOFs with new functions [12]. For example, Kitagawa and co-workers prepared Pd/HKUST-1 composites, which had a significantly improved hydrogen storage capacity compared to pure HKUST-1 [13].
Recently, calcining MOF precursor is a feasible way to prepare porous metal oxides with controlled morphology and compositions, and the merits of MOF can be retained after calcination [14-21]. For example, In2O3 hollow nano-rods were synthesized from In-MOF after calcinating, and it exhibited enhanced ethanol sensing performance [22]. Koo et al. used MOFs as templates to prepare PdO/Co3O4 by high-temperature calcination, which can detect human exhaled gas [23]. There are several advantages for MOF-derived hybrid structures to fabricate gas sensors, including the variation in composition, large porosity ratio, uniform distribution of components and diverse morphology [24-26]. Nevertheless, noble metal doping plays important role in the improvement of sensing response. Therefore, it will be helpful to design and synthesize the MOF-derived hybrid structures based sensors with excellent sensing performance.
Herein, the sensing materials of Ag/In2O3 porous hexagonal tubes were designed and synthesized by calcining Ag+-impregnated CPP-3(In) precursors. Then, the influences of operating temperature and composition of Ag/In2O3 for H2S-sensing response were investigated. Finally, the behavior and mechanism of Ag/In2O3 gas sensors were made a thorough investigation.
All chemicals were purchased from Sinopharm Chemical Reagent Co., Ltd. in reagent grade. The hexagonal rod-like CPP-3(In) was synthesized using the previous reported method [22]. Briefly, 0.267 g In(NO3)3·4.5H2O and 0.107 g of 1, 4-benzenedicarboxylic acid (H2BDC) were added in 30 mL N, N-dimethylformamide (DMF), and then 50 μL NaOAc (0.04 mol/L) was put in after continuous stirring. The obtained precursors were heated at 140 ℃ for 10 min and then cooled down to 25 ℃. The dispersion was centrifuged at 8000 rpm for 30 min, followed by washing with DMF and methanol for 3 times, and then drying at 80 ℃ for overnight.
The preparation of Ag+/CPP-3(In) was utilizing an ion impregnation route. AgNO3 and CPP-3(In) with different weight percent ratios (0, 1.5 wt%, 2.5 wt% and 3.5 wt%) were put together with 20 mL deionized water with continuous stirring at 25 ℃ for 3 days. The mixture was subjected to bath sonication by ethanol, and then the samples (Ag+/CPP-3(In)) were prepared after overnight dried at 60 ℃. To obtain metal oxide-based sensing materials (In2O3 and Ag/In2O3), the MOF specimens were thermally heated at 450 ℃ for 1–2 h under an ambient environment. The heating rate plays an important role to keep the shape of MOF, and it was thus strictly controlled at 1–2 ℃ per minute.
The structure information was characterized by X-ray diffraction using a monochromatized Cu target (XRD, D8-Advance, Bruker, Germany, λ = 1.5418 Å), and X-ray photoelectron spectroscopy (XPS, Escalab 250Xi, Thermo, UK). The surface morphology of MOF and oxides were observed by scanning electron microscopy (SEM, S-4800, Hitachi, Japan). The qualitative elemental analysis was investigated by an energy dispersive X-ray spectrometer (EDX), affiliated to the SEM. A transmission electron microscope (TEM, JEM-2100F, JEOL, Japan) was selected to examine the sample microstructure at an accelerating voltage of 200 kV.
The Ag/In2O3 porous hexagonal tubes were blended with DI water (4:1) to produce a homogeneous paste. Such paste was coated on a ceramic tube, and then dried under an infrared dryer to obtain sensitive film. Finally, the welded gas sensors were aged in an aging benchtop at 340 ℃ for 7 days.
The sensor performance was tested through a gas sensing analysis instrument (WS-30A, Weisheng, China). The sensing response (S) is defined as the resistance ratio of gas sensors in the target gas (Rg) to that in the air (Ra), and it can be described as S = Ra/Rg. To optimize the operating temperature, the sensor was evaluated at 30–200 ℃.
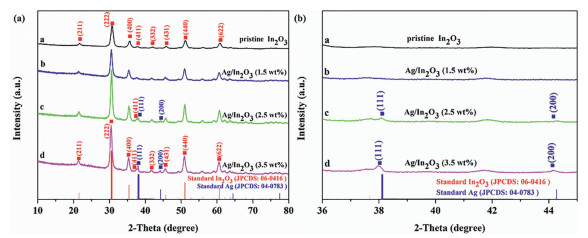
XRD patterns of the CPP-3(In), pristine In2O3, Ag+/CPP-3(In), and Ag/In2O3 are displayed in Fig. 1 and Fig. S1 (Supporting information). It can be found in Fig. S1 that the positions of characteristic peaks of Ag+/CPP-3(In) are well-matched with the diffraction peaks of CPP-3(In), indicating that the introduction of Ag+ did not change the crystal structure of CPP-3. Besides, the sharp characteristic peaks of Ag+/CPP-3(In) show a higher crystallinity [22]. After the calcination of MOFs at 450 ℃, XRD patterns of the In2O3 and Ag/In2O3 with different ratios are illustrated in Fig. 1. The main diffraction peaks (2θ = 21.498°, 30.580°, 35.466°, 37.685°, 41.845°, 45.691°, 51.037° and 60.676°), corresponding to the (211), (222), (400), (411), (332), (431), (440) and (622) planes of the In2O3 with the cubic crystal structure (JCPDS No. 06–0416).

|
Download:
|
| Fig. 1. (a) X-ray diffraction patterns of the as-synthesized In2O3 and Ag/In2O3 oxides. (b) Enlarged region of XRD patterns (36°−45°). | |
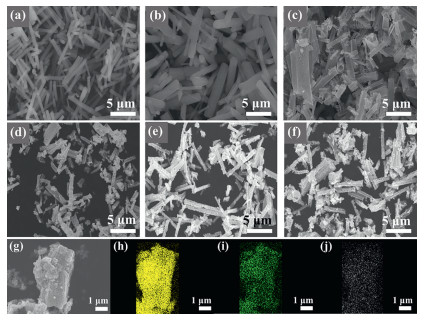
For the Ag/In2O3 (1.5 wt%), no obvious Ag diffraction peak is observed, mainly due to the low Ag content. For the Ag/In2O3 (2.5 wt%) and Ag/In2O3 (3.5 wt%), there are obvious diffraction peaks at 38.116° and 44.277°, corresponding to (111) and (200) of elementary substance Ag (JCPDS No. 04–0783), respectively. Such results indicate that the Ag nanoparticles were successfully introduced into the composites. The formation processes of Ag nanoparticles are speculated as follows: Ag+ firstly enters the pores of CPP-3, and then Ag+ may be reduced to Ag nanoparticles by certain reducing gasses generated by the decomposition of organic ligands in CPP-3 during the calcination process [22]. The morphologies of CPP-3(In), Ag+/CPP-3(In) templates, In2O3, and Ag/In2O3 (1.5–3.5 wt%) were characterized by SEM. As shown in Fig. 2a, all CPP-3(In)s are nano-rod with a hexagonal shape, the size is uniform at about 2.0 µm in diameter and a length of 10.0 µm. The morphology of Ag+/CPP-3(In) in Fig. 2b is similar to that of CPP-3(In), only displaying a small number of broken short rods, may be caused by the process of introducing Ag+. After calcining in air, MOF is completely converted into metal oxides (as described in the XRD results). As shown in Figs. 2c–f, pristine In2O3 illustrates a hexagonal tube shape, and there are some broken tubes and fragments. Compared with Ag+/CPP-3(In), the tube of Ag/In2O3 has a smaller diameter size, reduced from 10 µm to 5 µm, with a rough and porous surface. Compared with In2O3, the number of the short tube increases and the thickness is uneven. As the amount of Ag increased, the surface of Ag/In2O3 tubes becomes rougher. EDS mapping results are shown in Figs. 2g–j. In, O and Ag elements are evenly distributed in the Ag/In2O3 (2.5 wt%). This also shows that Ag nanoparticles are uniformly dispersed in In2O3 tubes.

|
Download:
|
| Fig. 2. SEM images of different samples: (a) CPP-3(In), (b) Ag+/CPP-3(In), (c) In2O3, (d) Ag/In2O3 (1.5 wt%), (e) Ag/In2O3 (2.5 wt%) and (f) Ag/In2O3 (3.5 wt%). EDS elemental mapping of Ag/In2O3 (2.5 wt%): (g) SEM image and (h-j) element distribution (In, O and Ag). | |
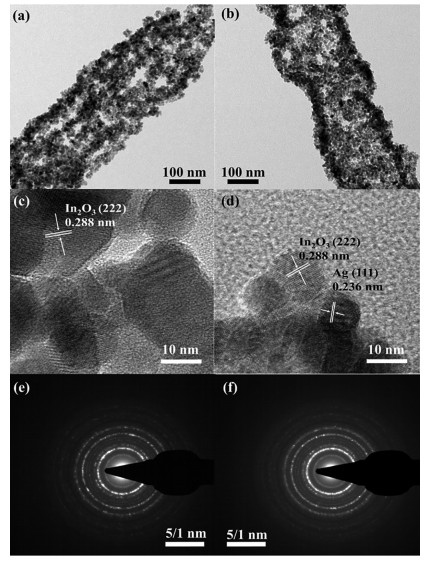
TEM was selected to further observe the microstructures of different samples. Figs. 3a and b are TEM images of In2O3 and Ag/In2O3 (2.5 wt%), respectively. The tube walls of In2O3 and Ag/In2O3 (2.5 wt%) are assembled by nanoparticles, this is mainly formed during the calcination process. HRTEM images are shown in Figs. 3c and d. For the Ag/In2O3 (2.5 wt%), the interplanar distance of 0.288 nm is in line with the (222) planes of cubic In2O3 [27], and the lattice distance of 0.236 nm belongs to the (111) planes of Ag [28]. Fig. 3d proves that Ag is not doped into the lattice of In2O3, but co-existing with In2O3 nanoparticles to form a tube-like structure. As shown in Figs. 3e and f, a series of diffraction rings can be found in SAED patterns, indicating the polycrystalline nature of the In2O3 and Ag/In2O3 (2.5 wt%).

|
Download:
|
| Fig. 3. TEM images of (a) In2O3 and (b) Ag/In2O3 (2.5 wt%). HRTEM images of (c) In2O3 and (d) Ag/In2O3 (2.5 wt%); SAED images of (e) In2O3 and (f) Ag/In2O3 (2.5 wt%). | |
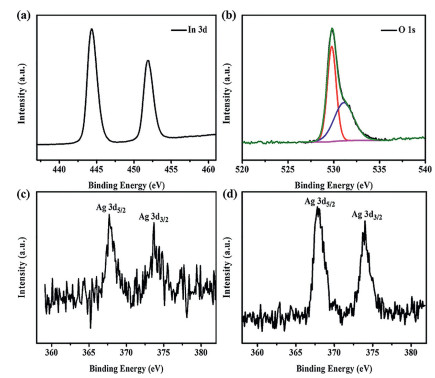
XPS was selected to evaluate the surface chemical state of specimens, the full XPS spectra of pristine In2O3, Ag/In2O3 (2.5 wt%), and Ag/In2O3 (3.5 wt%) are listed in Fig. S1. The In 3d spectrum of Ag/In2O3 (2.5 wt%) is shown in Fig. 4a. The two main peaks at 451.7 and 444.4 eV are related to In 3d (both In 3d3/2 and 3d5/2), respectively [27]. Fig. 4b is the O 1s spectrum of Ag/In2O3 (2.5 wt%). The peak at 530.4 eV belongs to the oxygen coordination (O2–) in In–O, and the other peak at 531.9 eV owns to the adsorbed oxygen species (O− and O2−) [29, 30]. The sensing performance is highly related to the amount of surface adsorbed oxygen. As shown in Figs. 4c and d, the binding energy of 368.5 eV and 374.5 eV are related to Ag 3d (Ag0 3d5/2 and 3d3/2), and that is more obvious in Ag/In2O3 (3.5 wt%) [31]. This indicates that the Ag in the Ag/In2O3 sample exists as an elementary substance Ag, which is consistent with the XRD results.

|
Download:
|
| Fig. 4. XPS spectra of the Ag/In2O3 (2.5 wt%): (a) In 3d, (b) O 1s, (c) Ag 3d; and (d) Ag 3d spectrum of Ag/In2O3 (3.5 wt%). | |
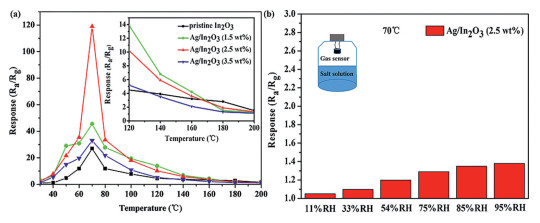
The working temperature and the concentration of noble metal are important parameters for sensing performance. To find the optimized working temperature and loading contents of additives, the performance of In2O3 and Ag/In2O3 toward 5 ppm H2S at different operating temperatures was investigated. As illustrated in Fig. 5a, all sensors show an "increasing-maximum-decreasing" trend, and the maximum responses to 5 ppm H2S were all operated at 70 ℃, and the response decreased to 1.1–1.5 when the operating temperatures rose to 200 ℃. It also indicates that the Ag/In2O3 (2.5 wt%) based sensor has the highest response value of 119 to 5 ppm H2S, around 4 times higher than pristine In2O3. Further increasing the amount of Ag to 3.5 wt%, the sensor responses decreased. Therefore, Ag/In2O3 (2.5 wt%) is the optimized sensing material for H2S detection, operated at 70 ℃.

|
Download:
|
| Fig. 5. (a) Gas response towards 5 ppm H2S at various working temperatures; (b) The effect of RH to the Ag/In2O3 (2.5 wt%) based sensor. | |
Besides, the response of the gas sensor is easily affected by the relative humidity (RH) at low temperatures, so the response of the sensor at different RH was tested. The different saturated salts were selected to produce RH atmosphere [32], including 95% RH KNO3, 85% RH KCl2, 75% RH NaCl2, 54% RH Mg(NO3)2, 33% RH MgCl2, and 11% RH LiCl. The test results show that the Ag/In2O3 (2.5 wt%) sensor possesses the highest response of 1.38 at 95%RH, as shown in Fig. 5b. Therefore, at the optimized working temperature of 70 ℃, the influence of humidity on the sensor is negligible.
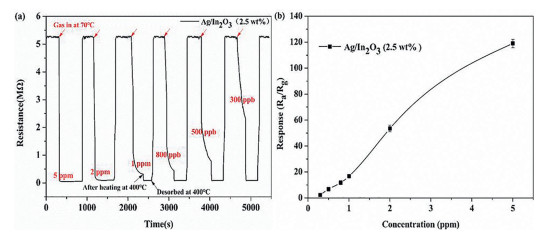
Fig. 6a illustrates the resistance variation versus time of the Ag/In2O3 (2.5 wt%) gas sensor to 0.3–5 ppm H2S at 70 ℃. The response curve shows a stepwise distribution exposed to different concentrations of H2S. In Fig. 6b, as the H2S concentration decreased from 5 ppm to 0.3 ppm, the response of the Ag/In2O3 (2.5 wt%) sensor gradually decreases. When the H2S concentration is reduced to 0.3 ppm, the response of Ag/In2O3 based gas sensor (2.5 wt%) is still as high as 2.25, which indicates this sensor is able to effectively detect H2S with low concentration.

|
Download:
|
| Fig. 6. (a) Resistance variation versus time, and (b) response variation versus H2S concentration for Ag/In2O3 (2.5 wt%) gas sensor to the different amount of H2S gas at 70 ℃. | |
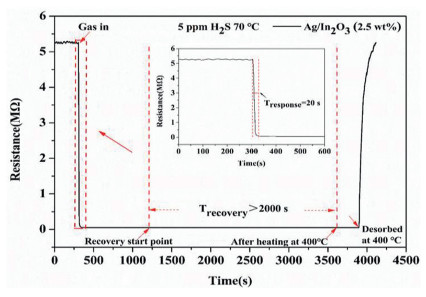
Fast response/recovery is also crucial in the practical application of sensors. The dynamic response-recovery trend of Ag/In2O3 (2.5 wt%) sensor towards 5 ppm H2S at 70 ℃ is displayed in Fig. 7. After exposure to the target gas, the sensor can reach 90% resistance change within 20 s. However, a very long recovery time is required, and this sensor can only recover to 8% of the maximum value for 3600 s. Herein, the Joule heating effect was selected to speed up the desorption of H2S molecules [33, 34]. After optimization, we found 5.5 V pulse voltage (400 ℃) can effectively desorb the H2S on the surface, and the sensor can restore to the initial state in a short time.

|
Download:
|
| Fig. 7. The response-recovery curve of Ag/In2O3 (2.5 wt%) gas sensor to 5 ppm H2S at 70 ℃. | |
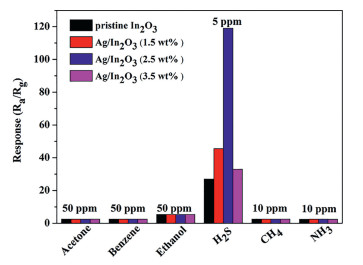
Selectivity is one of the most important factors [35]. To test this characteristic, the response of Ag/In2O3 (2.5 wt%) gas sensor to various gasses such as acetone (CH3COCH3), benzene (C6H6), ethanol (C2H5OH), hydrogen sulfide (H2S), methane (CH4), and ammonia (NH3) were tested. Fig. 8 shows that the response of Ag/In2O3 (2.5 wt%) sensor to 5 ppm H2S is 119, which is much higher than the response to 50 ppm ethanol and other gasses. Therefore, the gas sensor based on Ag/In2O3 (2.5 wt%) exhibits exceptional selectivity to the detection of H2S at low operating temperature.

|
Download:
|
| Fig. 8. Four sets of sensors selectivity to 5 ppm H2S and other gasses with different concentrations (10 ppm or 50 ppm) at 70 ℃. | |
Reproducibility is another important parameter in the field of sensing. Fig. 9a illustrates the repeatability of Ag/In2O3 (2.5 wt%) gas sensor during the continuous response/recovery process. The results indicate good reversibility for six cycles of testing, the resistance does not show significant attenuation. The interesting point is that the sensor can keep the same initial state of resistance and recovery speed. Obviously, the Ag/In2O3 (2.5 wt%) sensor has very stable repeatability. The long-term stability is also important for the gas sensors in practical applications, the response towards 5 ppm H2S was continuously measured within a month. The results in Fig. 9 indicate the Ag/In2O3 (2.5 wt%) sensor exhibits good long-term stability.

|
Download:
|
| Fig. 9. (a) Repeatability of Ag/In2O3 (2.5 wt%) gas sensor after continuous exposure (6 cycles) to 5 ppm H2S. (b) Long-term stability of Ag/In2O3 (2.5 wt%) gas sensor. | |
The enhanced sensing performance of Ag/In2O3 (2.5 wt%) gas sensors was summarized as the following points:
The pristine In2O3 [36, 37] is a surface-controlled type semiconductor, and the resistance change is mainly related to chemisorbed oxygen [38]. Once the In2O3 is put in the air, as shown in Fig. 10a, the oxygen is chemisorbed on the surface of In2O3 by taking free electrons to form O2−or O−. The electron concentration of the In2O3 sensor is thus reduced and the resistance is increased.

|
Download:
|
| Fig. 10. Schematic illustration of the energy band structures of In2O3 in (a) air and (b) H2S, and the energy band structures of Ag/In2O3 in (c) air and (d) H2S atmosphere, respectively. | |
Once exposed to reducing gas (H2S), it can react with the chemisorbed oxygen to release the electrons into In2O3, leading to the decrease of the resistance of In2O3 (Fig. 10b). The reaction can be described as below:

|
(1) |
For the Ag/In2O3 nanocomposite, the decorated Ag on the surface of In2O3 may form nano-junctions at the interface and induce the electronic sensitization effect [39]. The electrons of In2O3 from the conduction bands transfer to Ag nanostructure and create the depletion zone at the interfaces of Ag/In2O3 nanocomposite, which may modulate the resistance and surface reactivity, as shown in Fig. 10c. When the Ag/In2O3 sensor is exposed to H2S in Fig. 10d, the reducing gas releases electrons into the Ag/In2O3, the width of the depletion layer was reduced and the resistance was significantly decreased. Since the change of the depletion layer in the Ag/In2O3 is much more than in the In2O3, the Ag/In2O3 sensor exhibits a higher sensing response.
Thus, the heterojunction structure acts as a lever to modulate the charge concentration and charge mobility of the sensor surface, thereby enhancing the sensing properties. The substantial improvement of the response may be attributed to the larger change in resistance caused by the increased participation of electrons and creation of depletion zones due to the heterojunction structure of the Ag/In2O3 nanocomposite.
Besides, since Ag nanoparticles have high catalytic activity, they not only provide abundant active sites, but also accelerate surface reactions with lower activation energy [40]. Although the addition of precious metals can improve the performance of the sensing material, an appropriate concentration is necessary to obtain the maximum response. In this work, the maximum response was observed for Ag/In2O3 (2.5 wt%). When the amount of Ag added is too low (less than 2.5 wt%), the catalytic effect is not enough to bring H2S close to all surfaces of the sensor. For this reason, the enhancement of gas response is limited. When the amount of Ag added exceeds 2.5 wt% and reaches 3.5 wt%, the response of the sensor suddenly decreases, because more Ag nanoparticles can catalyze more H2S gas per unit time, but the desorption process of H2S is also enhanced, resulting in a decrease in the actual amount of H2S adsorption and poor gas response [41].
Finally, the porous and hollow structure of Ag/In2O3, as shown in Fig. 2, provides more sensing reaction sites, which facilitates gas diffusion and adsorption of the sensing layer, and also facilitates uniform loading of Ag nanoparticles throughout the sensing layer.
Therefore, the great enhancement of gas response of Ag/In2O3 (2.5 wt%) based sensor could be attributed the electronic effects of Ag nanoparticles, the catalytic activity of Ag nanoparticles, and the porous and hollow structure of Ag/In2O3 (2.5 wt%).
In this work, Ag/In2O3 was successfully prepared from Ag+-impregnated CPP-3(In) through a facile two-step method. The Ag/In2O3 exhibits porous hexagonal tube shape, and the response of the Ag/In2O3 (2.5 wt%) based sensor towards 5 ppm H2S at 70 ℃ reaches 119, which is four times higher than the pristine In2O3 sensor. The great enhancement of gas response of Ag/In2O3 (2.5 wt%) could be attributed as follows: 1) The electronic sensitization of Ag nanoparticles; 2) The catalytic activity of Ag nanoparticles; 3) The porous and hollow structure of Ag/In2O3 (2.5 wt%). In short, the Ag/In2O3 (2.5 wt%) is a promising candidate to be constructed as a high performance, low power-consumption H2S sensor.
Declaration of competing interestThe authors declare that they have no known competing financial interests or personal relationships that could have appeared to influence the work reported in this paper.
AcknowledgmentsThis work was supported by the National Natural Science Foundation of China (No. 61471233) and Shanghai Sailing Program (No. 21YF1431400).
Supplementary materialsSupplementary material associated with this article can be found, in the online version, at doi:10.1016/j.cclet.2021.06.016.
| [1] |
V. Nagarajam, R. Chandiramouli, J. Inorg. Organomet. Polym. Mater. 26 (2016) 394-404. DOI:10.1007/s10904-016-0331-9 |
| [2] |
Y.Y. Wang, G.T. Duan, Y.D. Zhu, et al., Sens. Actuat. B: Chem. 228 (2016) 74-84. DOI:10.1007/978-3-319-41827-8_7 |
| [3] |
Q.L. Zhu, Q. Xu, Chem. Soc. Rev. 43 (2014) 5468-5512. DOI:10.1039/C3CS60472A |
| [4] |
H. Furukawa, K.E. Cordova, M. O'Keeffe, O.M. Yaghi, Science 341 (2013) 1230444. DOI:10.1126/science.1230444 |
| [5] |
Y. Sun, Z. Dong, D. Zhang, et al., Sens. Actuat. B: Chem. 326 (2021) 128791. DOI:10.1016/j.snb.2020.128791 |
| [6] |
A. Corma, H. Garcia, F. Labres, et al., Chem. Rev. 110 (2010) 4606-4655. DOI:10.1021/cr9003924 |
| [7] |
P. Horcajada, R. Gref, T. Baati, et al., Chem. Rev. 112 (2012) 1232-1268. DOI:10.1021/cr200256v |
| [8] |
W. Xia, A. Mahmood, R.Q. Zou, et al., Energy. Environ. Sci. 8 (2015) 1837-1866. DOI:10.1039/C5EE00762C |
| [9] |
B.R. Pimentel, A. Parulkar, E. Zhou, et al., ChemSusChem 7 (2014) 3202-3240. DOI:10.1002/cssc.201402647 |
| [10] |
Z.J. Zhang, Z.Z. Yao, S.C. Xiang, et al., Energy. Environ. Sci. 7 (2014) 2868-2899. DOI:10.1039/C4EE00143E |
| [11] |
X. Zhang, Y.D. Xu, B.X. Ye, J. Alloy Compd. 767 (2018) 651-656. DOI:10.1016/j.jallcom.2018.07.175 |
| [12] |
L.L. Guo, F. Chen, N. Xie, et al., Sens. Actuat. B: Chem. 272 (2018) 185-194. DOI:10.1016/j.snb.2018.05.161 |
| [13] |
G.Q. Li, H. Kobayashi, J.M. Taylor, et al., Nat. Mater. 13 (2014) 802-806. DOI:10.1038/nmat4030 |
| [14] |
X. Wang, S.H. Li, L.L. Xie, et al., Ceram. Inter. 46 (2020) 15858-15866. DOI:10.1016/j.ceramint.2020.03.133 |
| [15] |
Y.V. Kaneti, J. Tang, R.R. Salunkhe, et al., Adv. Mater. 12 (2017) 1604898. DOI:10.1002/adma.201604898 |
| [16] |
S. Dang, Q.L. Zhu, Q. Xu, Nat. Rev. Mater. 1 (2017) 17075. |
| [17] |
R.R. Salunkhe, Y.V. Kaneti, Y. Yamauchi, ACS. Nano 6 (2017) 5293-5308. DOI:10.1021/acsnano.7b02796 |
| [18] |
M.S. Yao, W.X. Tang, G.E. Wang, et al., Adv. Mater. 26 (2016) 5229-5234. DOI:10.1002/adma.201506457 |
| [19] |
H. Yu, H.S. Fan, B. Yadian, et al., ACS. Appl. Mater. Inter. 48 (2015) 26751-26757. DOI:10.1021/acsami.5b08741 |
| [20] |
Y.T. Wang, Y.Y. Lü, W.W. Zhan, et al., J. Mater. Chem. A 24 (2015) 12796-12803. DOI:10.1039/C5TA01108F |
| [21] |
S.H. Li, L.L. Xie, M. He, et al., Sens. Actuat. B: Chem. 310 (2020) 127828. DOI:10.1016/j.snb.2020.127828 |
| [22] |
K. Tao, X. Han, Q. Yin, et al., ChemistrySelect 2 (2017) 10918-10925. DOI:10.1002/slct.201701752 |
| [23] |
W.T. Koo, S. Yu, S.J. Choi, et al., ACS. Appl. Mater. Inter. 9 (2017) 8201-8210. DOI:10.1021/acsami.7b01284 |
| [24] |
S.T. Meek, J.A. Greathouse, M.D. Allendorf, Adv. Mater. 2 (2011) 249-267. DOI:10.1002/adma.201002854 |
| [25] |
J. Lee, O.K. Farha, J. Roberts, et al., Chem. Soc. Rev. 5 (2009) 1450-1459. DOI:10.1039/b807080f |
| [26] |
H. Furukawa, K.E. Cordova, M. O'Keeffe, et al., Science 6149 (2013) 1230444. |
| [27] |
X.S. Liang, T.H. Kim, J.W. Yoon, et al., Sens. Actuat. B: Chem. 209 (2015) 934-942. DOI:10.1016/j.snb.2014.11.130 |
| [28] |
R. Raji, K.S. Sibi, K.G. Gopchandran, Appl. Surf. Sci. 427 (2018) 863-875. DOI:10.1016/j.apsusc.2017.09.050 |
| [29] |
X.B. Hu, Z.G. Zhu, Z.H. Li, et al., Sens. Actuat. B: Chem. 264 (2018) 139-149. DOI:10.1016/j.snb.2018.02.110 |
| [30] |
D. Andreeva, T. Tabakova, V. Idakiev, et al., Appl. Catal. A: Gen. 169 (1998) 9-14. DOI:10.1016/S0926-860X(97)00302-5 |
| [31] |
M.D. Ding, N. Xie, C. Wang, et al., Sens. Actuat. B: Chem. 252 (2017) 418-427. DOI:10.1016/j.snb.2017.06.016 |
| [32] |
T. Fei, H.R. Zhao, K. Jiang, et al., Sens. Actuat. B: Chem. 208 (2015) 277-282. DOI:10.1016/j.snb.2014.11.044 |
| [33] |
M. He, L.L. Xie, X.L. Zhao, et al., J. Alloy. Compd. 788 (2019) 36-43. DOI:10.1016/j.jallcom.2019.01.349 |
| [34] |
Y.W. Zhang, R. Si, C.S. Liao, et al., J. Phys. Chem. B 107 (2003) 10159-10167. |
| [35] |
M. Wu, M. He, Q.K. Hu, et al., ACS. Sens. 4 (2019) 2763-2770. DOI:10.1021/acssensors.9b01308 |
| [36] |
X.Y. Huang, Z.T. Chi, J. Liu, et al., Sens. Actuat. B: Chem. 304 (2020) 127305. DOI:10.1016/j.snb.2019.127305 |
| [37] |
K.C. Wan, D. Wang, F. Wang, et al., ACS. Appl. Mater. Inter. 11 (2019) 45214-45225. DOI:10.1021/acsami.9b16599 |
| [38] |
B.X. Li, Y. Xie, M. Jing, et al., Langmuir 22 (2006) 9380-9385. DOI:10.1021/la061844k |
| [39] |
S. Zhou, M. Chen, Q. Lu, et al., Nanoscale Res. Lett. 14 (2019) 365. DOI:10.1007/978-3-030-36708-4_30 |
| [40] |
Y. Wang, S.R. Wang, Y.Q. Zhao, et al., Sens. Actuat. B: Chem. 125 (2007) 79-84. DOI:10.1016/j.snb.2007.01.037 |
| [41] |
M.D. Ding, N. Xie, C. Wang, et al., Sens. Actuat. B: Chem. 252 (2017) 418-427. DOI:10.1016/j.snb.2017.06.016 |