 2022, Vol. 33


b Shandong Provincial Key Laboratory of Molecular Engineering, School of Chemistry and Chemical Engineering, Qilu University of Technology (Shandong Academy of Sciences), Ji'nan 250353, China
Environmental pollution is one of the main factors hindering social development [1]. Among the numerous pollutants, tetracycline (TC) is a typical antibiotic that seriously pollutes the environment and is harmful for the physical and mental health of humans due to its widespread presence in soil, groundwater, and even drinking water [2-5]. In addition, the prolonged exposure to TC will cause antibiotic resistance in microorganisms [6, 7]. Therefore, it is important to develop an effective method to remove TC [8, 9]. The semiconductor photocatalytic degradation of contaminants is a promising method because of its low toxicity, high efficiency and stability [10-13]. However, since wide-bandgap semiconductors only absorb ultraviolet light, their practical application is hindered by their low visible light utilization and high photogenerated charge recombination efficiency [14-17].
Cerium dioxide (CeO2) is widely used in photocatalysis owing to its non-toxicity and high stability [18-21]. However, traditional CeO2 materials have low visible light utilization and high photogenerated charge recombination efficiency. Compared with traditional CeO2 nanomaterials, two-dimensional CeO2 nanosheets exhibit better photocatalytic performance owing to their larger specific surface area, which can provide more surface-active sites. Moreover, the nanosheet structure can shorten the migration distance of the photogenerated carriers. Thus, CeO2 nanosheets have drawn considerable attention in the field of photocatalysis [22-24]. The two-dimensional nanosheet assembly is not only stable, but also provides a large number of catalytic active sites; hence, the photocatalytic performance can be effectively improved by assembling nanosheets into assembly structures such as microspheres [25, 26]. Furthermore, mesoporous materials provide a larger specific surface area due to the specificity of its structure and have a large number of surface active sites [27-31]. Therefore, the synthesis of mesoporous nanosheet assembly structures would be beneficial. In addition, surface defects can effectively separate photogenerated charges, thus broadening the light absorption spectral range [32-36]. However, surface defect is a double-edged sword in that excessive defects can act as recombination centers, while narrowing the band gap and expanding the absorption range, they shorten the distance between electrons and holes, thereby accelerating the recombination of them. Therefore, the effective control of defects, especially the surface defects of nanosheets remains a challenge.
In this work, mesoporous CeO2 nanosheets assembled into microspheres were prepared by polymer precipitation followed by hydrothermal synthesis, and engineered surface oxygen vacancy defects were manufactured by surface hydrogenation. Under AM 1.5 G illumination, the rate of photocatalytic degradation of TC by the CeO2 nanosheet-assembled microspheres was 99.99%, which is several times higher than that obtained using pristine CeO2 microspheres. The excellent photocatalytic performance of the CeO2 nanosheet-assembled microspheres was mainly because of the formation of special surface oxygen vacancies and the mesoporous nanosheet assembly, which facilitated mass transfer and improved the utilization of light energy and the spatial separation of photogenerated electron-hole pairs. The proposed strategy will pave the way for the manufacturing of high-performance mesoporous nanosheet assembly materials.
Glucose (C6H12O6), acrylamide (C3H5NO), deionized (DI) water, cerium nitrate hexahydrate (Ce(NO3)3·6H2O), and ammonia (NH3·H2O) were purchased from Aladdin Reagent Company. All chemicals were used according to standard operating protocols without further purification.
The formation of engineered surface oxygen vacancies of mesoporous CeO2 nanosheet-assembled microspheres is shown in Scheme 1. In a typical hydrothermal experiment, DI water (80 mL) was taken into a 100 mL beaker, and C6H12O6 (0.01 mol) was added to it under magnetic stirring for 30 min. Then, C3H5NO (0.015 mol) and Ce(NO3)3·6H2O (0.005 mol) were added and the mixture was stirred for 1 h. During this time, the solution became colorless. Finally, NH3·H2O (3.2 mL, 25 wt%) was added dropwise to the solution, and the solution immediately became a hard gel, which was continuously stirred for 5 h. All stirring is done at room temperature (25 ± 1 ℃) and at 400 rpm. The gel-like mixture eventually turned dark brown. After 5 h, the stirred solution was transferred to a polytetrafluoroethylene high-pressure steam chamber (100 mL), and the final temperature was set as 180 ℃ and the holding time was 72 h. After naturally cooling to room temperature (25 ± 1 ℃), product was separated by centrifugation, washed with water and ethanol several times, and dried at 80 ℃ for more than 12 h. The product was fired in a tube furnace at 600 ℃ for 6 h with a heating rate of 5 ℃/min in a N2 atmosphere and then calcined in a muffle furnace at 400 ℃ for 4 h with the same rate in an air atmosphere to obtain CeO2 microspheres.

|
Download:
|
| Scheme 1. Schematic of the formation of D-CeO2. | |
D-CeO2 microspheres were synthesized from the prepared CeO2 microspheres by a one-step calcination process. In a typical procedure, the prepared CeO2 was calcined under hydrogen gas introduced at a flow rate of 10 mL/min in a tube furnace at 500 ℃ for 2 h to obtain D-CeO2, which is denoted as D500-CeO2. The samples obtained by calcining CeO2 at 400 and 600 ℃ are denoted as D400-CeO2 and D600-CeO2, respectively.
Powder X-ray diffraction (XRD) analysis was performed using a Bruker D8 diffractometer with monochromatic Cu Kα radiation (λ = 1.5406 Å) at an acceleration voltage of 40 kV and a current of 20 mA. The surface morphologies and crystal structures of the samples were analyzed using a Hitachi S-4800 scanning electron microscope operated at 15 kV and a Tecnai G2 F20 transmission electron microscope operated at an acceleration voltage of 200 kV. X-ray photoelectron spectroscopy (XPS, Kratos, ULTRA AXIS DLD) was performed to determine the elemental composition of the samples and the chemical states of the constituent elements. Meanwhile, XPS measurements were made with Al Kα (1253.6 eV) excitation source. The chromatic aberration X-ray source was 284.6 eV with a C 1s peak. A PerkinElmer Lambda 950 UV–vis spectrophotometer was used to measure the diffuse reflectance spectrum (DRS) in the wavelength range of 200–1800 nm. A micropore analyser (AUTOSORB-1, Quantachrome Instruments) was used to measure the nitrogen adsorption-desorption isotherms. The specific surface area and pore size distribution were obtained using the Brunaeur–Emmett–Teller (BET) equation and from the adsorption branch of the BET isotherm. Scanning Kelvin probe (SKP) microscopy was performed at room temperature in the laboratory under ambient atmosphere and AM 1.5 G light using a SKP microscope (SKP5050, KP Technology, Scotland).
The photocatalytic performance of CeO2 and D-CeO2 was studied for TC. First, 100 mg of the semiconductor photocatalyst samples were added to a 100 mL TC solution with a solubility of 10 mg/L. The solution mixture was kept in the dark for 20 min, after which aliquots were taken for analysis. Afterward, under a 300 W Xenon lamp with AM 1.5 G filter, took samples every 20 min. Finally, the degradation products were analyzed by liquid UV test. Pure distilled water was taken as a control. The ultraviolet detection wavelength of TC was 357 nm. In addition, in order to determine the stability of the photocatalyst, the used catalyst was recycled by centrifugation, washed with deionized water and ethanol for three times respectively, and then dried for 12 h for the next experiment. The above-mentioned experiment was performed 10 times. Based on this, the adsorption activation and catalytic performance of the catalyst were evaluated.
The Versa STAT 3 electrochemical workstation of Princeton University was used to analyze the photoelectric performance of the samples. First, 0.05 g of sample was dispersed into an ethanol solution with constant stirring and sonicated for 1 h to achieve a uniform dispersion. The dispersion was then evenly sprayed on a FTO glass with a HD-130 (Art-NO.300S.PS) art airbrush. Finally, the FTO glass was placed in a tube furnace and calcined under a N2 atmosphere at 350 ℃ for 2 h. The heating rate was maintained as 5 ℃/min to prevent the sample from falling during the test. The electrochemical workstation was a three-electrode system consisting of a CeO2 or D-CeO2-coated FTO glass as the photoanode, a platinum plate as the counter electrode, Ag/AgCl as the reference electrode, and an aqueous Na2SO4 solution as the electrolyte. The electrolyte was purged with N2 gas before use to de-aerate the solution to prevent the test results from being affected by the presence of air.
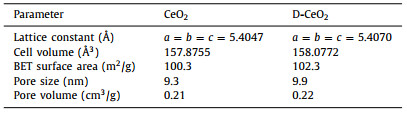
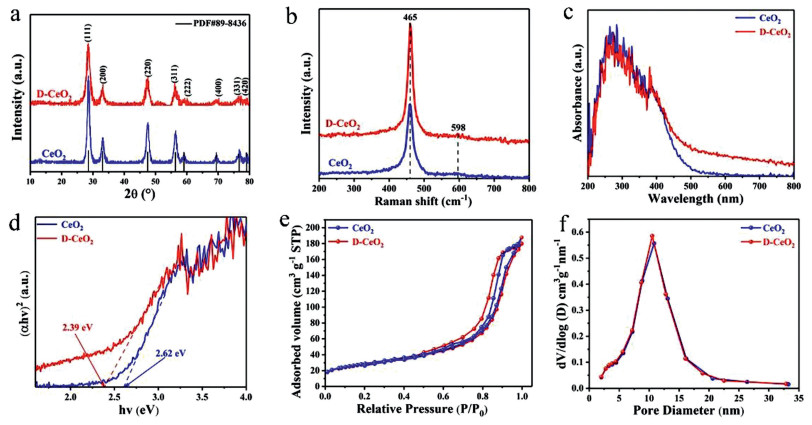
X-ray diffraction (XRD) analysis was performed to identify the crystal structures of the samples. As shown in Fig. 1a, the characteristic peaks at 28.53°, 33.01°, 47.44°, 56.34°, 59.01°, 69.41°, 76.70° and 79.05° correspond to the (111), (200), (220), (311), (222), (400), (331) and (420) planes of CeO2, which indicates that the samples are phase-pure CeO2 [37]. The XRD spectra of CeO2 and D-CeO2 are the same, which indicates the high thermal stability of D-CeO2. The XRD patterns of CeO2, D400-CeO2, D500-CeO2 (D-CeO2) and D600-CeO2 (Fig. S1 in Supporting information) are similar to that of pristine CeO2, which further confirms the high thermal stability of the calcined samples. The crystallinity of the sample decreased after surface hydrogenation. A certain lattice distortion occurred in D-CeO2. As shown in Table 1, after surface hydrogenation, the lattice parameters of CeO2 and D-CeO2 increased slightly, which indicates the formation of surface oxygen vacancy defects. The crystal structure was further analyzed by Raman spectral analysis. The Raman spectra of CeO2 and D-CeO2 exhibit peaks at 465 and 598 cm−1 (Fig. 1b), which are the characteristic peaks of CeO2. D-CeO2 exhibits broader peaks with slightly larger peak areas than those of CeO2, which indicate that D-CeO2 contains a higher amount of surface oxygen vacancies than CeO2 does [38]. Further, the samples were analyzed by ultraviolet-visible (UV–vis) absorption spectroscopy. As shown in Fig. 1c, the samples strongly absorb ultraviolet light in the range of 200–400 nm, which is the characteristic absorption of CeO2. In addition, the absorption in the range of 400–800 nm significantly enhanced after surface hydrogenation, which can be attributed to the formation of surface oxygen vacancies [39]. Further, as shown in Fig. S2 (Supporting information), it can be observed that the color of the samples is also significantly different. The color of D-CeO2 is darker than that of CeO2, broadening the absorption of visible light, which is consistent with the results of UV–vis. In addition, the estimated band gap (~2.39 eV) of D-CeO2 is smaller than that of CeO2 (~2.62 eV), as shown in Fig. 1d. The surface oxygen vacancy defects extend the absorption to the visible-light region, thereby significantly enhancing the solar energy utilization. Figs. 1e and f show the N2 adsorption-desorption isotherms and the corresponding pore size distribution curves of CeO2 and D-CeO2, respectively. The BET surface area, pore size, and pore volume of CeO2 and D-CeO2 are shown in Table 1. The adsorption isotherms show typical type IV hysteresis loops, which indicate that the materials are mesoporous. The mesoporous structure has a large specific surface area and provides a large number of active sites, thereby facilitating mass transfer.

|
Download:
|
| Fig. 1. (a) XRD patterns, (b) Raman spectra, (c) UV–vis reflectance spectra, (d) the corresponding optical band gaps, (e) N2 adsorption-desorption isotherms and (f) the corresponding pore size distribution curves of CeO2 and D-CeO2, respectively. | |
|
|
Table 1 Lattice parameters and structural parameters of CeO2 and D-CeO2. |
The morphology and microstructure were analyzed by scanning electron microscopy (SEM). The low-magnification SEM images of D-CeO2 in Figs. 2a and b show relatively uniform spheres with an average size of ~4.5 µm, which were formed by the assembly of nanosheets. The nanosheet structure provided sufficient surface active sites owing to its large specific surface area. After surface hydrogenation, the size remained almost unchanged compared with that of the pristine sample (Fig. 2c), which indicates the high thermal stability of the microspheres. However, the microstructure was indeed changed to certain extent, the density of the nanosheets of the D-CeO2 microspheres decreased, which can be attributed to the oxygen vacancy defects. The microstructures of the samples were further analyzed by transmission electron microscopy (TEM). The TEM image in Fig. 2d shows that the D-CeO2 microspheres are formed by the assembly of nanosheets. Each nanosheet is independent and remains unaggregated, thereby providing more catalytic active sites. In addition, numerous mesopores can be observed on the surface of the nanosheet (Fig. 2e). Mesoporous materials have a significantly large specific surface area and provide a large number of catalytic active sites, thereby facilitating mass transfer. Furthermore, the mesoporous structure of CeO2 is the same as that of D-CeO2, as observed from the TEM image in Fig. S3 (Supporting information). The HRTEM image (Fig. 2f) shows that the lattice fringes of D-CeO2 completely match the lattice fringes of CeO2 (d = 0.286 nm for the (200) face and d = 0.317 nm for the (111) face); this indicates the formation of phase-pure CeO2 with high crystallinity.

|
Download:
|
| Fig. 2. SEM images of (a, b) D-CeO2 and (c) CeO2. (d, e) TEM and (f) HRTEM images of D-CeO2. | |
XPS was performed to determine the surface states of the samples. Fig. 3a shows the XPS survey spectra of the samples. The XPS survey spectrum of D-CeO2 after high-temperature surface hydrogenation is the same as that of CeO2, which indicates the high thermal stability of D-CeO2. The XPS valence band is shown in Fig. 3b. The valence band (VB) edge increased from 2.1 eV to 2.32 eV after surface hydrogenation. This implies that surface hydrogenation can increase the VB maximum, thereby reducing the band gap. Oxygen vacancies play an important role in enhancing the photocatalytic performance [40]. As shown in Fig. 3c, the peaks at 531.3 and 529.6 eV in the O 1s XPS profile correspond to chemisorbed oxygen (OC) and lattice oxygen (OL), respectively. Meanwhile, the peak at 533.7 eV can be attributed to water-adsorbed oxygen (OW) of the D-CeO2 [41]. The peak areas were compared by the integral method. The OC and OL peak areas of CeO2 were 4270.212 and 11,241.593, and those of D-CeO2 were 8154.048 and 7917.999. The OW peak area of D-CeO2 was 827.363. The OC peak corresponds to the oxygen vacancy. The ration of OC peak area to all O for CeO2 (4270.212/15,511.805 = 37.986%) is less than that of D-CeO2 (8154.048/16,899.41 = 48.250%), which implies that more oxygen vacancies were generated through surface hydrogenation. In contrast, the OL peak area of D-CeO2 is smaller than that of CeO2; this is because oxygen vacancies appear inside the crystal lattice after hydrogenation and the crystallinity decreases. Fig. 3d shows the Ce 3d XPS profiles. The Ce 3d spectra consist of two series of spin-orbit lines, u and v [42]. The Ce 3d3/2 spectral line corresponds to u, including u (901.1 eV), u′ (903.7 eV), u″ (907.3 eV), and u″′ (916.7 eV), while the Ce 3d5/2 spectral line corresponds to v, including v (882.5 eV), v′ (884.8 eV), v″ (888.8 eV) and v″′ (898.2 eV). The specific assignments of these peaks are listed in Table S1 (Supporting information). The u′ and v′ peaks of Ce 3d XPS spectrum of D-CeO2 are significantly higher than those of CeO2. The two peaks can be indexed to Ce3+, which was formed due to high-temperature surface hydrogenation. This further indicates the formation of surface oxygen vacancies.

|
Download:
|
| Fig. 3. (a) XPS survey spectra, (b) XPS valence band, (c) O 1s and (d) Ce 3d XPS spectra of CeO2 and D-CeO2. | |
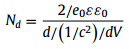
Photoelectrochemical measurements were performed to evaluate the separation efficiency of electron-hole pairs. Fig. 4a shows that the photocurrent density of D-CeO2 (approximately 12.3 µA/cm2) is approximately twice of that of CeO2 (6.5 µA/cm2). The higher photoelectrical response of D-CeO2 indicates the efficient separation of the photogenerated charge carriers. In addition, the chronoamperometry curve shows that the current density of D-CeO2 is approximately twice of that of CeO2 (Fig. 4b); this indicates the lower electron-hole recombination rate and better electron transfer ability of D-CeO2 compared with CeO2. Furthermore, the electron transfer behaviors of the samples were analyzed by electrochemical impedance spectroscopy (EIS). As shown in Fig. 4c, the resistance of D-CeO2 is less than that of CeO2 in the dark as well as under AM 1.5 G illumination, this is because oxygen vacancy defects can significantly reduce charge transfer resistance (Rct) and increase electron transport efficiency. Furthermore, the resistance of the samples under AM 1.5 G illumination was lower than that of the samples in the dark, which indicates the light-driven effect. Overall, the results indicate the efficient separation and better transfer of photogenerated carriers by D-CeO2. The CeO2 and D-CeO2 semiconductors were classified by the Mott–Schottky (M–T) diagram (Fig. 4d). The slopes of the CeO2 and D-CeO2 curves are positive, which indicate that they are n-type semiconductors [43]. The slope of D-CeO2 is smaller than that of CeO2, indicating that D-CeO2 has a higher carrier density than that of CeO2. The carrier density can be calculated by Eq. 1 [44]:
|
(1) |

|
Download:
|
| Fig. 4. Photoelectrochemical properties of CeO2 and D-CeO2. (a) Linear sweep voltammograms measured in the dark and under AM 1.5 G illumination. (b) chronoamperometry curves obtained under AM 1.5 G illumination. (c) Nyquist plots measured in the dark and under AM 1.5 G illumination. (d) Mott–Schottky plots. | |
where ε is the dielectric constant (24.5 for CeO2) [45]. The carrier densities of CeO2 and D-CeO2 were 6.54 × 10¹⁹ and 8.11 × 1019 cm−3, respectively. The high carrier density of D-CeO2 is attributed to the efficient separation of electron-hole pairs; thus, D-CeO2 is expected to show a high photocatalytic performance in the degradation of pollutants.
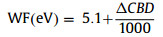
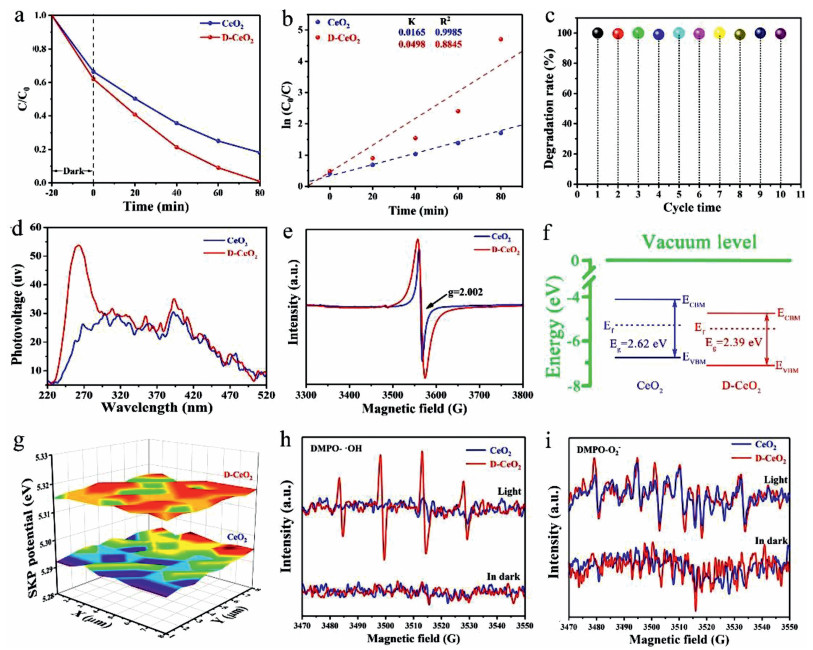
The photocatalytic performance of CeO2 and D-CeO2 was evaluated for the degradation of TC under AM 1.5 G illumination. As shown in Fig. S4 (Supporting information), the degradation rate increased with an increase in temperature. However, an excessively high temperature would destroy the fine structure of D-CeO2, thereby impeding the inner hole-electron photoexcitation progress, which will reduce the degradation rate. At a relatively low temperature, the concentration of surface oxygen vacancies is too low to provide sufficient surface-active sites for photocatalytic reactions, which results in a poor photocatalytic performance. Thus, the samples hydrogenated at 500 ℃ had the highest concentration of oxygen vacancies. As shown in Fig. 5a, under dark conditions, the adsorption capacity of D-CeO2 is much higher than that of CeO2 because of the large specific surface area of the nanosheets of D-CeO2. The rate of photocatalytic degradation of TC by D-CeO2 increased to 99.9% within 80 min, which is much higher than that of CeO2. As can be seen from Fig. S5 (Supporting information), D-CeO2 has higher degradation efficiency than that of CeO2 in literatures. The hydrogenation of D-CeO2 resulted in the generation of oxygen vacancies at an optimal concentration that was best suited for photocatalytic degradation. Moreover, the D-CeO2 has higher photo-response than that of CeO2. In addition, the mesoporous nanosheet promoted electron transmission and mass transfer. To study the effect of dark adsorption on the degradation of TC, we increased the adsorption time and found that the adsorption equilibrium could be reached within 30 min (Fig. S6 in Supporting information). Fig. 5b shows the ln(C0/C) versus time plots for CeO2 and D-CeO2. The linear plots indicate that the photocatalytic decomposition of TC followed quasi-first-order kinetics under the above-mentioned conditions. Further, the photocatalytic degradation rate constant (k) of D-CeO2 (0.0498 min−1) was 3 times that of CeO2 (0.0165 min−1). The cyclic stability of D-CeO2 was determined under the above-mentioned test conditions. After 10 cycles, the photocatalytic degradation efficiency of D-CeO2 was more than 99% (Fig. 5c) with negligible attenuation, which demonstrates the excellent stability of D-CeO2. The stability of D-CeO2 was further confirmed by the XRD analysis of D-CeO2 after 10 degradation cycles. The XRD patterns of D-CeO2 before and after 10 degradation cycles were almost the same, which confirm its high stability (Fig. S7 in Supporting information). In addition, the SEM of the sample after 10 cycles was also tested. As shown in Fig. S8 (Supporting information), the sample basically kept its original appearance without any change, which further confirmed the high stability of the sample. The high stability of D-CeO2 can be attributed to the mesoporous nanosheets that remained separate and unaggregated, which led to each nanosheet working independently and efficiently. The separation of photogenerated electron-hole pairs was analyzed by surface photovoltage spectroscopy (SPS). As shown in Fig. 5d, an intense peak at approximately 260 nm can be seen and is ascribed to the electron transfer from the valence band to the conduction band, which is consistent with the UV–vis diffuse reflectance data. Moreover, the SPS peak intensity of D-CeO2 was much stronger than that of CeO2 because of its higher photogenerated charge carrier separation efficiency and longer excitation lifetime than those of CeO2. The defect centers generated during nanosheet hydrogenation were measured by electron paramagnetic resonance (EPR) spectroscopy. The results showed that both CeO2 and D-CeO2 had paramagnetic defect centers. The presence of oxygen vacancy defects [46] can be observed at g = 2.002 in the EPR profile (Fig. 5e). Moreover, the intensity of the resonance peak of D-CeO2 was significantly higher than the intensity of the resonance peak of CeO2; this indicates that the oxygen vacancy defects considerably increased after the surface hydrogenation treatment. The corresponding band gap alignments of CeO2 and D-CeO2 are shown in Fig. 5f. According to XPS valence band, the VB of CeO2 and D-CeO2 were −6.799 and −7.019 eV, respectively. The position shift of the VB can be attributed to the formation of surface oxygen vacancy defects. Based on the UV–vis spectra and M–T plots, the CB can be calculated as −4.179 and −4.629 eV, respectively. It is clear that the Fermi level of D-CeO2 is closer to the bottom of the conduction band, which indicates that D-CeO2 is of more n-type. SKP microscopy can show the relatively flat potential changes based on the work function (WF) by identifying small-molecule interactions by oscillating electromagnetic and acoustic fields. The SKP potential profiles of CeO2 and D-CeO2 are shown in Fig. 5g. From the test results, the WFs of CeO2 and D-CeO2 were calculated as approximately 5.293 and 5.316 eV, respectively, by Eq. 2:
|
(2) |

|
Download:
|
| Fig. 5. (a) TC photocatalytic degradation curves and (b) ln(C0/C) curves of CeO2 and D-CeO2. (c) Recycling of D-CeO2 for photocatalytic degradation of TC under AM 1.5 G illumination. (d) SPS profiles, (e) EPR spectra, (f) electronic band structures and DMPO spin-trapping ESR spectra for (g) ·OH and (h) ·O2− of CeO2 and D-CeO2, respectively. | |
The excited state electrons easily transfer from the bulk to the surface of CeO2, which is conducive for redox reactions. It can also be concluded that the photogenerated electrons of D-CeO2 can more easily escape than those of CeO2 since D-CeO2 more effectively separates the electron-hole pairs. Thus, the possibility of recombination of electron-hole pairs decreases, which significantly enhances the photocatalytic performance. The DMPO-ESR spin trap technique was used to identify the main active radicals in the reaction. The hydroxyl radical (·OH) is an extremely important oxidative active radical that plays a crucial role in the process of photocatalytic degradation. As shown in Fig. 5h, the DMPO-·OH response signals of CeO2 and D-CeO2 could not be detected in the dark, whereas under illumination, D-CeO2 produced more hydroxyl radicals than CeO2, which is beneficial for photocatalysis. The DMPO-·O2− response signal of the sample is shown in Fig. 5i. No ·O2− signal was detected under dark conditions, which implies that ·O2− was not produced. However, under illumination, the ·O2− signal strength of D-CeO2 was much higher than that of CeO2; this indicates that D-CeO2 produced more superoxide anion radicals than CeO2, which is beneficial for photocatalysis.
Based on the experimental results, the solar-driven photocatalytic mechanism as well as the charge transfer and separation mechanisms is shown in Scheme 2. Compared with traditional CeO2 materials, the two-dimensional structure has the advantages of a large specific surface area, adequate exposed active sites, and short migration distance of the photogenerated carriers. In addition, the mesoporous structure increases the specific surface area, thereby providing a large number of effective surface-active sites and facilitating mass transfer. Importantly, each mesoporous nanosheet of the assembled microsphere works independently and remains unaggregated, which greatly improves the photocatalytic activity. In addition, the engineered surface defects improve charge separation and extend absorption to the visible-light region because of the generation of a large number of oxygen vacancies, which eventually improves the photocatalytic performance. Under AM 1.5 G illumination, the photogenerated electrons in D-CeO2 excited from the VB to the CB, which promoted the separation of photogenerated electron-hole pairs. Then, the holes oxidized OH− to ·OH, and the electrons combined with the oxygen adsorbed on the catalyst surface to form ·O2− [47]. Eventually, TC was photocatalytic degraded into CO2 and H2O [48]. Because of the presence of engineered surface oxygen vacancy defects, the mesoporous CeO2 nanosheet-assembled microspheres had sufficient surface active sites, which facilitated the separation of electron-hole pairs. This improved the separation efficiency and significantly enhanced the photocatalytic performance.

|
Download:
|
| Scheme 2. Schematic illustration of photo-induced charge transfer and separation mechanism of defective mesoporous CeO2 nanosheet-assembled microspheres. | |
In summary, we prepared mesoporous CeO2 nanosheet-assembled microspheres with engineered surface oxygen defects via polymer precipitation, hydrothermal synthesis, and surface hydrogenation. The resultant D-CeO2 had a large surface area of 102.3 m2/g and high thermal stability. The band gap of D-CeO2 decreased from 2.62 eV to 2.39 eV after surface hydrogenation, which extended the absorption to the visible-light region. Under AM 1.5 G illumination, the rate of photocatalytic degradation of TC by D-CeO2 was 99.99%, which was approximately three times of that of CeO2. This was attributed to the unique mesoporous assembly structure of D-CeO2 and the large number of surface oxygen vacancy defects. The mesoporous two-dimensional structure provided a large number of active sites owing to a large specific surface area, and a short migration distance, thus facilitating efficient mass transfer. Moreover, the assembly structure significantly improved the photocatalytic activity since each mesoporous nanosheet worked independently and remained unaggregated. The generation of oxygen vacancy defects decreased the energy band gap and promoted the separation of the photogenerated electron-hole pairs, which resulted in an enhanced photocatalytic degradation performance. The synthetic method described herein is an effective method for preparing oxygen vacancy defects on engineered surfaces and paves the way for the synthesis of other highly efficient semiconductor oxide photocatalysts.
Declaration of competing interestThe authors declare no competing financial interests.
AcknowledgmentsWe gratefully acknowledge the support of this research by the National Natural Science Foundation of China (No. 21871078), the Natural Science Foundation of Heilongjiang Province (Nos. JQ2019B001, LH2019B014), and the Youth Science and Technology Innovation Team Project of Heilongjiang Province (No. 2018-KYYWF-1593).
Supplementary materialsSupplementary material associated with this article can be found, in the online version, at doi:10.1016/j.cclet.2021.06.035.
| [1] |
B. Li, C. Lai, G. Zeng, et al., Small 15 (2019) 1804565. DOI:10.1002/smll.201804565 |
| [2] |
L. Jiang, Y. Xie, F. He, et al., Chin. Chem. Lett. 32 (2021) 2187-2191. DOI:10.1016/j.cclet.2020.12.010 |
| [3] |
L. Zhou, S. Dai, S. Xu, et al., Appl. Catal. B: Environ. 291 (2021) 120019. DOI:10.1016/j.apcatb.2021.120019 |
| [4] |
R. Hassandoost, S. Pouran, A. Khataee, Y. Orooji, S. Joo, J. Hazard. Mater. 376 (2019) 200-211. DOI:10.1016/j.jhazmat.2019.05.035 |
| [5] |
G. Jiang, K. Geng, Y. Wu, Y. Han, X. Shen, Appl. Catal. B: Environ. 227 (2018) 366-375. DOI:10.1016/j.apcatb.2018.01.034 |
| [6] |
S. Reardon, Nature 509 (2014) 141-143. DOI:10.1038/509141a |
| [7] |
H. Yin, G. Li, X. Chen, et al., Appl. Catal. B: Environ. 269 (2020) 118829. DOI:10.1016/j.apcatb.2020.118829 |
| [8] |
Y. Zhang, J. Zhou, J. Chen, X. Feng, W. Cai, J. Hazard. Mater. 392 (2020) 122315. DOI:10.1016/j.jhazmat.2020.122315 |
| [9] |
M. Humayun, Z. Hu, A. Khan, et al., J. Hazard. Mater. 364 (2019) 635-644. DOI:10.1016/j.jhazmat.2018.10.088 |
| [10] |
X. Xiang, L. Wu, J. Zhu, et al., Chin. Chem. Lett. 32 (2021) 3215-3220. DOI:10.1016/j.cclet.2021.03.064 |
| [11] |
H. Chen, H. Mulmudi, A. Tricoli, Chin. Chem. Lett. 31 (2020) 601-604. DOI:10.1016/j.cclet.2019.05.016 |
| [12] |
W. Wang, W. Zhao, H. Zhang, X. Dou, H. Shi, Chin. J. Catal. 42 (2021) 97-106. DOI:10.1016/S1872-2067(20)63602-6 |
| [13] |
F. Yu, L. Wang, Q. Xing, et al., Chin. Chem. Lett. 31 (2020) 1648-1653. DOI:10.1016/j.cclet.2019.08.020 |
| [14] |
S. Wang, B. Guan, X. Lou, J. Am. Chem. Soc. 140 (2018) 5037-5040. DOI:10.1021/jacs.8b02200 |
| [15] |
A. Kudo, K. Omori, H. Kato, J. Am. Chem. Soc. 121 (1999) 11459-11467. DOI:10.1021/ja992541y |
| [16] |
Y. Bi, S. Ouyang, N. Umezawa, J. Cao, J. Ye, J. Am. Chem. Soc. 133 (2011) 6490-6492. DOI:10.1021/ja2002132 |
| [17] |
K. Qi, W. Lv, I. Khan, S. Liu, Chin. J. Catal. 41 (2020) 114-121. DOI:10.1016/S1872-2067(19)63459-5 |
| [18] |
F. Pan, X. Xiang, Z. Du, et al., Appl. Catal. B: Environ. 260 (2020) 118189. DOI:10.1016/j.apcatb.2019.118189 |
| [19] |
H. Lin, X. Tang, J. Wang, et al., J. Hazard. Mater. 405 (2021) 124204. DOI:10.1016/j.jhazmat.2020.124204 |
| [20] |
K. Ye, Y. Li, H. Yang, et al., Appl. Catal. B: Environ. 259 (2019) 118085. DOI:10.1016/j.apcatb.2019.118085 |
| [21] |
X. Wen, C. Zhang, C. Niu, et al., Catal. Commun. 90 (2017) 51-55. DOI:10.1016/j.catcom.2016.11.018 |
| [22] |
J. Di, J. Xia, M. Chisholm, et al., Adv. Mater. 31 (2019) 1807576. DOI:10.1002/adma.201807576 |
| [23] |
L. Wang, Y. Zhang, L. Chen, H. Xu, Y. Xiong, Adv. Mater. 30 (2018) 1801955. DOI:10.1002/adma.201801955 |
| [24] |
J. Yu, Y. Wang, C. Shen, X. Xu, J. Catal. 377 (2019) 409-418. DOI:10.3390/agronomy9080409 |
| [25] |
W. Li, C. Zhuang, Y. Li, et al., Ceram. Int. 47 (2021) 21769-21776. DOI:10.1016/j.ceramint.2021.04.192 |
| [26] |
Q. Xie, P. Liu, D. Zeng, et al., Adv. Funct. Mater. 19 (2018) 1707433. DOI:10.1002/adfm.201707433 |
| [27] |
X. Zhang, W. Hu, K. Zhang, et al., ACS Sustain. Chem. Eng. 5 (2017) 6894-6901. DOI:10.1021/acssuschemeng.7b01114 |
| [28] |
Y. Goto, K. Yamanaka, M. Ohashi, Y. Maegawa, S. Inagaki, Appl. Catal. B: Environ. 287 (2021) 119965. DOI:10.1016/j.apcatb.2021.119965 |
| [29] |
T. Dörr, L. Deilmann, G. Haselmann, et al., Adv. Energy Mater. 8 (2018) 1802566. DOI:10.1002/aenm.201802566 |
| [30] |
M. Benzigar, S. Talapaneni, S. Joseph, et al., Chem. Soc. Rev. 47 (2018) 2680-2721. DOI:10.1039/C7CS00787F |
| [31] |
V. Sridhar, B. Park, M. Sitti, Adv. Funct. Mater. 28 (2018) 1704902. DOI:10.1002/adfm.201704902 |
| [32] |
W. Zhou, W. Li, J. Wang, et al., J. Am. Chem. Soc. 136 (2014) 9280-9283. DOI:10.1021/ja504802q |
| [33] |
X. Chen, L. Liu, P. Yu, S. Mao, Science 311 (2011) 746-750. DOI:10.1126/science.1200448 |
| [34] |
J. Xiong, J. Di, J. Xia, W. Zhu, H. Li, Adv. Funct. Mater. 28 (2018) 1801983. DOI:10.1002/adfm.201801983 |
| [35] |
J. Wan, W. Chen, C. Jia, et al., Adv. Mater. 30 (2018) 1705369. DOI:10.1002/adma.201705369 |
| [36] |
H. He, D. Huang, W. Pang, et al., Adv. Mater. 30 (2018) 1801013. DOI:10.1002/adma.201801013 |
| [37] |
Z. Feng, M. Zhang, Q. Ren, et al., Chem. Eng. J. 369 (2019) 18-25. DOI:10.1016/j.cej.2019.03.051 |
| [38] |
W. Zhou, F. Sun, K. Pan, et al., Adv. Funct. Mater. 21 (2011) 1922-1930. DOI:10.1002/adfm.201002535 |
| [39] |
Y. Hu, Angew. Chem. Int. Ed. 51 (2012) 12410-12412. DOI:10.1002/anie.201206375 |
| [40] |
Z. Wei, W. Wang, W. Li, et al., Angew. Chem. Int. Ed. 60 (2021) 8236-8242. DOI:10.1002/anie.202016170 |
| [41] |
A. Wang, Z. Zheng, H. Wang, et al., Appl. Catal. B: Environ. 277 (2020) 119171. DOI:10.1016/j.apcatb.2020.119171 |
| [42] |
M. Lykaki, E. Pachatouridou, S. Carabineiro, et al., Appl. Catal. B: Environ. 230 (2018) 18-28. DOI:10.1016/j.apcatb.2018.02.035 |
| [43] |
L. Kronik, Y. Shapira, Surf. Sci. Rep. 37 (1999) 1-206. DOI:10.1016/S0167-5729(99)00002-3 |
| [44] |
C. Mao, F. Zuo, Y. Hou, X. Bu, P. Feng, Angew. Chem. Int. Ed. 53 (2014) 10485-10489. DOI:10.1002/anie.201406017 |
| [45] |
Y. Huang, S. Wu, C. Hsiao, A. Lee, M. Huang, Chem. Mater. 32 (2020) 2631-2638. DOI:10.1021/acs.chemmater.0c00318 |
| [46] |
N. Zhang, X. Li, H. Ye, et al., J. Am. Chem. Soc. 138 (2016) 8928-8935. DOI:10.1021/jacs.6b04629 |
| [47] |
C. Huang, Y. Wen, J. Ma, et al., Nat. Commun. (2021). DOI:10.1038/s41467-020-20521-5 |
| [48] |
Y. Liang, W. Xu, J. Fang, et al., Appl. Catal. B: Environ. 295 (2021) 120279. DOI:10.1016/j.apcatb.2021.120279 |