 2022, Vol. 33


b Department of Civil and Environmental Engineering, Temple University, Philadelphia, PA 19122, United States
Metformin (MET) is an oral hypoglycemic biguanide with imine and guanidine groups [1-4]. Specifically, MET can reduce the absorption of glucose and accelerate the transport of glucose into cells. It can also reduce the concentration of free fatty acids in plasma and inhibit gluconeogenesis. In addition, some researchers have shown that MET has anticancer and antiaging effects. In the process of metabolism in the body, about 70% of MET remains unchanged, and finally it enters the urine through the kidneys [5]. The effect of MET is closely related to its dosage. More than 3000 mg of MET in the blood per day can cause life-threatening lactic acidosis, liver disease, kidney problems and gastrointestinal infections [6]. Therefore, the determination of metformin in the blood is very important in the clinical diagnosis and medical management of the above-mentioned diseases.
Several analytical methods for the determination of MET have been reported in the literature, mainly including ultra-high performance liquid chromatography-ultraviolet detection [7, 8], liquid chromatography-tandem mass spectrometry [9, 10], high performance thin layer chromatography [11], capillary electrophoresis [12] and electrochemical analysis [13]. However, some of the limitations of these analytical methods, such as expensive instruments, complicated pre-processing steps and long analysis time, limit their use in professional laboratories. Therefore, it is becoming more and more urgent to develop a simple, fast and sensitive analytical method for the determination of MET.
Many host-guest functionalized interfaces, including metal surfaces [14, 15], inorganic substrates [16], and biological and solid nanochannels [17-19] have been comprehensively presented as effective discrimination and detection platforms. Gold nanoparticles (AuNPs) have clear morphology, composition and unique physical and chemical properties, and have shown their broad application prospects in catalysis, sensing and biomedicine [20-23]. Due to the surface plasmon resonance (SPR) effect, large interactions between the surfaces of nanoparticles can easily lead to agglomeration, resulting in redshift and color changes [24-26]. Functional nanostructures of AuNPs will be ideal candidates for reducing non-specific agglomeration and improving selectivity.
Cucurbituril (CB[n]) can be easily combined with the electron-deficient groups of the alkyl chain and cationic amine groups to achieve selective molecular recognition [27-32]. In most cases, chemical adsorption as one of the main immobilization methods has been used to aggregate macrocyclic compounds and nanoparticles or metal surfaces. The carbonyl epoxy atoms of CB[6] and CB[7] can interact with AuNPs [33] to form a stable nanocomposite, which has the advantages of simple preparation and convenient use. We have prepared a new type of highly sensitive drug probe for the detection of MET based on CB[6], CB[7] and AuNPs.
In this article, we first synthesized CB[6] or CB[7] functinalized AuNPs as sensing probe. The molecular recognition behavior between CB[6], CB[7] and MET has been preliminarily deliberate, and then CB[6] is used as the recognition receptor for MET. According to the molecular recognition of host and guest, MET can be accurately combined with CB[6]. It then promotes the aggregation of the nanoparticles, which leads to changes in color and UV–vis absorption spectrum. With these changes, MET can be detecting by the UV–vis spectral analysis (Scheme 1). Alternatively, macrocyclic receptor functionalized GE have been used to detect various biomolecules [34-36]. Here, based on the interaction between CB[6] and the gold surface, GE-CB[6] was used to detect MET. Under optimized experimental conditions, it was found that in the solution of AuNPs/CB[6], MET can cause the aggregation of AuNPs/CB[6] and trigger the change of color and UV–vis absorption spectrum. When the concentration of MET is in the range of 6–120 µmol/L, the change in absorption intensity has a good linear relationship with the corresponding concentration, and the detection limit is 2.0 µmol/L. And electrochemical impedance spectroscopy experiment (EIS) shows that the logarithm of the MET concentration has a good linear relationship with charge transfer resistance (Rct) in the concentration range from 10 pmol/L to 20 nmol/L, and the detection limit of this method is 1.35 pmol/L. Relying on molecular recognition mechanisms, these assay methods deliver a encouraging tool for highly specific drug determination in different concentration ranges.

|
Download:
|
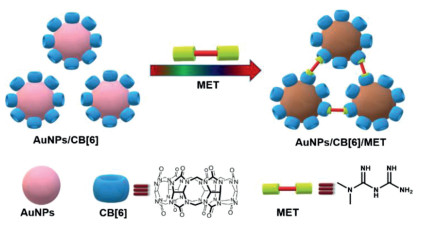
| Scheme 1. The sensing process for metformin (MET)-mediated aggregation of CB[6]-modified AuNPs. | |
The molecular recognition behavior and related mechanisms of CB[n] (n = 6, 7) and MET were analyzed and discussed by 1H NMR and UV–vis spectroscopy. The 1H NMR spectrum of CB[6] and MET is shown in Fig. 1A. It can be seen that as the equivalent of CB[6] increases, the two methyl proton hydrogens on MET move to a high field. When adding more than 1.0 equiv. of CB[6], the proton hydrogen on the methyl group has no obvious chemical shift change, and it appears as a fast exchange in the nuclear magnetic time scale. It can be seen from the results of nuclear magnetic integration that the binding ratio of CB[6] and MET is 1:1. The MET used is non-protonated, MET aqueous solution (4.0 mmol/L) is weakly alkaline (pH 7.5) and the pKa value is 12.4 at room temperature. But when 1.0 equiv. of CB[6] was added, the pH of the mixed solution increased to 10.3, which was due to the increase in the content of protonated MET formed by hydrolysis, that is, the cationic dipole interaction between MET and CB[6] promotes them to form stable complexes. Because of the small structure of MET, it only forms external interactions with carbonyl groups. Therefore, there is an enhanced conjugation effect (including hydrogen bond) between the guanidine group and CB[6], which makes the proton peak of CB[6] also shift to the high field. On the other hand, the molar ratio method based on UV–vis spectroscopy was used to determine the binding ratio between CB[6] and MET. As shown in Fig. 1B, after adding CB[6] to the MET solution, the UV–vis absorption peak of MET at 232 nm disappeared immediately, this is because the interaction between CB[6] and MET weakens the characteristics of MET absorption. As the concentration of CB[6] increases, the absorbance at 232 nm gradually decreases. When the absorbance is almost constant, it indicates that CB[6] forms clathrates with almost all MET molecules. As NCB[6]/NMET increases, A232 gradually decreases. There is an obvious inflection point at the tangent of the curve, and the corresponding NCB[6]/NMET value is 1, which confirms that the combination ratio of CB[6] and MET is 1:1. Similarly, the recognition behavior of MET and CB[7] is also analyzed in the same way. As shown in Figs. S1a and b (Supporting information), due to the size effect, the complexing ability of CB[7] and MET is lower than CB[6]. Unlike protonated MET [37], non-protonated MET "adheres" to the outside of the carbonyl port (electrostatic interaction). It can be found from the UV–vis that the cavity of CB[7] cannot completely shield the conjugated groups of MET, so the binding ratio of CB[7] and MET is 2:1 finally. The difference with CB[6] is that in the 2:1 binding mode, the guanidine group of MET cannot form a conjugation phenomenon with CB[7], so the proton peak of CB[7] on the 1H NMR spectrum does not change.

|
Download:
|
| Fig. 1. (A) 1H NMR titration spectrum of MET (4.0 mmol/L) and different content of CB[6] (a 0, b 0.25, c 0.5, d 0.75, e 1.0, f 1.5, g 2.0 equiv.); (B) UV–vis spectra of MET (70 µmol/L) and CB[6] (0-4.29 equiv.). Inset: The relationship between absorption intensity at 232 nm and NCB[6]/NMET. | |
By improving the method of our group [33], stable and monodisperse CB[n] (n = 6, 7)-modified AuNPs (AuNPs/CB[n]) were prepared and used for the detection of MET (Supporting information for details). The morphology and size of the two AuNPs/CB[n]s were characterized by transmission electron microscopy (TEM) and UV–vis. Fig. S2 (Supporting information) shows the TEM images and particle size distribution histograms of the two types of nanoparticles (AuNPs/CB[6] & AuNPs/CB[7]). The shape of the nanoparticles is spherical and the size is relatively uniform. The statistical results of the particle size show that the average particle size is 10.6 ± 1.6 nm and 16.2 ± 2.3 nm, respectively. Fig. S3 (Supporting information) shows the UV–vis spectrum of AuNPs/CB[6] and AuNPs/CB[7] with maximum absorption peaks at 552 nm.
Regarding the characteristics of MET and the ability of CB[6] to recognize host and guest molecules, CB[6] can selectively encapsulate the guanidine group of MET in its hydrophobic cavity. As shown in Scheme 1, when MET is added to the AuNPs/CB[6] solution, the guanidine group of MET is incorporated into the cavity, resulting in the aggregation of AuNPs/CB[6] solution.
In order to exclude non-specific interference, the aggregation of AuNP induced by MET was also studied. When different concentrations of MET were added to the AuNPs solution, no changes in color and spectrum absorption were found, indicating that MET could not trigger the aggregation of AuNPs (Fig. S4 in Supporting information). To determine the optimal analysis conditions for the detection system, the incubation time of MET and nanoparticle complexes were optimized in the experiment. The results are shown in Fig. S5 (Supporting information). Under the action of 250 µmol/L MET, within 30 min, as the reaction time increases, the absorbance A552 value gradually decreases, and the change of absorption peak at 552 nm (△A552) gradually increases, which indicates that as the reaction time increases, MET continuously binds to the CB[n]s molecules on the surface of AuNPs. After 30 min, the △A552 value does not change, indicating that at the combination of MET and CB[n]s in the solution is almost complete, so 30 min was chosen as the incubation time for subsequent experiments.
As shown in Fig. 2A, the color of the AuNPs/CB[6] solution gradually changed from light red to charcoal gray, and the absorbance at about 552 nm decreased. At the same time, the absorption intensity increases in the wavelength range close to infrared. Then, MET can be perfectly detected by measuring the △A552 of AuNPs/CB[6]. Under the optimal conditions, MET solutions of different concentrations in the range of 6–700 µmol/L were added to the AuNPs/CB[6] solution. As the concentration of MET increases, the color of the solution gradually changes from light red to charcoal gray. Under the action of MET (500 µmol/L), AuNPs/CB[6] has obvious aggregation (Fig. S6 in Supporting information). The naked eye can easily distinguish the presence of MET. Then use △A552 to quantify MET, as shown in Fig. 2B, a good linear relationship was found between △A552 and the concentration of MET over the range of 6–120 µmol/L (△A552 = 0.0008C + 0.0274, R2 = 0.9890) and from 120 µmol/L to 700 µmol/L (△A552 = 0.00015C + 0.1030, R2 = 0.9903). The limit of detection (LOD) was calculated to be 2.0 µmol/L (LOD = 3 × standard deviation/slope).

|
Download:
|
| Fig. 2. (A) UV–vis spectra of the CB[6]-modified AuNPs with the addition of MET at different concentrations; (B) Linear relationship curve between △A552 and the concentrations of MET. | |
The excellent biocompatibility of CB[7] makes it widely used in the field of sensing. CB[7] can form a 2:1 inclusion compound with MET, which is a more promising molecular probe than CB[6]. Similarly, under the optimal conditions, AuNPs/CB[7] was also used to detect MET. As shown in Fig. S7 (Supporting information), when MET was added to the AuNPs/CB[7] solution, the complex did not aggregate as expected, and with the continuous addition of MET, the absorbance at 552 nm is unchanged. This may be due to the different binding ability of MET with CB[6] and CB[7]. The repulsive force between nanoparticles will gradually increase when the MET were specifically identified with CB[n]s on the surface of AuNPs. The binding force of CB[7] and MET on the surface of AuNPs is less than the repulsive force between nanoparticles, so there is no specific aggregation phenomenon.
To confirm this assumption, isothermal titration calorimetric (ITC) measurement experiments were performed between MET and AuNPs/CB[n]s. As shown in Fig. S8 (Supporting information), the primary binding constant K of CB[6], CB[7] and the nanoparticle complexes are evaluated to be 1.761 × 10⁶ L/mol and 4.307 × 10³ L/mol, respectively. It can be seen that the titration system of AuNPs/CB[7] has never reached the equilibrium state of heat exchange. This can prove that the specific recognition of MET and CB[7] on the surface of AuNPs is affected by the repulsion between the nanoparticles, that is to say, AuNPs/CB[7] cannot be used for accurate detection of MET for the time being.
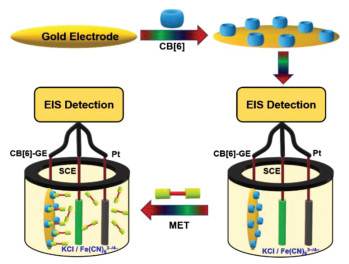
Based on these phenomena, the results can be easily read by naked eye observation and UV–vis spectrum analysis. However, for lower concentrations of target molecules, highly sensitive electrochemical sensors are needed to detect them. Compared with other biosensors, EIS uses a lower overvoltage to get rid of detection limitations. Here, we define an impedance sensor based on the active electrode of CB[6] interacting with the gold surface [38-40] to detect MET (Scheme 2).

|
Download:
|
| Scheme 2. Structure of eletrochemical system and detection process of MET via electrochemical impedance based on host–guest interaction. | |
First, compare the Nyquist diagrams of CB[6] modified GE (GE-CB[6] with bare GE), as shown in Fig. S9 (Supporting information) in the electrolyte, the Rct (green curve) of the exposed GE is about 190 Ω. While CB[6] was modified, the Rct in the modified electrode system was significantly reduced to 72 Ω. This shows that CB[6] has a certain degree of conductivity on GE and also shows that CB[6] has been successfully modified on GE. The final modified electrode has low impedance, which promotes the electron transfer between the electrode and the electrolyte. In order to obtain more accurate detection results, the molecular recognition time in the system was optimized. MET (10 nmol/L) was added to the electrolyte solution, as time increases, the content of molecules on the electrode surface increases, and the Nyquist plots shows that the diameter of the semicircle becomes larger, that is, the impedance value becomes larger (Fig. S10 in Supporting information). At about 30 min, the diameter of the semicircle did not change, indicating that the host and guest recognition on the electrode surface was close to the equilibrium state. This time can ensure that the cucurbitacin can completely capture the molecule to be tested, so this stabilization time is selected for future test systems.
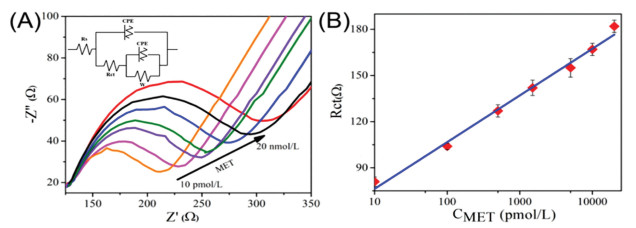
The calculation is made using the equivalent circuit shown in Fig. 3A (inset). The model linearly diffuses the surface of the electrode using the Warburg impedance (W) and Rct. The significant change in the impedance values reflects a change in the surface state of the electrode. The larger the diameter of the semicircle, the greater the impedance value and the electron transfer resistance. As the concentration of MET increases, the impedance increases. Fig. 3B shows a good linear relationship between the logarithm of MET concentrations and Rct over the range from 10 pmol/L to 20 nmol/L (Rct = 30.118 lgCMET + 47.039, R2 = 0.9910), the detection limit is 1.8 pmol/L. Compared with the spectrophotometry method, the detection limit is greatly lower and the accuracy is higher. Since the GE structure has a fixed number of CB[6] binding sites, the electrochemical system has the advantages of low detection limit and high accuracy at the picomolar concentration level.

|
Download:
|
| Fig. 3. (A) Nyquist plots for GE-CB[6] with the addition of MET at different concentrations; (B) Linear relationship curve between Rct and the logarithmic concentrations of MET. | |
In conclusion, we have demonstrated two simple and sensitive methods for detecting MET. Use CB[6] to modify the surface of AuNPs to obtain recognition performance and SPR effect at the same time. It was perceived that as the concentration of MET increased, the nanoparticles gradually aggregated, with sensitive detection ability at the micromolar concentration level (detection limit = 2.0 µmol/L). An electrochemical impedance system for detecting MET was constructed on the GE modified by CB[6]. Rct accurately displays the state change of the electrode surface. The system has a more accurate and sensitive detection capability at the picomolar concentration level (detection limit = 1.35 pmol/L).
Declaration of competing interestThe authors declare that they have no known competing financial interests or personal relationships that could have appeared to influence the work reported in this paper.
AcknowledgmentsThis work was financially supported by the National Natural Science Foundation of China (No. 21807083), the Program for Innovative Teams of Outstanding Young and Middleaged Researchers in the Higher Education Institutions of Hubei Province (No. T201702).
Supplementary materialsSupplementary material associated with this article can be found, in the online version, at doi:10.1016/j.cclet.2021.06.044.
| [1] |
L. Gong, S. Goswami, K.M. Giacomini, et al., Pharmacogenet. Genom. 22 (2012) 820-827. DOI:10.1097/FPC.0b013e3283559b22 |
| [2] |
L. Tran, A. Zielinski, A.H. Roach, et al., Ann. Pharmacother. 49 (2015) 540-556. DOI:10.1177/1060028014558289 |
| [3] |
A. Golay, Int. J. Obes. 1 (2008) 61-72. DOI:10.1038/sj.ijo.0803695 |
| [4] |
R. Mathur, C.J. Alexander, J. Yano, et al., Am. J. Obstet. Gynecol. 199 (2008) 596-609. DOI:10.1016/j.ajog.2008.09.010 |
| [5] |
A.M. Dissanayake, M.C. Wheldon, C.J. Hood, Pharmacol. Res. Perspect. 6 (2018) 424. |
| [6] |
X. Zhang, W.S. Harmsen, T.A. Mettler, et al., Hepatology 60 (2014) 2008-2016. DOI:10.1002/hep.27199 |
| [7] |
B.M. Ayoub, RSC. Adv. 5 (2015) 95703-95709. DOI:10.1039/C5RA17231D |
| [8] |
Y.J. Kang, H.C. Jeong, T.E. Kim, K.H. Shin, Molecules 25 (2020) 4625. DOI:10.3390/molecules25204625 |
| [9] |
B.M. Ayoub, S. Mowaka, J. Chromatogr. Sci. 55 (2017) 742-747. DOI:10.1093/chromsci/bmx030 |
| [10] |
A.M. Strugaru, J. Kazakova, E. Butnaru, et al., J. Pharm. Biomed. Anal. 165 (2019) 276-283. DOI:10.1016/j.jpba.2018.12.004 |
| [11] |
H. Mahgoub, R.M. Youssef, M.A. Korany, et al., Drug Dev. Ind. Pharm. 40 (2014) 1190-1198. DOI:10.3109/03639045.2013.810634 |
| [12] |
Z. Song, F. Chen, J. Tian, et al., J. Chromatogr. B 708 (1998) 277-283. DOI:10.1016/S0378-4347(97)00635-X |
| [13] |
R. Mirzajani, S. Karimi, Sensor. Actuat. B: Chem. 270 (2018) 405-416. DOI:10.1016/j.snb.2018.05.032 |
| [14] |
H. Zhang, J. Rui, Y. Yang, et al., Dyes Pigm. 162 (2019) 512-516. DOI:10.1016/j.dyepig.2018.10.061 |
| [15] |
X. Wang, J.R. Wu, Y. Yang, et al., Org. Lett. 21 (2019) 5215-5218. DOI:10.1021/acs.orglett.9b01827 |
| [16] |
S. Yu, N. Gilbert, H. Li, et al., Langmuir 36 (2020) 1950-1955. DOI:10.1021/acs.langmuir.9b03961 |
| [17] |
R.H. Li, J. Ma, H. Li, et al., Chin. Chem. Lett. 31 (2020) 3095-3101. DOI:10.1016/j.cclet.2020.06.041 |
| [18] |
S. Zhang, I. Boussouar, H. Li, et al., Chin. Chem. Lett. 32 (2021) 642-648. DOI:10.1016/j.cclet.2020.06.035 |
| [19] |
S. Yu, Y. Wang, H. Li, et al., Chin. Chem. Lett. 32 (2021) 179-183. DOI:10.1016/j.cclet.2020.11.055 |
| [20] |
B.A. Makwana, S. Darjee, V.K. Jain, et al., Sensor. Actuat. B: Chem. 246 (2017) 686-695. DOI:10.1016/j.snb.2017.02.054 |
| [21] |
T. Ma, W. Yang, S. Liu, et al., Catalysts 7 (2017) 38. DOI:10.3390/catal7020038 |
| [22] |
D. Wen, W. Liu, A.K. Herrmann, et al., Small 12 (2016) 2439-2442. DOI:10.1002/smll.201503874 |
| [23] |
P. Xu, P. Ning, J. Wang, et al., J. Mater. Chem. B 7 (2019) 6934-6944. DOI:10.1039/c9tb01956a |
| [24] |
T. Sannomiya, T.E. Balmer, C. Hafner, et al., Rev. Sci. Instrum. 81 (2010) 053102. DOI:10.1063/1.3405912 |
| [25] |
H. Yuan, Y. Hou, I.M. Reesh, et al., Mater. Horiz. 3 (2016) 382-401. DOI:10.1039/C6MH00093B |
| [26] |
L. Zhang, C. Xu, C. Liu, Anal. Chim. Acta 809 (2014) 123-127. DOI:10.1016/j.aca.2013.11.043 |
| [27] |
M. Pozo, E. Casero, C. Quintana, Microchim. Acta 184 (2017) 2107-2114. DOI:10.1007/s00604-017-2226-z |
| [28] |
S.J. Barrow, S. Kasera, M.J. Rowland, et al., Chem. Rev. 115 (2015) 12320-12406. DOI:10.1021/acs.chemrev.5b00341 |
| [29] |
L.L. Tan, M. Wei, L. Shang, Y.W. Yang, Adv. Funct. Mater. 30 (2020) 2007277. |
| [30] |
J. Zhou, S. Hou, J. Zhang, et al., Chin. Chem. Lett. 32 (2021) 725-728. DOI:10.1016/j.cclet.2020.07.039 |
| [31] |
Y. Luo, W. Zhang, M. Liu, et al., Chin. Chem. Lett. 32 (2021) 367-370. DOI:10.1016/j.cclet.2020.02.023 |
| [32] |
H. Xu, Q. Wang, Chin. Chem. Lett. 30 (2019) 337-339. DOI:10.1016/j.cclet.2018.03.014 |
| [33] |
L. Zhang, S. Liu, Y. Wang, et al., Nanomaterials 8 (2018) 1015. DOI:10.3390/nano8121015 |
| [34] |
H. Li, X. Hu, J. Zhao, et al., Electrochem. Commun. 100 (2019) 126-133. DOI:10.3390/rs11020126 |
| [35] |
S. Song, X. Shang, J. Zhao, et al., Sens. Actuat. B: Chem. 267 (2018) 357-365. DOI:10.1016/j.snb.2018.03.185 |
| [36] |
H. Chen, F. Qi, H. Zhou, et al., Sensor. Actuat. B: Chem. 212 (2015) 505-511. DOI:10.1016/j.snb.2015.02.062 |
| [37] |
B. MacGillivray, D. Macartney, Eur. J. Org. Chem. 2013 (2013) 2573-2582. DOI:10.1002/ejoc.201201655 |
| [38] |
Q. Ai, J. Zhou, J. Guo, et al., Nanoscale 12 (2020) 17103-17112. DOI:10.1039/d0nr03360j |
| [39] |
Q. Ai, L. Jin, Z. Gong, F. Liang, ACS Omega 5 (2020) 10581-10585. DOI:10.1021/acsomega.0c01077 |
| [40] |
M. Zhang, Z. Gong, W. Yang, et al., ACS Appl. Nano Mater. 3 (2020) 4283-4291. DOI:10.1021/acsanm.0c00435 |