 2021, Vol. 32


b Guangdong Laboratory for Lingnan Modern Agriculture, Guangzhou 510642, China
Carbon dots (CDs) are a kind of carbon-based luminescent nanomaterials that have emerged in recent years [1-4]. Easy preparation and purification, adjustable optical and surface properties, and superior biocompatibility make them as fanscinating luminescent materials [5-7]. However, CDs in solid-state tend to aggregation-caused quenching (ACQ) like organic molecules due to excessive resonance energy transfer (RET) or direct π-π interactions [8-10]. Therefore, most researchers embed CDs in solid substrates to realize the solid-state self-stable state of CDs-based composites [11-13]. However, these methods are complicated and the CDs loading rate is low. It is difficult to maintain the excellent fluorescence performance in the CDs aqueous solution, and the high loading fraction still leads to a serious decrease in the PLQYs of CDs [14, 15].
Realizing the SSF of CDs still faces severe challenges [4]. Although there are various reports on CDs with high QY in solution [15-18], it seems difficult to avoid the strong quenching effect in SSF CDs. Some recent studies have shown that some CDs have been found to achieve effective SSF and resistance to self-quenching [19-21]. Possible solution is to introduce a certain steric hindrance between the CD particles. For example, the CD can be kept at a proper interval by introducing a long chain structure on the outer surface to reduce the CD interaction and ensure the SSF of CDs [10, 22, 23]. However, to meet the strong demand for white light SSF materials for LEDs, it is still a key challenge for the synthesis of CDs with multicolor SSF. One of the main characteristics of quantum dots is that they tend to exhibit quantum confinement effects [24]. These effects occur when the CDs are smaller than their exciton Bohr radius. In general, the size, doping, and functionalization of CDs affect their luminescence performance [25-27]. According to molecular orbital theory, the smaller the particle, the bluer the shift in emission frequency (that is, it shifts to higher energy).
Based on the above situation, we found a method that can effectively maintain the CDs of SSF, rather than introducing CDs into the solid-state dispersion system. The solvothermal reaction of dithiosalicylic acid (DTSA) with o-phenylenediamine (o-PD), m-phenylenediamine (m-PD), and p-phenylenediamine (p-PD) in acetic acid solution generates red, green, and blue SSF CDs, respectively. First, 490.16 mg of DTSA was dissolved in 40 mL of acetic acid solution with stirring until dissolved completely. Then 137.02 mg of o-PD was added to the mixed solution and stirred for 1 h. Subsequently, the mixed solution was transferred into the 100 mL Teflon reactor and kept at 180 ℃ for 10 h. After cooling down to room temperature naturally, the reaction solution was poured into 1 L boiling water, then it was filtered and dried to get pure o-CDs. The preparation of m-CDs and p-CDs is in the similar way. The position of the amino group in the aniline in the reaction precursor is changed to adjust the emission color of the SSF CDs, and the quantum yield (QY) reaches 20.77%.
As described above, DTSA was chosen as the carbon source and sulfur source and phenylenediamines as the nitrogen source attributed to its large conjugated structure, which can increase the conjugated π-domain and synthesize narrow bandgap CDs for long-wavelength emission. Surprisingly, the o-CDs, m-CDs, and p-CDs powders display red, green, and blue PL emission as shown in Figs. 1a-c. Optimum excitation of o-CDs, m-CDs, and p-CDs powders is 560 nm, 460 nm, 460 nm, and optimum emission of o-CDs, m-CDs, and p-CDs powders is 620 nm, 560 nm, 478 nm, respectively. The spectra in Figs. 1d-f reveal that all of the Abs-1 wavelengths of o-CDs, m-CDs, and p-CDs are in the range of 250–350 nm, with corresponding Abs-2 wavelengths of about 450–550 nm, 450 nm, and 400 nm, respectively. Furthermore, Abs-2 matches the fluorescence optimum excitation center (Figs. 1a-c) well, indicating that emission centers of CDs contribute to Abs-2 bands, but the absorption peaks at 250–350 nm do not.

|
Download:
|
| Fig. 1. PL excitation and emission spectra of o-CDs (a), m-CDs (b), and p-CDs (c). Inset image: photographs of m-CDs, o-CDs, and p-CDs. (d-f) UV–vis absorption spectra of o-CDs, m-CDs, and p-CDs, separately. | |
The three typical CDs are examined by transmission electron microscopy (TEM) to study their sizes. In Figs. 2a, d and g, the TEM images reveal that these CDs are homogeneous and well dispersed, with average particle sizes of about 4.5 nm, 4.0 nm and 3.5 nm for o-CDs, m-CDs, and p-CDs (Figs. 2c, f and i), respectively. Moreover, it can be seen that the central wavelength of the emission spectra shifts to a longer wavelength with the increase of the particle size. The high resolution TEM (HRTEM) images (Figs. 2b, e and h) show that all samples have similar wel resolved lattice fringes with a spacing of 0.21 nm, attributed to the (100) lattice distance of the graphitic carbon. Normalized PL spectra of o-CDs, m-CDs, and p-CDs show that the fluorescence peak width gradually narrows with the blue shift of the luminescence (Fig. 3a). Time-resolved PL decay curves were measured for the different emissions of these samples under 450 nm excitation, the average lifetime of o-CDs, m-CDs, and p-CDs were measured to be 3.16, 2.85 and 2.11 ns, respectively (Fig. 3b and Table S1 in Supporting information).

|
Download:
|
| Fig. 2. TEM images of o-CD (a, b), m-CD (d, e), and p-CDs (g, h) and corresponding HRTEM images inserted. (c, f, i) Particles size distribution of o-CD, m-CD, and p-CDs measured by TEM images. | |

|
Download:
|
| Fig. 3. (a) Normalized PL, (b) Lifetime, (c) FT-IR, and (d) XPS spectra of o-CDs, m-CDs, and p-CDs. | |
The functional groups were characterized by Fourier transform infrared (FT-IR) and X-ray photoelectron spectroscopy (XPS). Fig. 3c shows the FT-IR absorption band at 3505 cm−1 is assigned to the O–H stretching vibration. The absorption band at 2651 cm−1 is ascribed to S-H stretching vibration and the absorption band at 1677 cm−1 is ascribed to C=N/C=O stretching vibration. Besides, CDs obtained by solvothermal synthesis reserve the S-S bond at 554 cm−1. These functional groups could play roles in serving as sub-fluorophores for producing PL. In Fig. 3d and Table S2 (Supporting information), the full XPS spectra display five typical peaks at 164, 228, 285, 400 and 532 eV for S 2p, S 2s, C 1s, N 1s, and O 1s, respectively, indicating that all the CDs consisted of the same elements. In the high resolution XPS spectra (Fig. S1 and Table S3 in Supporting information), the S 2p spectra display three peaks at 162.7, 163.1 and 164.1 eV which can be attributed to S-C, S-H, and S-S, respectively. These three high-resolution spectra collectively indicate the successful insertion of S and N atoms into these CDs. However, the nitrogen content in o-CDs and p-CDs is low, the nitrogen in m-CDs contains two peaks at 398.9 and 399.6 eV, ascribing to graphite nitrogen and N-H (Fig. S1). The QY of o-CDs, m-CDs, and p-CDs is 4.05%, 20.77%, and 1.76%, which is attributed to the synergistic effect between carbon and nitrogen (Table S4 in Supporting information). The C 1s band can be deconvoluted into four binding energy peaks at 283.7, 284.3 and 288.1 eV, which could be assigned to C-C/C=C, C-N/C-O and C=N/C=O, respectively (Fig. S1 and Table S5 in Supporting information). The O 1s spectra contain two peaks at 531.1 and 533.3 eV for C=O and C-OH/C-O-C bands, respectively (Fig. S1 and Table S6 in Supporting information). The atomic ratio between carbon and oxygen decreases from 11.09% (o-CDs) to 5.47% (p-CDs), suggesting a decreasing degree of graphitization in these CDs (Table S2). Moreover, the C=O gradually decreases from 63.85% (o-CDs) to 42.58% (p-CDs), implying emission red-shift may be related to C=O on the surface of CDs. In brief, o-CDs, m-CDs, and p-CDs have abundant oxygen/nitrogen surface groups, and the CD's particle sizes decrease and their PL emission shift from red to blue. To further reveal the photoluminescence mechanism of CDs, we analyzed the PL spectra of CDs in solution as shown in Fig. S2 (Supporting information). When water is introduced, the hydrophobic effect causes the aggregation of CDs, so the CDs maintain their SSF characteristics in water. When dissolved in acetic acid, o-CDs, m-CDs, and p-CDs exhibit blue, green, and blue fluorescence, respectively. These phenomena reveal that o-CDs conform to the phenomenon of aggregation-induced emission (AIE) [21]. The surface groups of o-CDs may rotate around the intramolecular S-S bonds and consume the absorbed energy in the dissolved state, so o-CDs solution will not produce red fluorescence and exhibit similar PL characteristics as the reported blue emission CDs. However, in the solid-state, as a result of the intramolecular rotation being banned, the excitation energy can transfer dominantly into fluorescence [21]. When fully dispersed as a homogeneous solution, m-CDs and p-CDs do not conform to the AIE phenomenon and exhibit the same luminous color as solid.
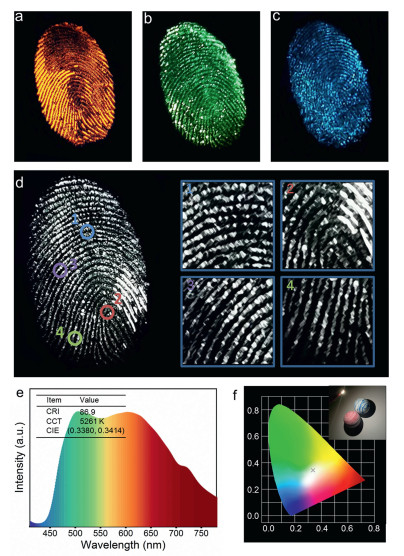
Figs. 4a-c displays the images of latent fingermarks after being applied with o-CDs, m-CDs, p-CDs, and tripartite mixture excited by UV light source, where each image of fingermarks in a different color are bright and clear. A possible mechanism of good effect was that the extremely small size and lipophilic characteristics of the nanomaterial increased the adhesion of the nanoparticle to fingermark. In contrast, the glossy and sharpened fingermark white-light image with better contrast and more details can be attained through the treatment of tripartite mixture excited at 365 nm (Fig. 4d). Besides, the WLED may be achieved solely by those CDs phosphors with appropriate commercial UV chips. As shown in Figs. 4e and f, warm-white light LEDs with high color rendering index of 86.9 approaching the coordinate (0.3380, 0.3414) can be achieved by a mixture of o-CDs, m-CDs, and p-CDs. Under 400 nm excitation wavelength, variable temperature spectroscopy image (Fig. S3 in Supporting information) shows that fluorescence intensity of o-CDs, m-CDs, and p-CDs remained stable as the temperature increased from 303 K to 443 K. When the temperature reached 443 K, the PL intensity can still remain 75% of the PL intensity at 303 K. The results show that the PL intensities remain nearly unchanged, indicating high thermal stability of those CDs.

|
Download:
|
| Fig. 4. (a-d) Photographs of the o-CD, m-CD, p-CD and tripartite mixed powder-stained latent fingerprints (LFPs) on glass substrates under UV light irradiation, respectively. (d1-d4) Photographs of the tripartite mixed powder magnified images showing four kinds of details in LFPs. (e) Emission spectrum of working WLED prepared by o-CD, m-CD, and p-CD mixed powder operated at 3.5 V. (f) CIE coordinates of o-CD, m-CD, and p-CD mixed powder under UV light (365 nm). Inset: the image of working WLED. | |
In short, the multicolor SSF of CDs were prepared by the one-pot solvothermal method. In the aggregate state, these CDs can resist self-quenching and maintain stable fluorescence emission. Through data analysis, there are abundant S-S, C=O, C=N, and other functional groups on the surface of the CDs. The degree of graphitization and the increase of C=O content of CDs are the main reasons for emission redshift. Besides, the particle size of the CDs shows a trend of o-CDs > m-CDs > p-CDs, that is, as the particle size of the CDs becomes larger, the emission redshifts. On this basis, white light LEDs were prepared using hybrid multi-color SSF-CDs. It can also be used for fingerprint recognition to meet different application.
Declaration of competing interestThe authors declare that they have no known competing financial interests or personal relationships that could have appeared to influence the work reported in this paper.
AcknowledgmentsThis work was supported by the National Natural Science Foundation of China (No. 51602108), the Guangdong Basic and Applied Basic Research Foundation (Nos. 2020A1515011210, 2017A030313256), and Guangzhou Science and Technology Project (Nos. 202007020005, 202102080288).
Supplementary materialsSupplementary material associated with this article can be found, in the online version, at doi:10.1016/j.cclet.2021.05.056.
| [1] |
D. Yoo, Y. Park, B. Cheon, M.H. Park, Nanoscale Res. Lett. 14 (2019) 272. DOI:10.1186/s11671-019-3088-6 |
| [2] |
Y.J. Chung, J. Kim, C.B. Park, ACS Nano 14 (2020) 6470-6497. DOI:10.1021/acsnano.0c02114 |
| [3] |
S. Tao, S. Zhu, T. Feng, C. Zheng, B. Yang, Angew. Chem. Int. Ed. 59 (2020) 9826-9840. DOI:10.1002/anie.201916591 |
| [4] |
A. Xu, G. Wang, Y. Li, et al., Small 16 (2020) 2004621. DOI:10.1002/smll.202004621 |
| [5] |
K.K. Chan, S.H.K. Yap, K.T. Yong, Nano-Micro Lett. 10 (2018) 72. |
| [6] |
D.L. Zhao, T.S. Chung, Water Res. 147 (2018) 43-49. DOI:10.1016/j.watres.2018.09.040 |
| [7] |
X.T. Tian, X.B. Yin, Small 15 (2019) 1901803. DOI:10.1002/smll.201901803 |
| [8] |
C.L. Chiang, M.T. Wu, D.C. Dai, et al., Adv. Funct. Mater. 15 (2005) 231-238. DOI:10.1002/adfm.200400102 |
| [9] |
Y. Ooyama, S. Yoshikawa, S. Watanabe, K. Yoshida, Org. Biomol. Chem. 4 (2006) 3406-3409. DOI:10.1039/b607891e |
| [10] |
Y. Chen, M. Zheng, Y. Xiao, et al., Adv. Mater. 28 (2016) 312-318. DOI:10.1002/adma.201503380 |
| [11] |
C.L. Shen, Q. Lou, C.F. Lv, et al., Adv. Sci. 6 (2019) 1802331. DOI:10.1002/advs.201802331 |
| [12] |
Y. Wang, S. Kalytchuk, Y. Zhang, et al., J. Phys. Chem. Lett. 5 (2014) 1412-1420. DOI:10.1021/jz5005335 |
| [13] |
C.L. Chiang, M.F. Wu, D.C. Dai, et al., Adv. Funct. Mater. 15 (2005) 231-238. DOI:10.1002/adfm.200400102 |
| [14] |
F. Yan, Y. Jiang, X. Sun, et al., Nano Res. 13 (2020) 52-60. DOI:10.1007/s12274-019-2569-3 |
| [15] |
S. Qu, D. Zhou, D. Li, et al., Adv. Mater. 28 (2016) 3516-3521. DOI:10.1002/adma.201504891 |
| [16] |
K. Zheng, X. Li, M. Chen, et al., Chem. Eng. J. 380 (2020) 122503. DOI:10.1016/j.cej.2019.122503 |
| [17] |
S.Y. Lu, R.D. Cong, S.J. Zhu, et al., ACS Appl. Mater. Interfaces 8 (2016) 4062-4068. DOI:10.1021/acsami.5b11579 |
| [18] |
S. Lu, L. Sui, J. Liu, et al., Adv. Mater. 29 (2017) 1603443. DOI:10.1002/adma.201603443 |
| [19] |
D. Zhou, P. Jing, Y. Wang, et al., Nanoscale Horiz 4 (2019) 388-395. DOI:10.1039/c8nh00247a |
| [20] |
Y. Zhang, P. Zhuo, H. Yin, et al., ACS Appl. Mater. Interfaces 11 (2019) 24395-24403. DOI:10.1021/acsami.9b04600 |
| [21] |
H. Yang, Y. Liu, Z. Guo, et al., Nat. Commun. 10 (2019) 1789. DOI:10.1038/s41467-019-09830-6 |
| [22] |
B.P. Jiang, Y.X. Yu, X.L. Guo, et al., Carbon 128 (2018) 12-20. DOI:10.1016/j.carbon.2017.11.070 |
| [23] |
S. Tao, S. Lu, Y. Geng, et al., Angew. Chem. Int. Ed. 57 (2018) 2393-2398. DOI:10.1002/anie.201712662 |
| [24] |
M.A. Sk, A. Ananthanarayanan, L. Huang, K.H. Lim, P. Chen, J. Mater. Chem. C 2 (2014) 6954-6960. DOI:10.1039/C4TC01191K |
| [25] |
Y.F. Shen, Y. Liang, Y.P. Wang, C.L. Liu, X.Y. Ren, J. Nanopart. Res. 20 (2018) 229. DOI:10.1161/circulationaha.117.031699 |
| [26] |
T.H.T. Dang, V.T. Mai, Q.T. Le, N.H. Duong, X.D. Mai, Chem. Phys. 527 (2019) 110503. DOI:10.1016/j.chemphys.2019.110503 |
| [27] |
S. Do, W. Kwon, Y.H. Kim, et al., Adv. Opt. Mater. 4 (2016) 276-284. DOI:10.1002/adom.201500488 |