 2021, Vol. 32


b Electrochemical Energy Engineering Research Center of Guangdong Province, South China University of Technology, Guangzhou 510640, China;
c Department of Mechanical Engineering, The Hong Kong Polytechnic University, Hong Kong, China
Sodium-ion batteries (SIB) have been regarded as one of the alternatives to lithium-ion batteries and a competitive candidate for large-scale energy storage systems, due to the natural abundance of sodium resources [1, 2]. However, owing to the radius of Na+ ion is larger than that of Li+ (RNa+: 1.02 Å vs. RLi+: 0.76 Å), it is still a large challenge to design suitable electrode materials which can meet the requirements of effectively and reversibility accommodating the Na+ [3-6]. Recently, numerous functional materials, including carbonaceous materials [7, 8], metal alloys [9], metal oxides/sulfides/borates [10-12] and titanium-based materials [13, 14], have been proposed as anode materials for SIBs. Among them, TiO2 has achieved widespread research interest in the consideration of its many merits, such as low cost, eco-friendliness, structural stability upon sodiation and desodiation, and reasonable working voltage region avoiding the problem of dangerous Na plating [15, 16]. Nevertheless, due to the inherent properties of TiO2, they exhibit poor conductivity, sluggish Na+ diffusion kinetics, and low electrochemical activity, largely hindering their practical application in SIB [17].
Very recently, aiming to improve the Na+ storage performance of TiO2 anode, many strategies, including constructing various nanostructures [15], doping heteroatoms (N, S, B, P) [18-24], and fabricating carbon-coating [25, 26], have been taken. It has been proved that the doping of P into TiO2 is an efficacious and feasible method to meliorate the sluggish Na+ diffusion kinetics and then enhanced sodium storage performance. For example, Lu's and Chou's group reported surface phosphorylated TiO2 nanotube arrays and hollow nanospheres, respectively, and which both display obviously improved specific capacity and rate performance as the anode for SIBs [21, 22]. In addition, the TiO2@TiO2−x-P nanoparticles with a high concentration of phosphorus doping (7.8 wt%) reported by Lu's group displays an impressive capacity of 167 mAh/g at a very high current density of 10 A/g [23]. However, it has demonstrated that TiO2 crystal structure is ultra-stable, and thus, making it is very difficult to obtain high P-doping concentration in TiO2 [27]. Also, it has been recognized that only when the doping concentration is high enough to induce an additional electronic state in the band-gap of TiO2, the electronic conductivity can be considerably improved [27, 28]. Therefore, it is expected that the design of novel methods for doping high content of P into TiO2 crystallites, especial for the solid TiO2 spheres. This is because the solid TiO2 is beneficial to improve the volumetric energy density of the batteries. Except for the P-doping strategy, carbon coating on the surface of TiO2 not only can effectively enhance the conductivity but also alleviate the volume expansion during the repeated Na+ insertion/extraction processes, resulting in its enhanced specific capacity, rate capability, and cycling stability [25, 26]. Dopamine is a biomolecule that can self-polymerize in alkaline buffer and form a uniform polydopamine film on the surface of many materials. Furthermore, the thickness of the coating layer of the polydopamine can be controlled by changing the reaction time during the self-polymerization procedures, and thus, a uniform N-doped carbon coating layer can be achieved after simple pyrolysis [29, 30]. Based on the above-mentioned discussion, it is practicable that the electrochemical performances of TiO2 solid spheres can be further improved by taking the two advantages resulted from the P-doping and N-doping carbon coating.
In this paper, we developed a novel method for the preparation of (P-AnTSS)@NC solid spheres with superior sodium storage properties by high P-doping concentration and an N-doped carbon coating layer. Different from the previous method using the anatase TiO2, we choose amorphous TiO2 (denoted as AmTSS) with rich pores (Figs. S1 and S2 in Supporting information) and ultra-high specific surface area (SBET) as the precursor for phosphating treatment firstly and followed by carbon coating using dopamine as the carbon sources. Herein, the rich micropores and ultra-high SBET enable the diffusion and mobility of P atoms easily and thus ensure to achieve high P-doping concentration, and the use of dopamine as the carbon source can lead to the final carbon layer with N-doping onto the surface of TiO2 homogenously. As a result, the as-obtained (P-AnTSS)@NC solid spheres display a desirable electrochemical performance. To explore the synergistic effect of P-doping and carbon coating, we also synthesized P-doped TiO2 (denoted as P-AnTSS) and carbon-coated TiO2 (denoted as AnTSS@NC) by using AmTSS as the precursor for phosphating treatment and carbon coating, respectively. In addition, we prepared another P-doped sample (denoted as P-(AnTSS)) by employing anatase TiO2 nanospheres (AnTSS) as the precursor for phosphating treatment, which was achieved from the thermal treatment of the AmTSS sample at 400 ℃ in air.
Fig. 1 schematically shows the overall synthetic processes of the (P-AnTSS)@NC sample. Initially, the amorphous TiO2 spheres (AmTSS) with a high specific surface area are synthesized by a typical method with some modifications [31]. Subsequently, the as-obtained TiO2 spheres were placed on the downstream side of the NaH2PO2·H2O and thermal treatment for 2 h at 500 ℃ under Ar, to achieve the P-doped TiO2 (P-TiO2). The P-TiO2 was then dispersed in an aqueous solution of dopamine for encapsulating a polydopamine on the surface. Finally, the polydopamine-coated P-TiO2 was calcined at 600 ℃ for 2 h under Ar to obtain the (P-AnTSS)@NC solid spheres. For contrast, other two samples denoted as P-AnTSS and AnTSS@NC are synthesized, which are the AmTSS only by the P-doping or the carbon-coating, respectively. All detailed experimental procedures are shown in the supporting information.

|
Download:
|
| Fig. 1. Schematic illustration for the preparation of (P-AnTSS)@NC with high P-doping concentration and N-doped carbon layer. | |
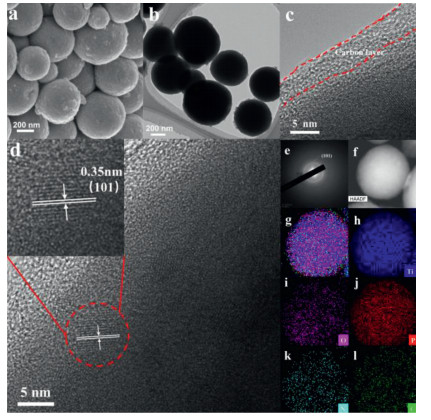
The scanning electron microscope (SEM) images of the (P-AnTSS)@NC, AmTSS, P-AnTSS, P-(AnTSS) and AnTSS@NC are presented in Fig. 2a and Fig. S3 (Supporting information) respectively. Apparently, all samples appear uniformly spherical morphology with an average diameter of around 360 nm, indicating that whether after phosphorization, or carbon-coating or thermal treatment in air, the pristine morphology and size of the TiO2 can still be maintained. Low resolution and high-resolution transmission electron microscope (HRTEM) images of the (P-AnTSS)@NC are presented in Fig. 2b and Fig. S4 (Supporting information) as well as Figs. 2c and d, respectively. It can be observed that the amorphous carbon layers are homogenously coated on the surface of the (P-AnTSS)@NC smaple. Furthermore, the thickness of the carbon layers is about 3–4 nm, as shown in Fig. 1c. In addition, in combination with the observed a lattice fringe spacing of 0.35 nm (Fig. 2d) and the corresponding SAED pattern (Fig. 1e), the formation of anatase TiO2 can be confirmed [32, 33]. The energy dispersive X-ray spectroscopy (EDS) mappings (Figs. 1f–l) indicated that P, C, N, Ti, and O elements are uniformly distributed, suggesting that the P element was successfully doped into the TiO2 solid spheres. The EDS results further prove that the P-doping content of the (P-AnTSS)@NC is as high as 13.48 wt% (Fig. S5 in Supporting information). In contrast, the P-doping concentration of the P-(AnTSS) and P-AnTSS samples are 4.64 and 11.11 wt%, respectively based on the EDS analysis (Fig. S6 in Supporting information). These results also further prove that our design strategy of using the amorphous TiO2 as the precursor is beneficial to increasing the P-doping concentration in TiO2.

|
Download:
|
| Fig. 2. (a) SEM image, (b) TEM image, (c, f) HRTEM images, (e) SAED pattern, (f-l) STEM-HAADF images and the corresponding EDS mapping for the (P-AnTSS)@NC sample. | |
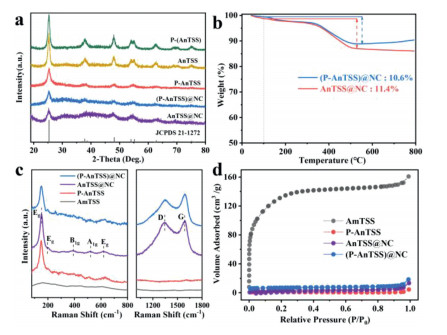
The X-ray diffraction (XRD) patterns in Fig. S1 show that there are no obvious diffraction peaks for the AmTSS sample, which corresponds to its amorphous state. All the diffraction peaks of the AnTSS@NC, (P-AnTSS)@NC, P-AnTSS, AnTSS and P-(AnTSS) are well assigned to the peaks of the standard anatase TiO2 [32, 33]. Comparing the XRD patterns of the five samples shown in Fig. 3a, it can be found that both the AnTSS and P-(AnTSS) show very high diffraction intensity, while the intensities of the diffraction peaks of the P-AnTSS and the carbon-coated samples are much weaker than those of the AnTSS and P-(AnTSS) samples. It is worth noting that no obvious carbon peaks are observed in the XRD patterns of the AnTSS@NC and (P-AnTSS)@NC samples, which is because of the carbon layer in an amorphous state and the low content.

|
Download:
|
| Fig. 3. (a) XRD patterns of the AnTSS@NC, (P-AnTSS)@NC, P-AnTSS, AnTSS and P-(AnTSS) samples. (b) Thermal gravimetric analysis (TGA) curve of the AnTSS@NC and (P-AnTSS)@NC samples. (c) Raman spectra and (d) N2-adsorption/desorption isotherms for the AmTSS, P-AnTSS, AnTSS@NC and (P-AnTSS)@NC samples. | |
Thermogravimetric analysis (TGA) was carried out in air flow from room temperature to 800 ℃ to detect the content of carbon in the (P-AnTSS)@NC and AnTSS@NC samples. As displayed in Fig. 3b, the mass loss below 100 ℃ is attributed to the removal of adsorbed water. A mass loss that appeared at 100–400 ℃ is mainly from the decomposition of carbon and the elimination of a very small amount of chemisorbed water. In the range of 400–500 ℃ the mass loss is due to the burning of the residual carbon [26]. When the temperature was increased to 500–600 ℃, a slight mass increase was observed with the rising of temperature. This may be due to the oxidation of the P with O2. Based on the above analysis, the carbon content in the (P-AnTSS)@NC sample is inferred to be ~10.6 wt%. Similarly, the carbon content of the AnTSS@NC is ~11.4 wt%, which is very close to that of the (P-AnTSS)@NC sample.
Raman spectroscopies shown in Fig. 3c were further detected to the structural properties of the as-prepared four samples. Except for the AmTSS, the other three samples displayed similar Raman peaks located at 150, 197, 395, 522 and 624 cm−1, corresponding to the anatase TiO2 [32]. Meanwhile, two characteristic peaks located at ~1350 and 1590 cm−1 were observed for the AnTSS@NC and (P-AnTSS)@NC samples, which are ascribed to the D band and G band of carbon, respectively [22, 34]. The ID/IG of values of the two samples are both ~1.0, indicating the typical amorphous carbon with partial graphitization character [34].
N2-adsorption/desorption isotherms are shown in Fig. 3d, and their corresponding pore size distribution curves are displayed in Fig. S2, which indicated the AmTSS sample exhibits obviously large adsorption capacity than that of the other three samples because of its rich microporous structure. The calculated specific surface areas are 426.39, 4.29, 11.58 and 21.91 m2/g for the AmTSS, P-AnTSS, AnTSS@NC and (P-AnTSS)@NC, respectively. The rich pores and high SBET of the AmTSS facilitate the diffusion and mobility of P atoms and thus ensure to achieve a high P-doping concentration. After P-doping and carbon coating at relatively high temperature to promote the formation of TiO2 crystallization phase and the growth of particle size, the SBET of the (P-AnTSS)@NC sample was decreased to 21.91 m2/g, which may contribute to decreasing side reactions between the active material and electrolyte and thus improving cycle stability when it was used to anode material for SIBs.
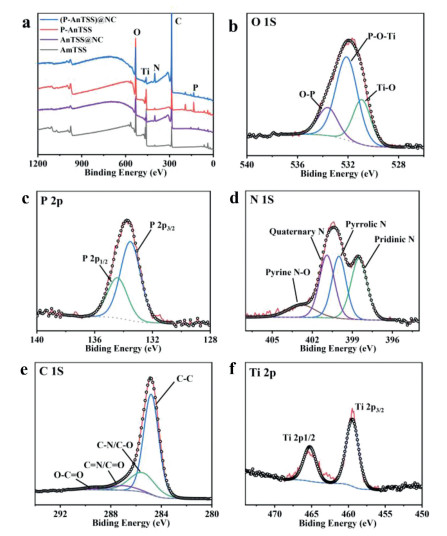
XPS was performed to unfold the surface components and states for all samples. According to the XPS results as shown in Fig. 4a, the signals of P were detected only in the P-AnTSS and (P-AnTSS)@NC materials, suggesting the successful doping of P in the two samples. Specifically, in the O 1s spectrum (Fig. 4b) of the (P-AnTSS)@NC sample, three peaks located at 530.9, 532.1 and 533.6 eV were observed, which can be assigned to Ti-O, P-O-Ti, O-P and supporting that P dopes into the bulk lattice [22, 35]. As similar to the reported results, the high-resolution P 2p spectrum (Fig. 4c) only exhibited two peaks at 133.5 and 134.4 eV corresponded to the P-O-Ti bonds and phosphate species [21, 23]. The high-resolution N 1s spectrum (Fig. 4d) consists of four peaks located at 398.5, 400, 400.9, and 402.8 ev, which are corresponded to pyridinic N, pyrrolic N, quaternary N, and oxidized nitrogen atoms, respectively [22, 34]. The high-resolution C 1s spectrum (Fig. 4e) indicate four various carbon types, namely C-C (284.8 eV), C-N/C-O (285.5 eV), C=N/C=O (287 eV), and O-C=O (289.4 eV) were observed [34]. The Ti 2p3/2 and Ti 2p1/2 peaks (Fig. 4f) located at about 458.9 and 464.6 eV, implying the dominant state of Ti4+ [35]. The above results verify that P was successfully introduced into the crystal lattice of the (P-AnTSS)@NC sample after the phosphorization, which in favor of Na+ transfer kinetics. Meanwhile, the N-doping carbon layer improves the conductivity and thus promotes sodium storage performance [22, 25].

|
Download:
|
| Fig. 4. (a) XPS spectra of the AmTSS, P-AnTSS, AnTSS@NC and (P-AnTSS)@NC samples. High-resolution XPS spectra of (b) O 1s, (c) P 2p, (d) N 1s, (e) C 1s and (f) Ti 2p of the (P-AnTSS)@NC sample. | |
The Na+ storage performances of all samples were evaluated by cyclic voltammetry (CV) and galvanostatic discharge and charge (GDC) tests using the assembling coin cells with Na metal as the counter electrodes. The corresponding results are shown in Fig. 5 and Fig. S7 (Supporting information). As displayed in Fig. 5a, a broad cathodic peak appeared in the initial cathodic scan at 1.3–0.8 V, and then disappeared for the subsequent cathodic sweeps, which was ascribed to the formation of solid electrolyte interphase (SEI) films resulted from the decomposition of electrolyte [23]. After the first scan, the CV curves exhibited a pair of redox peaks located at 0.67/0.89 V, assigning to the reversible insertion/de-intercalation of Na+ into/from the (P-AnTSS)@NC sample [23]. Fig. 5b and Fig. S8 (Supporting information) respectively show the GDC profiles of the initial three cycles of the four samples at 50 mA/g. In the first cycle, there is an obvious inclined discharge platform in the voltage range of 1.3–0.8 V, which is primarily due to the formation of solid electrolyte interface (SEI) films and some irreversible reactions between electrode and electrolyte [23]. The initial discharge/charge capacities are 414/226, 404/221, 380/182 and 434/125 mAh/g for the (P-AnTSS)@NC, P-AnTSS, AnTSS@NC, and AmTSS, respectively, with the corresponding initial coulombic efficiencies (ICE) of 54.5%, 54.7%, 48.0% and 28.9%. It is suggested that P-doping could effectively improve both the charge capacities and ICE, very similar to previous reports [21-23, 35].

|
Download:
|
| Fig. 5. (a) The first-three CV curves at a scan rate of 0.2 mV/s between 0.01 V and 2.5 V and (b) charge-discharge profiles at a current density of 50 mA/g of the (P-Ants)@NC sample. (c) Rate performances of (P-AnTSS)@NC, P-AnTSS, AnTSS@NC and AmTSS. (d) CV curves at various scan rates from 0.2 mV/s to 2 mV/s. (e) Linear relationship of log(ν) and log(i). (f) Separation of the capacitive and diffusion currents at a sweep rate of 1 mV/s. (g) Cycling performance at 1 A/g of the (P-AnTSS)@NC sample. | |
Fig. 5c compares the rate performances of the as-prepared four samples. Obviously, the (P-AnTSS)@NC sample displays the highest specific capacity among the four samples at any rate. Specifically, the (P-AnTSS)@NC sample delivers discharge capacities of 212, 193, 174, 147, 127, 102 and 61 mAh/g as the current densities increased from 0.05 mA/g to 0.1, 0.2, 0.5, 1, 2 and 5 A/g, respectively. Impressively, when the current density returns to 0.1 A/g, the discharge capacity can be restored to 202 mAh/g. Even though the P-AnTSS sample has a similar capacity as the (P-AnTSS)@NC sample in the initial cycle, it fades rapidly. The AnTSS@NC sample possesses better cycle stability under the protection of the carbon layer, but the capacity is unsatisfactory. These results indicate that the synergistic effect of P-doping and carbon coating plays an important role in improving the electrochemical performance of TiO2 solid spheres. The results of the long-term cycling performance tests further support this point of view. As shown in Fig. S9 (Supporting information), the (P-AnTSS)@NC sample exhibits a capacity of 177 mAh/g after 150 cycles at 0.1 A/g, which is significantly higher than that of the other three samples. Besides, the (P-AnTSS)@NC sample shows very stable cycle performance at a high current density of 1.0 A/g, with a capacity of 115 mAh/g after 2000 cycles and capacity retention of 88% (Fig. 5g). As listed in Table S1 (Supporting information), the (P-AnTSS)@NC sample also displayed promising electrochemical performance with a combination of high specific capacity and outstanding cycle stability, as compared to the previously reported TiO2-based materials. In addition, it displays slightly low gravimetric specific capacity than that of some P-doping TiO2 with rich pores and/or small particle size [21-23, 35], the (P-AnTSS)@NC sample in solid spheres may possess high volumetric specific capacity, which is advantageous to practical application.
To further explore the difference of the electrochemical performance of the P-doped TiO2 using the different TiO2 precursors (amorphous and anatase TiO2), the rate performance of the AnTSS, P-(AnTSS) and P-AnTSS sample are compared. As shown in Fig. S10 (Supporting information), it was found that the specific capacity of the P-AnTSS sample is higher than that of the P-(AnTSS) sample at any current density. These results indeed prove that our design strategy of using the amorphous TiO2 as the precursor is beneficial to increasing the P-doping concentration and improving the electrochemical performance.
In addition, the influence of different carbon content on the electrochemical performance of the (P-AnTSS)@NC-based samples were investigated. As shown in Fig. S11 (Supporting information), three samples denoted as (P-AnTSS)@NC, (P-AnTSS)@NC-6 h, and (P-AnTSS)@NC-12 h, achieved from the reaction time of 3, 6 and 12 h, respectively, during the polymerization of dopamine, show some minor difference in their specific capacities. It can be seen that the specific capacities decrease with the increasing of the reaction time (carbon content) in the samples, although the rate performance of the sample with higher carbon content displays little improvement.
Electrochemical impedance spectroscopy (EIS) measurement was adopted to achieve a better understanding of the effect of the P-doping and carbon-coating for improving the electrochemical performances. As seen in Fig. S12 and Table S2 (Supporting information), the (P-AnTSS)@NC sample show the smallest charge-transfer resistance (Rct = 30.7 Ω) among the four samples (P-AnTSS, 40.3 Ω; AnTSS@NC, 63.5 Ω, and AmTSS, 207.0 Ω), confirming that P doping and carbon coating can enhance the diffusion kinetics and thus synergistically improve the charge transfer.
To gather deeper insight into the reaction kinetics of the (P-AnTSS)@NC sample, CVs at different scan rates of 0.2 mV/s to 2.0 mV/s were carried out on the (P-AnTSS)@NC electrode (Fig. 5d). As the scan rate increases, all CV curves retain a basic shape, although the redox peaks exhibit slightly shifted. As previous demonstration [36], the surface types of electrochemical behavior can be characterized via the functional relationship between current (i) and sweep speed (v) according to a power-law equation: i = avb. The value of b can be determined by calculating the slope of log(i)-log(v) curve. Generally, the b-value of 0.5 represents a diffusion-dominated process, while b = 1 indicates a completely capacitive process. The b-values for cathodic and anodic peaks of the (P-AnTSS)@NC sample at scan rates range of 0.2 mV/s to 2.0 mV/s are calculated to be 0.86 and 0.95, respectively, demonstrating that the kinetics is mainly governed by the pseudocapacitive process (Fig. 5e). Moreover, the capacitive contribution can be further quantitatively analyzed based on the i(V) = k1v + k2v1/2, where k1v and k2v1/2 stand for capacitive-controlled and diffusion-dominated current, respectively [36]. As illustrated in Fig. 5f, the capacitive-controlled charge storage proportion of the (P-AnTSS)@NC electrode is about 71% at 1.0 mV/s. Furthermore, the capacitance contribution increases with increasing scan rates and reaches a value of 82% at 2.0 mV/s (Fig. S13 in Supporting information). It is suggested that the excellent electrochemical performance of the (P-ANTSS)@NC sample can be reasonably attributed to the enhanced capacitance storage capacity originated from the synergistic effect of P-doping and carbon coating.
In summary, a novel synthetic route for preparing N-doped carbon coated anatase TiO2 with high P-doping concentration was developed, by using amorphous TiO2 with ultra-high SBET as a precursor. Thanks to the structural characteristics of amorphous TiO2, the P can be uniformly doped into the solid spheres finally. Benefiting from the synergistic effects of P-doping and carbon coating, the specific capacity and cycle stability of the obtained (P-AnTSS)@NC sample have been obviously improved, delivering an outstanding specific capacity of 115 mAh/g at 1.0 A/g after 2000 cycles. After comparison the P-doping level and electrochemical performance of the P-AnTSS and P-(AnTSS) samples prepared from the amorphous and anatase TiO2 precursors, respectively, it is indicated our design strategy is indeed beneficial to increasing the P-doping concentration in TiO2. We anticipate that such a P-doping approach can provide a new idea for the preparation of electrode materials with high heteroatom doping concentration.
Declaration of competing interestThe authors declare no conflict of interest.
AcknowledgmentsThis work was supported by the National Natural Science Foundation of China (No. 21875071) and the Guangdong key R & D Program of China (No. 2019B090908001).
Supplementary materialsSupplementary material associated with this article can be found, in the online version, at doi: 10.1016/j.cclet.2021.05.013.
| [1] |
A. Eftekhari, D.W. Kim, J. Power Sources 395 (2018) 336-348. DOI:10.1016/j.jpowsour.2018.05.089 |
| [2] |
T.F. Liu, Y.P. Zhang, Z.G. Jiang, et al., Energy Environ. Sci. 12 (2019) 1512-1533. DOI:10.1039/c8ee03727b |
| [3] |
P.K. Nayak, L. Yang, W. Brehm, P. Adelhelm, Angew. Chem. Int. Ed. 57 (2018) 102-120. DOI:10.1002/anie.201703772 |
| [4] |
N. Sun, Z.R. Guan, Y.W. Liu, et al., Adv. Energy Mater. 9 (2019) 1901351. DOI:10.1002/aenm.201901351 |
| [5] |
Y.B. Shen, Y.H. Lia, S.J. Deng, et al., Chin. Chem. Lett. 31 (2020) 846-850. DOI:10.1016/j.cclet.2019.06.044 |
| [6] |
Y.P. Li, Q.B. Zhang, Y.F. Yuan, et al., Adv. Energy Mater. 10 (2020) 2000717. DOI:10.1002/aenm.202000717 |
| [7] |
H.S. Hou, L.D. Shao, Y. Zhang, et al., Adv. Sci. 4 (2017) 1600243. DOI:10.1002/advs.201600243 |
| [8] |
P. Lu, Y. Sun, H.F. Xiang, X. Liang, Y. Yu, Adv. Energy Mater. 8 (2018) 1702434. DOI:10.1002/aenm.201702434 |
| [9] |
M.M. Lao, Y. Zhang, W.B. Luo, et al., Adv. Mater. 29 (2017) 1700622. DOI:10.1002/adma.201700622 |
| [10] |
L. Wang, X.F. Bi, S.B. Yang, Adv. Mater. 28 (2016) 7672-7679. DOI:10.1002/adma.201601723 |
| [11] |
D. Sun, D.L. Ye, P. Liu, et al., Adv. Energy Mater. 8 (2018) 1702383. DOI:10.1002/aenm.201702383 |
| [12] |
B.Z. Wu, S. Qi, X.K. Wu, et al., Chem. Lett. 32 (2021) 3113-3117. |
| [13] |
Y. Zhang, C.W. Foster, C.E. Banks, et al., Adv. Mater. 28 (2016) 9391-9399. DOI:10.1002/adma.201601621 |
| [14] |
X. Xu, B. Chen, J.P. Hu, et al., Adv. Mater. 31 (2019) 1904589. DOI:10.1002/adma.201904589 |
| [15] |
B. Chen, Y.H. Meng, F.X. Xie, et al., Adv. Mater. 30 (2018) 1804116. DOI:10.1002/adma.201804116 |
| [16] |
M.H. Wu, Y.P. Gao, Y. Hua, B. Zhao, H.J. Zhang, Chin. Chem. Lett. 31 (2020) 897-902. DOI:10.1016/j.cclet.2019.07.039 |
| [17] |
Z.L. Xu, K. Lim, K.Y. Park, et al., Adv. Funct. Mater. 28 (2018) 1802099. DOI:10.1002/adfm.201802099 |
| [18] |
S.N. Liu, Z.Y. Cai, J. Zhou, A.Q. Pan, S.Q. Liang, J. Mater. Chem. A 4 (2016) 18278-18283. DOI:10.1039/C6TA08472A |
| [19] |
J.F. Ni, S.D. Fu, C. Wu, et al., Adv. Mater. 28 (2016) 2259-2265. DOI:10.1002/adma.201504412 |
| [20] |
B.F. Wang, F. Zhao, G.D. Du, et al., ACS Appl. Mater. Interfaces 8 (2016) 16009-16015. DOI:10.1021/acsami.6b03270 |
| [21] |
J.F. Ni, S.D. Fu, Y.F. Yuan, et al., Adv. Mater. 30 (2018) 1704337. DOI:10.1002/adma.201704337 |
| [22] |
Q.B. Xia, Y. Huang, J. Xiao, et al., Angew. Chem. Int. Ed. 58 (2019) 1-6. DOI:10.1002/anie.201813481 |
| [23] |
Q.M. Gan, H.N. He, Y.H. Zhu, et al., ACS Nano 13 (2019) 9247-9258. DOI:10.1021/acsnano.9b03766 |
| [24] |
Z.M. Zheng, H.H. Wu, H.D. Liu, et al., ACS Nano 14 (2020) 9545-9561. DOI:10.1021/acsnano.9b08575 |
| [25] |
W.F. Zhang, T.B. Lan, T.L. Ding, N.L. Wu, M.D. Wei, J. Power Sources 359 (2017) 64-70. DOI:10.1016/j.jpowsour.2017.05.040 |
| [26] |
Y. Zhang, Y.C. Yang, H.S. Hou, et al., J. Mater. Chem. A 3 (2015) 18944-18952. DOI:10.1039/C5TA04009D |
| [27] |
Y. Pan, Z.H. Luo, Y.C. Chang, K.C. Lau, C.Y. Ng, J. Phys. Chem. A 121 (2017) 669-679. DOI:10.1021/acs.jpca.6b09491 |
| [28] |
Y.Q. Zhang, L. Guo, L. Tao, Y.B. Lu, S.Y. Wang, Small Method 3 (2018) 1800406. |
| [29] |
R. Liu, S.M. Mahurin, C. Li, et al., Angew. Chem. Int. Ed. 50 (2011) 6799-6802. DOI:10.1002/anie.201102070 |
| [30] |
Q. Wang, B.Y. Wang, Z. Zhang, et al., Inorg. Chem. Front. 5 (2018) 2605-2614. DOI:10.1039/c8qi00849c |
| [31] |
J.H. Pan, X.Z. Wang, Q.Z. Huang, et al., Adv. Funct. Mater. 24 (2014) 95-104. DOI:10.1002/adfm.201300946 |
| [32] |
M. Gao, Y.B. Bao, Y.X. Qian, et al., Inorg. Chem. 57 (2018) 12245-12254. DOI:10.1021/acs.inorgchem.8b01948 |
| [33] |
J.Y. Shen, H. Wang, Y.P. Song, et al., Chem. Eng. J. 240 (2014) 379-386. DOI:10.1016/j.cej.2013.11.095 |
| [34] |
K.X. Zou, Z.X. Guan, Y.F. Deng, et al., Carbon 161 (2020) 25-35. |
| [35] |
M.L. Kang, Y.R. Ruan, Y.Z. Lu, et al., J. Mater. Chem. A 7 (2019) 16937-16946. DOI:10.1039/c9ta05299b |
| [36] |
B.S. Li, B.J. Xi, Z.Y. Feng, et al., Adv. Mater. 30 (2018) 1705788. DOI:10.1002/adma.201705788 |