 2021, Vol. 32


b Beijing Institute of Spacecraft System Engineering, Beijing 100094, China;
c University of Chinese Academy of Sciences, Beijing 100049, China
The development and application of energy storage materials have attracted wide attention, due to the contradiction between energy shortage and increasing energy demand caused by the massive consumption of fossil energy. As a commonly used thermal energy storage material, phase change materials (PCMs) can store and release a large amount of latent heat in the phase change process and keep almost constant temperature, which provides favorable conditions for thermal energy recovery and secondary utilization, as well as temperature control. In addition to relatively high energy storage density, PCMs are inexpensive, non-toxic and readily available [1], making them used in solar energy storage, electronic chip cooling, battery thermal management, industrial waste heat recovery, energy saving building, establishment of thermal energy storage (TES) system, intelligent temperature control clothing and other fields [2-7]. PCMs are generally divided into inorganic phase change materials and organic phase change materials. Although inorganic PCMs have higher enthalpy of phase change, they also have obvious shortcomings, such as undercooling, corrosion, phase separation and poor thermal stability [8]. Compared with inorganic PCMs, organic PCMs are always better choice of PCMs in TES system because of their non-corrosion, almost non-undercooling and self-nucleation [4, 9]. n-Alkanes, one of the most important organic PCMs [1], are unbranched saturated open-chain hydrocarbons, which not only have the advantages of organic PCMs mentioned above, but also have stable chemical properties, good cycle stability and low vapor pressure. Although the current study on n-alkanes is mainly focused on constructing composite PCMs for preventing liquid phase leakage and how to improve the thermal conductivity of PCMs [10-19], it is necessary to understand the basic physical and chemical properties of pure substances for practical applications of n-alkanes in thermal energy storage field. The thermodynamic properties of pure n-alkanes, such as heat capacity, enthalpy and entropy, and other thermal properties of thermal stability and thermal conductivity, are the prerequisites for the reasonable and effective preparation of PCMs that meet the needs of practical production, and the design of TES system also needs to understand the phase transition behavior of n-alkanes and the thermophysical parameters of condensed matter.
Vélez et al. [20, 21] studied the thermal properties of some n-alkanes from C15H32 to C20H42, and measured their thermal conductivities and heat capacities in the temperature range of 258–350 K by the transient hot wire method and differential scanning (DSC) method, respectively. The reliable liquid phase heat capacity data were obtained in their work, but the heat capacity data in the solid phase region deviated from the literature values of more than 8%, as mentioned in their paper. Durupt et al. [22] measured the liquid phase heat capacities of n-octadecane, n-nonadecane and n-docosane in the temperature range of 373–473 K using a DSC method. However, it was found that the DSC instrument used in their work had a systematic deviation of 4% between the two sets of data, and only 50 determinations were presented from the heat capacity data of each sample. Faden et al. [23] reviewed the thermophysical property data of n-octadecane. According to their summary of heat capacity data from the literature, most researchers used DSC to only measure the heat capacity of liquid phase n-octadecane, and also relatively few observations were presented. For the heat capacity of solid n-octadecane, except that there were about 50 heat capacity data provided by Vélez et al. [20] and Messerly et al. [24], the solid phase heat capacity data in other literature were not comprehensive. Generally, regarding the research on heat capacity of n-alkanes, most of the reports so far are mainly focused on the measurement of liquid n-alkanes, while most of solid phase heat capacity measurements are reported several decades ago and no related heat capacity studies are performed currently. On the other hand, these reported heat capacity studies on n-alkanes are generally performed using the DSC method, the accuracy of which may be insufficient for further investigate their thermodynamic properties.
In our previous research work, we reported heat capacity studies on some sugar alcohols and polyethylene glycols (PEG) [25, 26], which are two of hottest PCMs currently concerned for new type PCMs synthesis and phase transition performance investigation. However, rather surprisingly, the heat capacity and related thermodynamic properties of n-alkanes, commonly used PCMs in thermal energy storage application field, have not been systematically studied yet until now. In this work, we have studied thermodynamic properties especially heat capacity of five n-alkanes of n-octadecane, n-nonadecane, n-eicosane, n-heneicosane and n-docosane using various thermal analysis and calorimetry methods. The crystal structure, thermal stability and thermal conductivity of these n-alkanes have been determined using X-ray diffractometer (XRD), thermogravimetric analyzer (TGA) and thermal constants analyser, respectively. The phase transition process of n-alkanes has been evaluated by the differential scanning calorimeter. The solid and liquid phase heat capacity of the n-alkanes have been measured in a wide temperature range from 1.9 K to 370 K using a combined relaxation (physical property measurement aystem, PPMS), DSC and adiabatic calorimetry (AC) method, and the corresponding thermodynamic functions have been consequently obtained by the heat capacity curve fitting.
The n-octadecane, n-nonadecane, n-eicosane and n-docosane samples were commercially obtained from Sigma Aldrich, and the n-heneicosane sample was from Supelco. The corresponding information of these samples is listed in Table 1. The detailed information about the sample characterization experiment and instrument correction is provided in Supporting information [27-31].
|
|
Table 1 Sample information in this work.a |

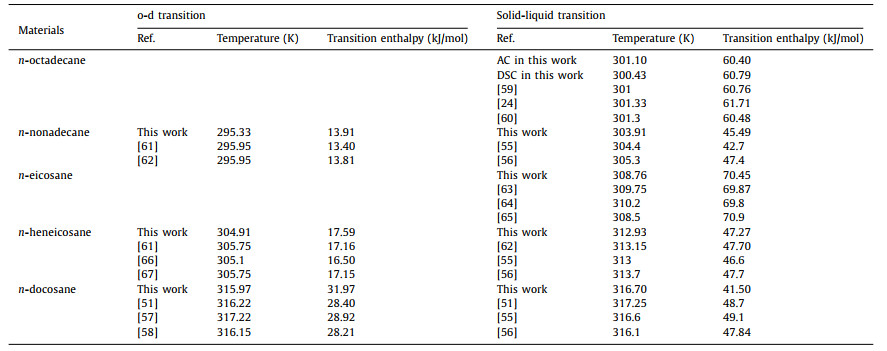
n-Alkane (CnH2n+2) is a special kind of organic matter, and its low-temperature crystal may have different crystal structure because of the different number of carbon atoms: triclinic, 12 ≤ n (even) ≤ 26; monoclinic, 28 < n (even) < 36; and orthorhombic, n (even) > 36 and n (odd) [32]. The X-ray pattern of these five n-alkanes are shown in Fig. S1 (Supporting information). For n-octadecane, n-eicosane and n-docosane of even n-alkanes, the XRD patterns presented a series of characteristic diffraction peaks of (010), (011), (100) and (111) reflections of the triclinic crystal [33-35]. The XRD patterns of n-nonadecane and n-heneicosane revealed two main diffraction peaks assigned to the (110) and (020) planes of orthorhombic crystal [36-38]. The difference in crystal structure between odd-numbered and even-numbered n-alkanes is due to the different ways of terminal methyl packing. The end methyl groups of odd n-alkanes pack in the same direction, while the even n-alkanes protrude in opposite directions. For short chains, the terminal methyl-methyl interactions occupy the dominant position of solid-state packing which makes the formation of orthogonal cell difficult and leads to the formation of a unimolecular triclinic lattice. With the increase of chain length, the influence of parallel chain packing interactions is higher than that of interlamellar packing. For odd-numbered n-alkanes, the mirror symmetry of molecules tends to prevent the best close packing and form orthogonal crystals [39, 40]. As the temperature increases, some n-alkanes still have a rotator state between the crystal and the liquid state, which is also called a disordered state. The transition from crystal to rotator state is called order-disorder transition (o-d transition). Among the five n-alkanes studied, n-nonadecane and n-heneicosane and n-docosane all exist o-d transition, while n-octadecane and n-eicosane only have a crystal-liquid phase transition process [41]. The o-d transition may be related to the thermal motion of particles. When the o-d transition temperature (To-d) is reached, the molecules in the crystal begin to vibrate randomly at the equilibrium position. Then with the increase of temperature, the thermal motion becomes more intense and the molecular chains behave thermal torsional motion around their axes, losing the fixed orientation in the structure [42]. Until the temperature reaches the melting point, n-alkanes tends to lose their solid structure and begin to transform into the liquid phase.
The thermal stability evaluation of n-alkanes was performed by the TGA technique. It can be seen from the measured curves in Fig. 1 that n-alkanes of C18-C22 began to decompose in the temperature range of 373–413 K. And as the number of carbon atoms increases, the initial and end decomposition temperature of n-alkanes of C18-C22 increases. The weight loss percentage of n-octadecane, n-nonadecane, n-eicosane, n-heneicosane and n-docosane was 94.76%, 95.16%, 94.66%, 94.95% and 95.33%, respectively. According to these results, it can be determined that n-alkanes are thermally stable in the temperature region below 373 K.

|
Download:
|
| Fig. 1. TG curves of n-alkanes samples. | |
The thermal conductivity of n-alkanes was measured by the transient plane source (TPS) technique, and the obtained data are listed in Table S1 (Supporting information). The thermal conductivity of n-octadecane, n-eicosane and n-docosane at room temperature is close to each other and significantly larger than that of n-nonadecane and n-heneicosane. After measuring the thermal conductivity of n-undecane, n-dodecane and n-tridecane by transient hot wire method, Hans Forsman et al. [43] found that the thermal conductivity of even-numbered n-dodecane was higher than that of adjacent n-undecane and n-dodecane with odd number of carbon atoms. In this study, the same conclusion is reached, that is, the thermal conductivity of even-numbered n-alkanes is higher than that of adjacent odd-numbered n-alkanes. The previous results for these n-alkanes are shown in Table 2 [6, 45-50], and it can be seen that our measured thermal conductivities of n-octadecane, n-nonadecane and n-eicosane in the solid phase are in good agreement with these results. However, the thermal conductivity of crystalline n-heneicosane is rarely reported. In the term of n-docosane, the thermal conductivity values obtained by different measurement techniques are quite different in a relatively close temperature range. Felipe et al. [44] obtained that the thermal conductivity of n-docosane was 0.668 W m−1 K−1 by a C-Therm Technologies TCi Analyzer based on a modified transient plane source (MTPS) method, while Sari and Karaipekli [45] measured the thermal conductivity of n-docosane to be 0.22 W m−1 K−1 by transient hot-wire method. In this work, the thermal conductivity of n-docosane was determined to be 0.4091 W m−1 K−1 by a thermal constants analyser (Hot Disk TPS2500S) based on the TPS method.
|
|
Table 2 Comparison of thermal conductivity data of pure n-alkanes in the solid (crystalline) state. |

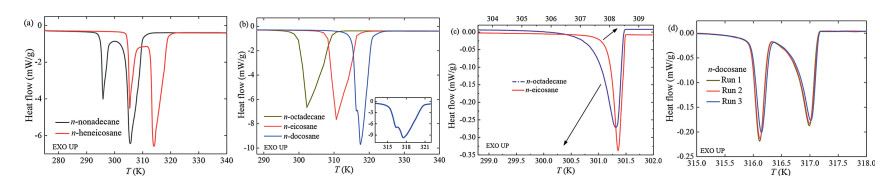
The DSC curve can reflect the phase transition behavior of the materials, including phase transition enthalpy and phase transition temperature. Different n-alkanes have different DSC curve characteristics due to the existence of the rotator phase. For odd-numbered n-alkanes of n-nonadecane and n-heneicosane, there are two endothermic peaks in the DSC curve of the heating run at a rate of 10 K/min corresponding respectively to the o-d transition and solid-liquid transition as shown in Fig. 2a. For even-numbered n-alkanes of n-octadecane, n-eicosane and n-docosane, only one obvious endothermic peak can be obtained in the DSC curve of the heating run at a rate of 10 K/min, moreover, there is a shoulder in the DSC curve of n-docosane as shown in Fig. 2b. It should be noted that the endothermic peak represents the melting peak of n-octadecane and n-eicosane while the endothermic peak includes both the o-d transition and solid-liquid transition of n-docosane. Therefore, the calculated enthalpy value of n-docosane, which agreed well with the sum of phase transition enthalpy from literature, derived from the DSC curve was the total enthalpy value including the o-d transition enthalpy and the melting enthalpy. n-Docosane undergoes the o-d transition from the triclinic crystal to the rotator phase, and then the solid-liquid transition from the rotator phase to the liquid phase. Wang et al. [51] obtained a perfect DSC curve at a heating rate of 0.5 mK/s using a high resolution and super-sensitive DSC in which there were conspicuous o-d transition peak and melting peak. It was obvious from the curve that the onset/end temperature of the o-d transition and the onset melting temperature of the solid-liquid transition was 316.22 K, 316.86 K and 317.25 K, respectively. According to the previous work of Wang et al., n-docosane exists in the rotator phase only within the temperature range of less than 0.5 K, which means the heating rate of 10 K/min may be too fast to obtain the independent o-d transition peak and melting peak for n-docosane. The phase transition properties of n-octadecane, n-eicosane and n-docosane were determined again with a heating rate of 0.5 mK/s and the DSC curves are shown in Figs. 2c and d. It can be seen that there was only one peak for n-octadecane and n-eicosane while two peaks were presented for n-docosane at the slow heating rate of 0.5 mK/s, and these DSC results are consistent with those reported in the literature [41, 51].

|
Download:
|
| Fig. 2. DSC curves of (a) the odd-numbered n-alkanes at heating rate of 10 K/min; (b) the even-numbered n-alkanes at heating rate of 10 K/min; (c) n-octadecane and n-eicosane at heating rate of 0.5 mK/s; (d) n-docosane at heating rate of 0.5 mK/s. | |
For the AC experiment of n-octadecane, the enthalpy of fusion is calculated by subtracting the contribution of the heat capacity of the empty container, and the hypothetic normal heat capacity of crystal and liquid from the total energy input by the heater during the phase change in the temperature range of (T1 to T2) (Eq. 1) [52],

|
(1) |
where QT is the total energy input during the fusion region, QE is the heat absorbed by the empty container, QC and QL are the heat absorbed by crystal and liquid which are calculated by extending the heat capacity baselines derived from heat capacities outside of the phase transition region in the temperature region of (T1 to Tm) and (Tm to T2), respectively, Tm is the melting point, and n is the molar substance amount of a sample. The detailed continuous energy input during the phase transition, the heat capacity contribution from the empty container, crystal and liquid of n-octadecane and the calculated fusion enthalpy were listed in Table S2 (Supporting information). Meanwhile, the triple point temperature can be determined by AC fractional melting experiments based on the Van't Hoff equation (Eq. 2) [53, 54],

|
(2) |
where T0 is the melting point of purity sample; Ti is the temperature during fusion of the measured sample; R is the gas constant; ∆fusHm is the molar enthalpy of fusion; x is the molar fraction of impurity; F is the fraction melted, which means the ratio of the amount of melted sample to the total amount of tested sample. F can also be expressed as Eq. 3,
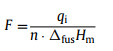
|
(3) |
where qi is the heat absorbed by the sample during the melting process at the temperature Ti.
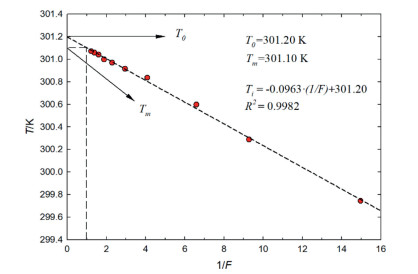
For a certain tested sample, the values of T0, R, ∆fusHm and x are constant, so that Ti is proportional to 1/F, and when 1/F equals 1 and 0, T means the melting point of sample and purity substance, respectively. The results of AC fractional melting experiment are listed in Table S3 (Supporting information) and plotted in Fig. 3. The coefficient of determination R2 is 0.9982, which indicated the good linearity of the melting curve.

|
Download:
|
| Fig. 3. Melting curve (Ti vs. 1/F) of n-octadecane. | |
The detailed data of phase transition properties of n-alkanes from AC experiment and DSC experiments are listed in Table S4 (Supporting information) and the results of comparison with the literature are listed in Table 3 [24, 51, 55-67]. It is concluded that the o-d transition temperature and enthalpy increase with the increasing number of carbon atoms. However, the enthalpy of solid-liquid phase change shows a different changing law as the solid-liquid transition temperature rises with the increase of relative molecular weight. Same as the thermal conductivity rules of n-alkanes, the melting enthalpy of even-numbered n-alkanes is larger than that of adjacent odd-numbered n-alkanes. Additionally, the average total phase transition enthalpy of n-docosane measured at the heating rate of 10 K/min was 78.44 kJ/mol, which agreed well with the sum of o-d transition enthalpy and solid-liquid transition enthalpy from different literature [51, 55-58]. The average total phase transition enthalpy of n-docosane measured at the heating rate of 0.5 mK/s was 73.47 kJ/mol, which was a little lower than the value of literature. Although the n-docosane DSC curves with two separated peaks were obtained in Fig. 2d, the phase transition enthalpy obtained was different from those in the literature likely due to the measurement accuracy of the instrument. Wang et al. [51, 57] performed the phase change properties with a high resolution and super-sensitive DSC constructed by their research group, which could measure at a very slow rate scan rate like 10 µK/s with a baseline stability of ±3 nW. For our DSC with the slowest scan rate of 0.01 K/min, the same heating rate of 0.5 mK/s as Wang et al. is relatively difficult to control because the temperature dropped on the baseline during the heating measurement. Moreover, the baseline fluctuation was nearly 6 µW, much larger than the baseline stability of the DSC used by Wang. Based on the above two reasons, there may be a difference between the measured phase transition enthalpy of n-docosane and the literature value.
|
|
Table 3 Comparison of transition properties of n-alkanes between this work and the previous results. |
The molar heat capacities of n-alkanes measured by AC and PPMS are listed in Tables S5 and S6 (Supporting information), respectively, and plotted against the temperature from 0 to 300 K in Fig. 4. It can be seen that at the temperature below 300 K, the heat capacities of five n-alkanes increase with the temperature increasing, and no obvious thermal anomaly phenomenon or phase transition is observed. The heat capacity of n-octadecane at 227.70 K deviated a little from the normal heat capacity increase trend. The reason may be caused by the measurement error, and consequently this abnormal value is not used in the fitting heat capacity curve and the calculation of the corresponding thermodynamic functions. At the temperature of about 260 K, the heat capacity curve of n-nonadecane crosses with that of n-eicosane. In the temperature range of 260–300 K, the heat capacity of n-nonadecane is larger than that of n-eicosane, which is consistent with the experimental results of Van Miltenburg et al. [68]. This cross phenomenon may be due to the entry of n-nonadecane into the pre-melting temperature region.

|
Download:
|
| Fig. 4. Plot of the experimental heat capacities of n-alkanes measured with AC and PPMS. | |
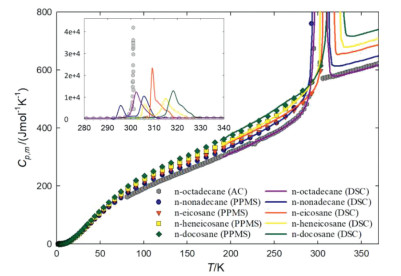
In order to study the thermal properties and calculate the thermodynamic functions above 300 K, the heat capacities of n-alkanes were measured using DSC in the temperature range of 190–370 K. The heat capacity results from DSC, PPMS and AC are shown in Fig. 5. It can be seen from the heat capacity curves that the molar heat capacities of n-alkanes increase with the increasing molecular weight of n-alkanes in the liquid phase. Moreover, the phase transition behavior such as o-d transition and solid-liquid transition in Fig. 5 corresponds well to the heat flow curves in the DSC measurements.

|
Download:
|
| Fig. 5. Plot of the experimental heat capacities of n-alkanes from AC, PPMS and DSC measurements. | |
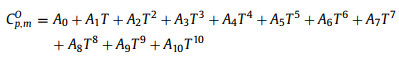
For the calculation of thermodynamic functions, a set of theoretical and empirical models were used to fit the experimental heat capacity data. In the low temperature region (T < 10 K), a harmonic lattice model was used to fit the low temperature heat capacities (Eq. 4) [25, 69],

|
(4) |
where the odd power terms in temperature represent the contribution from the lattice vibration, and this model may extrapolate the heat capacity to 0 K to calculate the third law entropy [26]. In the temperature region above 10 K without phase transition, the heat capacities of the n-alkanes were fitted to the following orthogonal polynomial function, while the data in the phase transition region were fitted using a spline fitting method (Eq. 5) [25],
|
(5) |
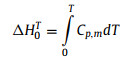
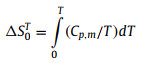
The fitting parameters, temperature regions and the corresponding percent mean-square fitting deviations (%RMS) are listed in Tables S7 and S8 (Supporting information). All curve fitting %RMS are much smaller than the heat capacity uncertainties of ±3% from T = 1.9–20 K and ±1% from T = 20–300 K, which indicates that these fits can represent the heat capacity data well. Based on these heat capacity fitting parameters, the thermodynamic functions of n-alkanes have been derived using the thermodynamic Eqs. 6 and 7 in the temperature range from 0 K to 370 K, and the calculated results are presented in Table S9 (Supporting information). Since n-octadecane and n-hexadecane begin to enter the phase transition region at near 298.15 K and 0.1 MPa, the standard molar heat capacity, enthalpy and entropy under this condition are extremely large due to the latent heat of phase transition. Therefore, the standard molar heat capacity, enthalpy and entropy at 273.15 K and 0.1 MPa were provided for all n-alkanes samples. The standard molar heat capacity, entropy and enthalpy at 273.15 K and 0.1 MPa were determined to be Cp, mo = (428.066 ± 4.28) J K−1 mol−1, Smo = (324.412 ± 3.24) J K−1 mol−1 and Hmo = (55.8122 ± 0.558) kJ/mol for n-octadecane; Cp, mo = (463.925± 4.64) J K−1 mol−1, Smo = (467.791 ± 4.68) J K−1 mol−1 and Hmo = (65.8221 ± 0.658) kJ/mol for n-nonadecane; Cp, mo = (469.718 ± 4.70) J K−1 mol−1, Smo = (480.386 ± 4.80) J K−1 mol−1 and Hmo = (67.2148 ± 0.672) kJ/mol for n-eicosane; Cp, mo = (488.907 ± 4.89) J K−1 mol−1, Smo = (500.013 ± 5.00) J K−1 mol−1 and Hmo = (70.2356 ± 0.702) kJ/mol for n-heneicosane; Cp, mo = (503.581 ± 5.04) J K−1 mol−1, Smo = (523.975 ± 5.24) J K−1 mol−1 and Hmo = (73.3775 ± 0.734) kJ/mol for n-docosane.
|
(6) |
|
(7) |
The data on the heat capacity of previously reported alkanes were compared with that of this study and plotted in Fig. 6. For solid-phase n-octadecane, the deviations of our AC data from those of Messerly et al. [24] and Parks et al. [60] are respectively within −2.5% to 2.2% in the temperature range of 80–280 K and −0.8% to 2.7% in the temperature range of 80–270 K except for the deviation at 230 K; the deviations of our DSC data from those of Messerly et al. [24] and Parks et al. [60] are respectively within −1.3% to 1.9% in the temperature range of 193–278 K and −1.4% to 2.9% in the temperature range of 190–270 K except for the deviation at 230 K. The reason for the large deviation between the data of AC/DSC and the value of Parks et al. is that the heat capacity data at 230 K from Parks et al. is obviously larger than the overall trend of heat capacity. For liquid-phase n-octadecane, the deviations of our AC data from those of Messerly et al. [24] and Miltenburg [70] are respectively within 0.1% to 0.8% in the temperature range of 304–388 K and −0.2% to 0.4% in the temperature range of 307–371 K, and the deviations of our DSC data from those of Messerly et al. [24] and Miltenburg [70] are respectively within −0.3% to 0.2% in the temperature range of 318–379 K and −0.5% to 0.7% in the temperature range of 323–371 K.

|
Download:
|
| Fig. 6. Comparison/deviations of measured AC, PPMS and DSC heat capacities with/from those reported in literatures [21, 22, 24, 60, 68, 70-72]. ● denotes the reference data obtained from experiments, ▲ denotes the reference data obtained from fitting heat capacity experiments data to a polynomial function, ♦ denotes the reference data calculated from a polynomial function obtained by group contribution method. | |
For solid-phase n-nonadecane, the deviations of our PPMS data from those of Miltenburg et al. [68] and Vélez et al. [21] are respectively within ±2% in the temperature range of 14–281 K and −0.2% to 3.3% in the temperature range of 265–280 K, especially the deviations of our PPMS data from those of Miltenburg et al. [68] in the temperature range of 20–260 K are within ±0.5% the deviations of our DSC data from those of Miltenburg et al. [68] and Vélez et al. [21] are respectively within −0.5% to 1.1% in the temperature range of 191–281 K and −3.1% to 4.0% in the temperature range of 265–280 K. For liquid-phase n-nonadecane, the deviations of our DSC data from those of Miltenburg et al. [68] and Vélez et al. [21] are respectively within −0.2% to 1.1% in the temperature range of 321–372 K and −0.5% to 0.4% in the temperature range of 316–334 K. The deviation of our DSC data from that of Grigor'ev and Andolenko [71] is 3.5% at 313.15 K, due to the sample still in phase transition at that temperature. Moreover, Atkinson et al. [72] measured a series of n-alkanes include n-nonadecane and n-docosane by AC and then obtained liquid n-alkanes heat capacity fitting equations. The deviations of our DSC data from the fitting equation of n-nonadecane are within −0.9% to 0.4% in the temperature range of 321–372 K.
For solid-phase n-eicosane, the deviations of our PPMS and DSC data from those of Miltenburg et al. [68] are respectively within −1.2% to 1.1% in the temperature range of 16–281 K and 1.7% to 2.5% in the temperature range of 192–285 K. For liquid-phase n-eicosane, the deviations of our DSC data from those of Miltenburg et al. [68] are within −0.5% to 0.7% in the temperature range of 326–370 K.
For n-heneicosane and n-docosane, few experimental data in the range of 0–370 K can be found for direct comparison. For liquid-phase n-heneicosane, the heat capacity at 315.93 K determined by Grigor'ev and Andolenko [72] was 666.4 J K−1 mol−1, while the sample was still in the solid-liquid transition process at the same temperature. For liquid-phase n-docosane, the deviations of our DSC data from the fitting equation of n-docosane [71] are within −2.4% to 0.3% in the temperature range of 330–370 K. Taking previous publications including the work of Atkinson et al. into account, Miltenburg [70] fitted a heat capacity function applicable to liquid n-alkanes from C5H12 to C26H54 with a 0.18% average percentage deviation, which was used to calculate the deviation between our DSC data and fitted data. It can be found that the deviations of our DSC data for liquid n-heneicosane and n-docosane from those of Miltenburg [70] are respectively within 0 to 2.3% in the temperature range of 329–370 K and −2.5% to 0.3% in the temperature range of 333–370 K. For both n-heneicosane and n-docosane, the deviation decreases with the temperature rising and then tends to flatten to around −2.5% gradually. In short, except for the pre-melting temperature region and individual temperature points, the heat capacities of these five n-alkanes have a deviation of no more than 2.5% from the heat capacity data in the literature, and the DSC heat capacity curves are in good agreement with the AC or PPMS heat capacity data. Therefore, it can be pointed out that our heat capacity data of n-alkanes are accurate, and it is recommended to use our measured data for the related PCMs study of n-alkanes.
In summary, the solid structure, thermal stability, thermal conductivity, phase transition temperature, phase transition enthalpy and heat capacity of n-alkanes have been studied using different analysis method, and these newly measured thermal properties have been compared with those reported in literature. In addition, the heat capacities were measured using a combination of AC/PPMS and DSC calorimetric methods in the temperature range of 1.9–370 K and the corresponding thermodynamic functions of n-alkanes were derived from the heat capacity curve fitting. The standard molar heat capacity, entropy and enthalpy were determined. Most importantly, the heat capacities and related thermodynamic functions of n-heneicosane and n-docosane have been reported for the first time in this work, as far as we know. This research work would provide accurate and reliable thermal properties for further study of n-alkanes as PCMs for the material development and related thermal energy storage system design and construction.
Declaration of competing interestThe authors declare that they have no known competing financial interests or personal relationships that could have appeared to influence the work reported in this paper.
AcknowledgmentsThe authors gratefully acknowledge the financial support from the National Nature Science Foundation of China (No. 22003065), Liaoning Provincial Natural Science Foundation of China (No. 2019-MS-318), Science and Technology Major Project of Liaoning Province (No. 2019JH1/10300002), the Scientific Instrument Developing Project of the Chinese Academy of Sciences (No. YJKYYQ20190046) and Dalian Institute of Chemical Physics (No. DICP I202036). Q. Shi would like to thank Dalian Outstanding Young Scientific Talent Program (No. 2019RJ10).
Supplementary materialsSupplementary material associated with this article can be found, in the online version, at doi:10.1016/j.cclet.2021.05.017.
| [1] |
S.N. Gunasekara, V. Martin, J.N. Chiu, Renew. Sust. Energ. Rev. 73 (2017) 558-581. DOI:10.1016/j.rser.2017.01.108 |
| [2] |
P.B.L. Chaurasia, Res. Ind. 26 (1981) 159-161. |
| [3] |
M.L. Nuckols, O. Eng. 26 (1999) 547-564. DOI:10.1016/S0029-8018(98)00001-8 |
| [4] |
S. Himran, A. Suwono, G.A. Mansoori, Energ. Source. 16 (1994) 117-128. DOI:10.1080/00908319408909065 |
| [5] |
H.Z. Zhang, X.D. Wang, D.Z. Wu, J. Colloid. Interface Sci. 343 (2010) 246-255. DOI:10.1016/j.jcis.2009.11.036 |
| [6] |
X. Fang, L.W. Fan, Q. Ding, et al., Energy Fuel 27 (2013) 4041-4047. DOI:10.1021/ef400702a |
| [7] |
X.X. Zhang, Y.F. Fan, X.M. Tao, K.L. Yick, Mater. Chem. Phys. 88 (2004) 300-307. DOI:10.1016/j.matchemphys.2004.06.043 |
| [8] |
B. Zalba, J.M. Marin, L.F. Cabeza, H. Mehling, Appl. Therm. Eng. 23 (2003) 251-283. DOI:10.1016/S1359-4311(02)00192-8 |
| [9] |
W.G. Su, J. Darkwa, G. Kokogiannakis, Renew. Sust. Energ. Rev. 48 (2015) 373-391. DOI:10.1016/j.rser.2015.04.044 |
| [10] |
M. Delgado, A. Lazaro, J. Mazo, B. Zalba, Renew. Sust. Energ. Rev. 16 (2012) 253-273. DOI:10.1016/j.rser.2011.07.152 |
| [11] |
M.S. Romero-Cano, B. Vincent, J. Control. Release 82 (2002) 127-135. DOI:10.1016/S0168-3659(02)00130-X |
| [12] |
E.Y. Kim, H. Do Kim, J. Appl. Polym. Sci. 96 (2005) 1596-1604. DOI:10.1002/app.21603 |
| [13] |
W. Frere, L. Danicher, P. Gramain, Eur. Polym. J. 34 (1998) 193-199. DOI:10.1016/S0014-3057(97)00084-0 |
| [14] |
Y. Shin, D.I. Yoo, K. Son, J. Appl. Polym. Sci. 97 (2005) 910-915. DOI:10.1002/app.21846 |
| [15] |
X.X. Zhang, Y.F. Fan, X.M. Tao, K.L. Yick, J. Colloid. Interface Sci. 281 (2005) 299-306. DOI:10.1016/j.jcis.2004.08.046 |
| [16] |
J.F. Su, L.X. Wang, L. Ren, J. Appl. Polym. Sci. 101 (2006) 1522-1528. DOI:10.1002/app.23151 |
| [17] |
X.X. Zhang, X.M. Tao, K.L. Yick, Y.F. Fan, J. Appl. Polym. Sci. 97 (2005) 390-396. DOI:10.1002/app.21760 |
| [18] |
Z.G. Jin, Y.D. Wang, J.G. Liu, Z.Z. Yang, Polymer 49 (2008) 2903-2910. DOI:10.1016/j.polymer.2008.04.030 |
| [19] |
Y.H. Tseng, M.H. Fang, P.S. Tsai, Y.M. Yang, J. Microencapsul. 22 (2005) 37-46. DOI:10.1080/02652040400026558 |
| [20] |
C. Velez, M. Khayet, J.M.O. de Zarate, Appl. Energ. 143 (2015) 383-394. DOI:10.1016/j.apenergy.2015.01.054 |
| [21] |
C. Velez, J.M. Ortiz de Zarate, M. Khayet, Int. J. Therm. Sci. 94 (2015) 139-146. DOI:10.1016/j.ijthermalsci.2015.03.001 |
| [22] |
N. Durupt, A. Aoulmi, M. Bouroukba, M. Rogalski, Thermochim. Acta 274 (1996) 73-80. DOI:10.1016/0040-6031(95)02255-4 |
| [23] |
M. Faden, S. Hoehlein, J. Wanner, A. Koenig-Haagen, D. Brueggemann, Materials 12 (2019) 2974. DOI:10.3390/ma12182974 |
| [24] |
J.F. Messerly, G.B. Guthrie, S.S. Todd, H.L. Finke, J. Chem. Eng. Data 12 (1967) 338-346. DOI:10.1021/je60034a014 |
| [25] |
R. Jia, K. Sun, R. Li, et al., J. Chem. Thermodyn. 115 (2017) 233-248. DOI:10.1016/j.jct.2017.08.004 |
| [26] |
Y. Kou, S. Wang, J. Luo, et al., J. Chem. Thermodyn. 128 (2019) 259-274. DOI:10.1016/j.jct.2018.08.031 |
| [27] |
R. Dai, S. Zhang, N. Yin, Z.C. Tan, Q. Shi, J. Chem. Thermodyn. 92 (2016) 60-65. DOI:10.1016/j.jct.2015.08.031 |
| [28] |
Q. Shi, J. Boerio-Goates, B.F. Woodfield, J. Chem. Thermodyn. 43 (2011) 1263-1269. DOI:10.1016/j.jct.2011.03.018 |
| [29] |
Q. Shi, C.L. Snow, J. Boerio-Goates, B.F. Woodfield, J. Chem. Thermodyn. 42 (2010) 1107-1115. DOI:10.1016/j.jct.2010.04.008 |
| [30] |
Q. Shi, Z. Tan, N. Yin, Chin. Sci. Bull. 61 (2016) 3100-3114. DOI:10.1360/N972016-00550 |
| [31] |
Z.C. Tan, Q. Shi, B.P. Liu, H.T. Zhang, J. Therm. Anal. Calorim. 92 (2008) 367-374. DOI:10.1007/s10973-007-8954-2 |
| [32] |
A.M. Taggart, F. Voogt, G. Clydesdale, K.J. Roberts, Langmuir 12 (1996) 5722-5728. DOI:10.1021/la9600816 |
| [33] |
B. Xie, G. Liu, S. Jiang, Y. Zhao, D. Wang, J. Phys. Chem. B 112 (2008) 13310-13315. DOI:10.1021/jp712160k |
| [34] |
D. Fu, Y. Liu, Y. Su, G. Liu, D. Wang, J. Phys. Chem. B 115 (2011) 4632-4638. DOI:10.1021/jp2004248 |
| [35] |
D. Fu, Y. Su, B. Xie, et al., Phys. Chem. Chem. Phys. 13 (2011) 2021-2026. DOI:10.1039/c0cp01173h |
| [36] |
J.E. Baldvins, R.G. Weiss, Liq. Cryst. 26 (1999) 897-912. DOI:10.1080/026782999204598 |
| [37] |
H. Li, X. Liu, G. Fang, Energy Build. 42 (2010) 1661-1665. DOI:10.1016/j.enbuild.2010.04.009 |
| [38] |
K. Nozaki, N. Higashitani, T. Yamamoto, T. Hara, J. Chem. Phys. 103 (1995) 5762-5766. DOI:10.1063/1.470456 |
| [39] |
S.R. Craig, G.P. Hastie, K.J. Roberts, J. Mater. Sci. Lett. 15 (1996) 1193-1196. DOI:10.1007/BF00274373 |
| [40] |
S.R. Craig, G.P. Hastie, K.J. Roberts, J.N. Sherwood, J. Mater. Chem. 4 (1994) 977-981. DOI:10.1039/jm9940400977 |
| [41] |
A.J. Briard, M. Bouroukba, D. Petitjean, N. Hubert, M. Dirand, J. Chem. Eng. Data 48 (2003) 497-513. DOI:10.1021/je0201368 |
| [42] |
S.Y. Chazhengina, E.N. Kotelnikova, I.V. Filippova, S.K. Filatov, J. Mol. Struct. 647 (2003) 243-257. DOI:10.1016/S0022-2860(02)00531-8 |
| [43] |
H. Forsman, P. Andersson, Mol. Phys. 58 (1986) 605-610. DOI:10.1080/00268978600101401 |
| [44] |
F.P. Fleming, L.D.A. Silva, G.D.S. Vieira Lima, et al., Fluid Phase Equilib. 477 (2018) 78-86. DOI:10.1016/j.fluid.2018.08.016 |
| [45] |
A. Sari, A. Karaipekli, Appl. Therm. Eng. 27 (2007) 1271-1277. DOI:10.1016/j.applthermaleng.2006.11.004 |
| [46] |
S. Drissi, T.C. Ling, K.H. Mo, Thermochim. Acta 673 (2019) 198-210. DOI:10.1016/j.tca.2019.01.020 |
| [47] |
R. Holmen, M. Lamvik, O. Melhus, Int. J. Thermophys. 23 (2002) 27-39. DOI:10.1023/A:1013988507251 |
| [48] |
Q. Zhang, C. Liu, Z. Rao, ChemistrySel. 4 (2019) 8482-8492. DOI:10.1002/slct.201901436 |
| [49] |
C. Lin, Z. Rao, Appl. Therm. Eng. 110 (2017) 1411-1419. DOI:10.1016/j.applthermaleng.2016.09.065 |
| [50] |
P.C. Stryker, E.M. Sparrow, Int. J. Heat Mass Transf. 33 (1990) 1781-1793. DOI:10.1016/0017-9310(90)90212-D |
| [51] |
S.L. Wang, K. Tozaki, H. Hayashi, S. Hosaka, H. Inaba, Thermochim. Acta 408 (2003) 31-38. DOI:10.1016/S0040-6031(03)00312-5 |
| [52] |
E.S. Tkachenko, R.M. Varushchenko, A.I. Druzhinina, M.D. Reshetova, N.E. Borisova, J. Chem. Eng. Data 56 (2011) 4700-4709. DOI:10.1021/je200673a |
| [53] |
R. Reubke, J.A. Mollica, J. Pharm. Sci. 56 (1967) 822-825. DOI:10.1002/jps.2600560706 |
| [54] |
H. Wang, J. Li, G. Sun, K. Ma, Q. Zhang, Synth. Met. 159 (2009) 162-165. DOI:10.1016/j.synthmet.2008.06.006 |
| [55] |
D. Mondieig, F. Rajabalee, V. Metivaud, H.A.J. Oonk, M.A. Cuevas-Diarte, Chem. Mater. 16 (2004) 786-798. DOI:10.1021/cm031169p |
| [56] |
E.S. Domalski, E.D. Hearing, J. Phys. Chem. Ref. Data 25 (1996) 1-525. DOI:10.1063/1.555985 |
| [57] |
S. Wang, K.I. Tozaki, H. Hayashi, H. Inaba, Thermochim. Acta 571 (2013) 8-14. DOI:10.1016/j.tca.2013.08.001 |
| [58] |
A.A. Schaerer, C.J. Busso, A.E. Smith, L.B. Skinner, J. Am. Chem. Soc. 77 (1955) 2017-2019. |
| [59] |
S.I. Kolesnikov, Z.I. Syunyaev, J. Appl. Chem. USSR 58 (1985) 2097-2101. |
| [60] |
G.S. Parks, G.E. Moore, M.L. Renquist, et al., J. Am. Chem. Soc. 71 (1949) 3386-3389. DOI:10.1021/ja01178a034 |
| [61] |
M. Maroncelli, S.P. Qi, H.L. Strauss, R.G. Snyder, J. Am. Chem. Soc. 104 (1982) 6237-6247. DOI:10.1021/ja00387a013 |
| [62] |
M.G. Broadhurst, J. Res. Natl. Bur. Stand. A: Phys. Chem. 66 (1962) 241. |
| [63] |
J.C. Company, Chem. Eng. Sci. 28 (1973) 318-323. DOI:10.1016/0009-2509(73)85117-6 |
| [64] |
K. Khimeche, Y. Boumrah, M. Benziane, A. Dahmani, Thermochim. Acta 444 (2006) 166-172. DOI:10.1016/j.tca.2006.03.011 |
| [65] |
G.S. Parks, H.M. Huffman, S.B. Thomas, J. Am. Chem. Soc. 52 (1930) 1032-1041. DOI:10.1021/ja01366a030 |
| [66] |
P. Barbillon, L. Schuffenecker, J. Dellacherie, D. Balesdent, M. Dirand, ChemPhysChem 88 (1991) 91-113. |
| [67] |
M. Maroncelli, H.L. Strauss, R.G. Snyder, J. Phys. Chem. 89 (1985) 5260-5267. DOI:10.1021/j100270a028 |
| [68] |
J.C. van Miltenburg, H.A.J. Oonk, V. Metivaud, J. Chem. Eng. Data 44 (1999) 715-720. DOI:10.1021/je980231+ |
| [69] |
Q. Shi, L. Zhang, M.E. Schlesinger, J. Boerio-Goates, B.F. Woodfield, J. Chem. Thermodyn. 62 (2013) 86-91. DOI:10.1016/j.jct.2013.02.023 |
| [70] |
J.C. van Miltenburg, Thermochim. Acta 343 (2000) 57-62. DOI:10.1016/S0040-6031(99)00373-1 |
| [71] |
B.A. Grigor'ev, R.A. Andolenko, Izv. Vyssh. Ucheb. Zaved., Neft i Gaz 2 (1984) 60-62. |
| [72] |
C.M.L. Atkinson, J.A. Larkin, M.J. Richardson, J. Chem. Thermodyn. 1 (1969) 435-440. DOI:10.1016/0021-9614(69)90002-0 |