 2021, Vol. 32


b High Magnetic Field Laboratory, Hefei Institutes of Physical Science, Chinese Academy of Sciences, Hefei 230031, China;
c CAS Key Laboratory of Soft Matter Chemistry, Department of Polymer Science and Engineering, University of Science and Technology of China, Hefei 230601, China;
d Ioffe Institute, Russian Academy of Sciences, St. Petersburg 194021, Russian Federation
Carbon dots (CDs), as one of the most promising carbon-based nanomaterials with an excellent photoluminescent property, high photostability and extremely low toxicity, have potential applications in bioimaging, information encryption, photocatalysis, sensors, optoelectronic devices, and so on [1-7]. However, similar to many organic fluorophores, the fluorescence of CDs is often quenched in solid state or at aggregated state due to the aggregation-caused quenching (ACQ) effect, which greatly limits the practical applications of CDs in solid-state [8, 9]. Since Tang and his co-workers first found the aggregation-induced emission (AIE) phenomenon in a certain organic chromophores [10, 11], a booming reports on AIE dots have been published in the past decade, but solid-state fluorescence (SSF) of CDs, particularly red-emissive SSF-CDs were seldom reported. Recently, Chen et al. introduced poly(vinyl alcohol) onto CDs to restrict the π-π interaction between graphitic cores and thus achieved a yellow-greenish SSF of the CDs [12]. Yang and his co-workers proposed that the SSF-CDs might be caused by supramolecular cross-linking between adjacent particles [13, 14]. More Recently, Yang et al. reported an interesting red AIE of CDs in the solid-state through restriction of the hydrophobic disulfide bonds rotation in the CDs and thus reducing the non-radiative transition [15]. So far, synthesis of SSF-CDs with a longer wavelength emission in deep-red to near infrared (NIR) region is still a great challenge, and how to prevent ACQ of CDs in solid-state has not been made clear yet.
Heteroatoms doping (e.g., nitrogen (N), sulfur (S), boron (B) phosphorus (P), fluorine (F)) is one of the most commonly used methods to tune the optical properties of CDs [16-18]. Among them, F-doping has become a general strategy to regulate the surface electronic state and conformation on the CDs, due to the greatest electronegativity of F atoms and the highly polarized nature of C-Fx bonds [19-22]. Several recent reports on F-doped CDs all show large absorption and emission red-shifts that can be used for in vivo bioimaging [23, 24]. Notably, the N-CDs-F in a donor-π-accepter conjugated structure showed strong absorption & emission in deep red to NIR region, which can be attributed to the reduced gap between Highest Occupied Molecular Orbital (HOMO) and Lowest Unoccupied Molecular Orbital (LUMO) levels for the N-CDs-F [25]. This result agrees well with the Density Functional Theory (DFT) calculation of F, N co-doped carbon microspheres by Zhou et al., they found that F atoms can induce redistribution of charges of N atoms and then reduce the HOMO-LUMO gap [26]. Unfortunately, all of the above-mentioned F-doped CDs or F, N co-doped CDs showed no SSF, although they displayed bright fluorescence in solution state.
In this work, we report the synthesis of a novel kind of red-emissive SSF-CDs (λem = 676 nm) by F, N and S co-doping through a facile, one-pot solvothermal approach. The yielded F, N, S-CDs show bright fluorescence in both solid-state and solution state. However, the control sample without F-doping (N, S-CDs) shows no SSF at all. Hence, the key role that F-defectson played in facilitating the SSF of CDs is investigated. More interestingly, the SSF of F, N, S-CDs presents an unique temperature-sensitive behavior (80-420 K), showing the maximum fluorescence intensity at 120 K. Besides, the F, N, S-CDs show a "chameleon-like" phenomenon in mixed solvents of H2O/dimethyl sulfoxide (DMSO).
As shown in Scheme 1, the F, N, S-CDs were synthesized by a simple one-pot solvothermal method at 180 ℃, using DMSO as the solvent, citric acid (CA) as the carbon source and 3-fluoroaniline as the F and N doping source. Obviously, the F, N, S-CDs show a red fluorescence in the solid-state while a yellow fluorescence in the solution-state. In contrast, the control sample (N, S-CDs) synthesized via replacing 3-fluoroaniline by aniline, show no SSF at all but a green fluorescence in the solution-state.

|
Download:
|
| Scheme 1. Schematic diagram of the synthesis procedures and optical properties of F, N, S-CDs and N, S-CDs. | |
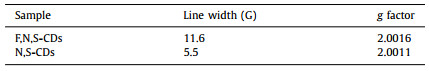
A typical TEM image (Fig. 1a) of the as-synthesized F, N, S-CDs and the corresponding size distribution histogram show that the F, N, S-CDs are mono-dispersed with an average size of 5.72 nm. Fig. 1b shows a high-resolution TEM (HRTEM) image of an individual F, N, S-CD, which reveals the high crystallinity of the carbon core. The spacing of lattice fringe is 0.204 nm, which corresponds to the (100) plane of graphite carbon [27-29]. Compared with the F, N, S-CDs, the N, S-CDs have a smaller average size (2.69 nm), as demonstrated in Fig. S1 (Supporting information). Besides, we found that with the addition of poor solvent H2O into the tetrahydrofuran (THF) solution containing the F, N, S-CDs, an aggregation phenomenon occurred. When the volume ratio of THF to H2O is 1:1, as shown in Fig. 1c, the tiny F, N, S-CDs will aggregate into larger spherical particles with an average size of 64 nm. While further increasing the proportion of H2O to 1:9, the F, N, S-CDs will aggregate more severely and then crosslink with each other to form a network-like structure (Fig. 1d). Attractively, the photographs in Fig. 1e show (fw from 0 to 95%) under 365 nm UV irradiation (the lower row). The corresponding photoluminescence (PL) spectra (Fig. S2 in Supporting information) confirm that with the increase of H2O fraction in the mixed solvents of H2O/DMSO, the original peak at 550 nm gradually decreases, while the peak at 663 nm has no obvious change. This interesting "smart" AIE phenomenon during the aggregation process may be due to the fluorescence emission (550 nm) from the carbon core or surface states (oxygen- and nitrogen-containing functional groups) of CDs being quenched, while the emission peak of 663 nm caused by F doping can resist self-quenching effect.

|
Download:
|
| Fig. 1. (a) TEM image (inset: the corresponding particle size distribution histogram) and (b) HR-TEM of F, N, S-CDs in THF; TEM image of F, N, S-CDs in the THF/H2O mixtures with volume ratios of (c) 1:1 and (d) 1:9. (e) Photographs of the F, N, S-CDs in H2O/DMSO mixtures with different H2O fractions (fw = 0−95%) taken under sunlight (upper row) and 365 nm UV irradiation (lower row). | |
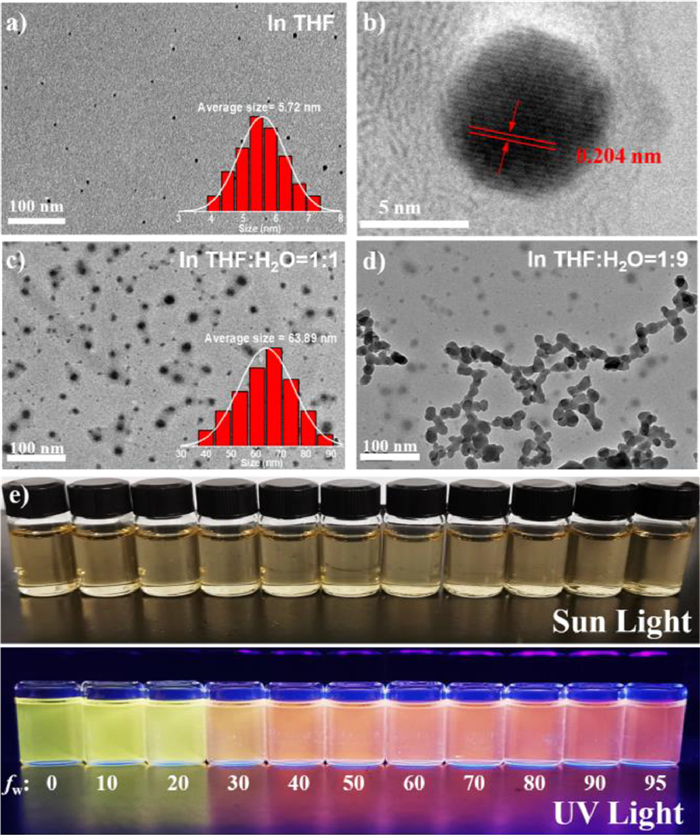
Figs. 2a and b show the Raman spectra of the F, N, S-CDs and the N, S-CDs under 532 nm excitation, respectively, where two prominent bands at 1390 cm−1 (D band) and 1602 cm−1 (G band) are observed. The intensity ratio of D band to G band (ID/IG) is a common method to determine the structural changes of graphitic crystalline domains (sp2-hybridized carbon atoms) and disordered domains (sp3-hybridized or amorphous carbon) in CDs [30]. Here, a much higher ID/IG ratio (0.992) for the F, N, S-CDs than that for the N, S-CDs (0.481) indicates an increased content of disordered carbon domains and defects in the former due to F-doping. In addition, we have fitted another A band in the Raman spectra of CDs, which is based on sp2 point defects, especially non-hexagonal rings [31, 32]. The appearance of A band indicates that some five or seven-membered carbon ring defects have been generated in the carbon core during the synthesis of CDs. Compared with that of N, S-CDs, the intensity ratio of A band to G band (IA/IG) of F, N, S-CDs has no obvious change, revealing that the more disordered structure or defects caused by F-doping mainly locate on the surface of F, N, S-CDs, and thus have not affected the carbon cores. Additionally, the broadened XRD pattern of the F, N, S-CDs (Fig. S3 in Supporting information) than that of the N, S-CDs suggests a poorer crystallinity, which is in accordance with the result of Raman spectra analysis [33, 34].

|
Download:
|
| Fig. 2. Raman spectra of (a) F, N, S-CDs and (b) N, S-CDs (λex = 532 nm). (c) FTIR spectra and (d) 19F NMR spectra of the F, N, S-CDs and the N, S-CDs. | |
The surface groups and chemical compositions of the F, N, S-CDs and N, S-CDs are identified by Fourier transform infrared (FT-IR), X-ray photoelectron (XPS) and 19F NMR. As shown in Fig. 2c, the FT-IR spectra indicate the presences of N-H/O-H (3012-3680 cm−1), C=O/C=N (1693 cm−1), C-N (1474 cm−1) and C-S (1173 cm−1) bonds in both samples [35, 36], except an unique vibration peak of C-F bond (1242 cm−1) present in the F, N, S-CDs [25, 37]. Furthermore, Fig. 2d shows the 19F NMR spectra of the F, N, S-CDs and N, S-CDs in deuterated DMSO. Obviously, there are three chemical shifts in the range of −110 to −120 ppm for the sample of F, N, S-CDs, which might be attributed to the C-F bonds [38, 39] linked with carbon atoms at different chemical environments, such as i) the six-member carbon ring derived from the 3-fluoroaniline residue group containing aniline-N, ii) the graphitic carbon core, and iii) the five-member ring containing pyrrolic-N. In contrast, the 19F NMR spectrum of the N, S-CDs shows no trace of F at all. More evidently, as shown in Fig. S4 (Supporting information), the water contact angles of the solid samples of F, N, S-CDs and N, S-CDs are 99.5° and 49.5°, respectively. This result further confirms the existence of hydrophobic C-F bonds on the surface of F, N, S-CDs, which increases the surface hydrophobicity remarkably [40].
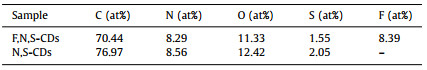
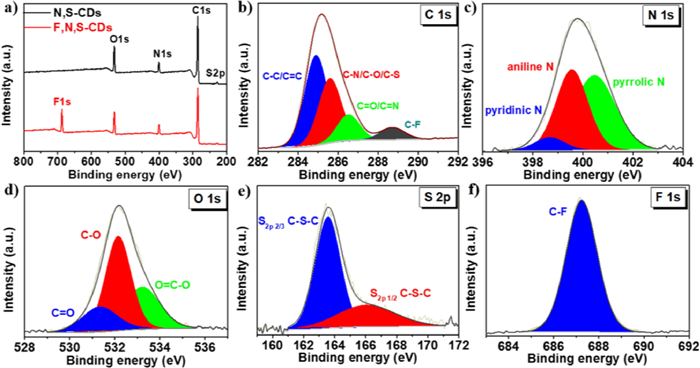
Next, the full-survey XPS spectra (Fig. 3a) confirm the existence of F element in the sample of F, N, S-CDs whereas the absence of F in the sample of N, S-CDs. Correspondingly, Table 1 lists the main elements and their atomic ratios in both samples collected from their XPS data. It shows that the sample of F, N, S-CDs is mainly consisted of C (70.44%, atomic percentage), N (8.29%), O (11.33%), S (1.56%) and F (8.39%). Notably, the atomic ratio of F: N is still approaching to 1:1, originated from the source material of 3-fluoroaniline. In addition, the high-resolution XPS spectrum of C 1s (Fig. 3b) shows four peaks at 284.8, 285.5, 286.7, and 288.6 eV, which can be assigned for C-C/C=C, C-N/C-O/C-S, C=O/C=N, and C-F bonds, respectively [41, 42]. The N 1s spectrum (Fig. 3c) can be de-convoluted into three parts such as pyridinic-N (398.6 eV), aniline-N (399.5 eV) and pyrrolic-N (400.5 eV) peaks [43]. The spectrum of O 1s can be de-convoluted into three peaks at 531.3 532.1 and 533.2 eV, ascribed to C=O, C-O and O=C-O, respectively (Fig. 3d) [44]. The high-resolution spectrum of S 2p (Fig. 3e) reveals the presence of C-S-C bond, which is due to the participation of solvent DMSO in the formation of CDs [41]. Particularly, the high-resolution spectrum of F 1s (Fig. 3f) shows a typical signal of the C-F bond (686.3 eV) [26, 37, 45]. As a control, the XPS high-resolution C 1s, N 1s, O 1s and S 2p spectra of the N, S-CDs are also shown in Figs. S5a-d (Supporting information). the N 1s spectra of the F, N, S-CDs and N, S-CDs show the presence of large proportion of aniline-N in both samples, but derived from 3-fluoroaniline and aniline, respectively.

|
Download:
|
| Fig. 3. (a) XPS survey spectra of the F, N, S-CDs and the N, S-CDs. XPS high-resolution (b) C 1s, (c) N 1s, (d) O 1s, (e) S 2p and (f) F 1s spectra of the F, N, S-CDs. | |
|
|
Table 1 Chemical compositions of the F, N, S-CDs and N, S-CDs (collected from XPS data). |
Considering the XPS results such as the high content of F and N, the atomic ratio of F: N (1:1) and the presence of C-F bond, it can be deduced that a large amount of 3-fluoroaniline residues remain on the surface of F, N, S-CD. However, in comparison to the N 1s spectrum of the N, S-CDs, it can be found that the proportion of pyrrolic-N is significantly increased while the proportion of pyridinic-N is reduced in that of the F, N, S-CDs. Pyrrolic-N, which is sp3-hybridized, may lead to a poorer planarity of the graphite skeleton of the sp2-hybridized carbon core and thus the higher proportion of disordered carbon domains in the F, N, S-CDs than that in the N, S-CDs, as evidenced by the Raman spectroscopy (Figs. 2a and b) [46].
The optical properties of the F, N, S-CDs and N, S-CDs in both solution-state and solid-state were investigated. Fig. 4a shows the UV-vis absorption (left) and the PL emission (right) of the solution-state F, N, S-CDs (red line) and N, S-CDs (blue line) in DMSO. Both samples show two main absorption peaks at 264 nm and 320 nm, which can be attributed to π→π* and n→π* transitions, respectively [47, 48]. However, compared to the N, S-CDs, the F, N, S-CDs have a broader UV-vis absorption range, which could be explained by new defects induced by F-doping [25]. Notably, the N, S-CDs and F, N, S-CDs in DMSO show green (λem = 504 nm) and bright-yellow (λem = 556 nm) fluorescence respectively under an UV excitation (λex = 365 nm). Hence, the introduction of F-related sites produces a red-shift emission of at least 50 nm. As shown in Fig. S6 (Supporting information), both of the F, N, S-CDs and N, S-CDs exhibit an excitation-independent emission behavior in the excitation range of 360-460 nm, and have the same optimal excitation wavelength of 440 nm. Under this optimal excitation, the absolute fluorescence quantum yields (QYs) of the F, N, S-CDs and N, S-CDs in DMSO (Fig. S7 in Supporting information) are 14.57% and 6.57%, respectively. Besides, the time-resolved PL decay curve (Fig. S8 in Supporting information) shows that F, N, S-CDs owns a longer average fluorescence lifetime (τavg = 3.41 ns) than that of the N, S-CDs (τavg = 1.51 ns). The above-mentioned results demonstrate that F-doping resulted in not only a red-shift emission but also a higher fluorescence QY and a longer PL lifetime of the F, N, S-CDs in solution-sate. Similarly, as shown in Fig. 4b, the solid-state F, N, S-CDs presents a wider UV-vis-NIR (200-1000 nm) absorption range than that of the solid-state N, S-CDs (200-650 nm), although both exhibit a broader absorption than each in the solution-state. Among them, the strong absorption bands at 490 nm and 539 nm can be assigned for the n→π* transition of C=N/C=O, C-O and C-S bonds on the surface of N, S-CDs and F, N, S-CDs, respectively [25, 30].

|
Download:
|
| Fig. 4. (a) UV-vis absorption (left) and PL (right) spectra of the F, N, S-CDs and the N, S-CDs in DMSO. (b) UV-vis DRS of the solid-state F, N, S-CDs and N, S-CDs. (c) PL spectra of solid-state F, N, S-CDs measured in the temperature range of 80-420 K (inset: plots of fluorescence intensity with the temperature). | |
More intriguingly, as shown in Fig. S9 (Supporting information), the solid-state F, N, S-CDs powder displays bright red fluorescence under different wavelength excitations, with a maximum emission near 676 nm. The absolute fluorescence QY of the solid-state F, N, S-CDs is 4.17% (Fig. S10 in Supporting information). Its corresponding time-resolved PL decay curve shows an average lifetime of 0.38 ns (Fig. S11 in Supporting information). Oppositely, the solid-state N, S-CDs sample does not show any fluorescence under all of the different wavelength excitations.
Further, an unusual thermo-sensitive SSF behavior of the F, N, S-CDs is discovered. Fig. 4c shows the PL spectra of solid-state F, N, S-CDs in the temperature range of 80-420 K. While the temperature increasing from 80 to 120 K, the PL intensity enhances continuously and reaches the maximum at 120 K, but begins to decrease monotonically with temperature increasing from 120 K to 420 K, revealing an inflection point near 120 K. The inset of Fig. 4c shows a good linear dependency (R2 = 0.9522) of the PL intensity decreasing with the temperature in the range of 120-420 K. Moreover, differential scanning calorimetry (DSC) of F, N, S-CDs (Fig. S12 in Supporting information) shows a prominent endothermic peak at about 124.6 K, suggesting that the aggregation state of F, N, S-CDs may be changed near this temperature. Although the detailed structural change has not been unclear yet. Furthermore, during the cooling process, the PL intensity of F, N, S-CDs increases with the decrease of temperature (Fig. S13 in Supporting information), but there is no inflection point of fluorescence change, which is a little different from the behavior during the heating process. However, the SSF of CDs exhibits the same temperature-sensitive behavior when we increased the temperature from 80 K to 420 K again. Therefore, the SSF of F, N, S-CDs show a reversible temperature-sensitive behavior in the temperature range of 120-420 K.
EPR measurements were carried out to gain an insight to electronic spin situation of the solid state F, N, S-CDs (Fig. S14a in Supporting information) and N, S-CDs (Fig. S14b in Supporting information). Both EPR signals attain almost the same g value of 2.0016 or 2.0011 (approaching to the free electron g value of 2.0023), which means the main paramagnetic centers in carbon cores for both kinds of CDs are identical while F is bonded to C at the edge or on the honeycomb surface of the F, N, S-CDs. In the meantime, as listed in Table 2, the EPR linewidth of F, N, S-CDs is obviously wider than linewidth of the N, S-CDs at temperature of 295 K, this broadening can be attributed to the larger concentration of main paramagnetic centers induced by fluorine doping, and smaller spin-spin and spin-lattice relaxation times in the F-containing CDs.
|
|
Table 2 Parameters such as line width and g factor obtained from EPR data of the F, N, S-CDs and N, S-CDs. |
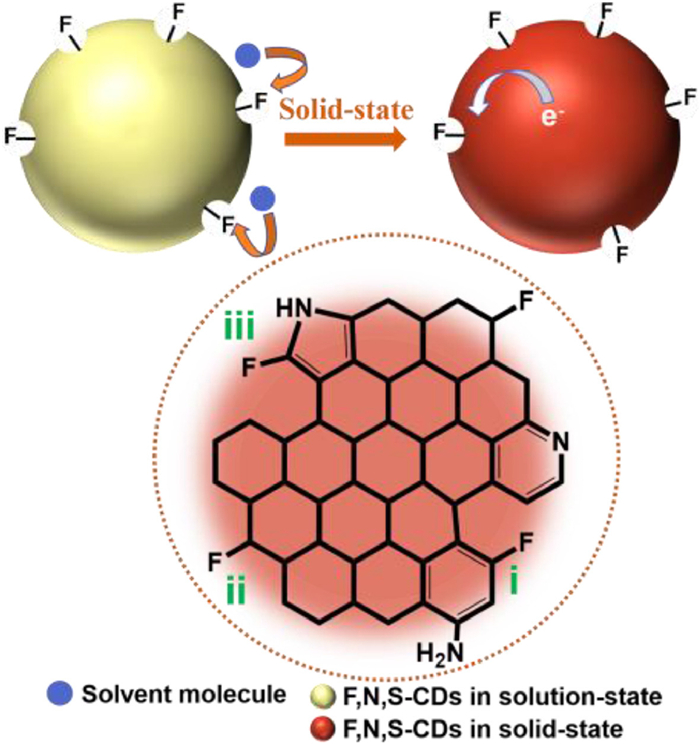
Considering that the N, S-CDs showed no SSF while the F, N, S-CDs showed strong SSF in deep-red region, a possible mechanism of SSF induced by F-defects is proposed, as illustrated in Fig. 5. The marked i), ii) and iii) represent for F-bonded carbon in three different forms, which is in accordance with three signals at different chemical shifts in the 19F NMR spectrum (Fig. 2d). Combined Raman, XPS data with PL spectra, it can be inferred that the new SSF originates from sp3 defects due to the C-F groups attached to the sp2 honeycomb carbon core (sites on the periphery and/or in the basal planes of the CDs) [49]. The formation of the polarized C-F bonds broke the symmetry of the sp2 hybridized carbon lattice (G band), defect-induced Raman scattering of the D band intensity as well as the ID/IG of F, N, S-CDs is significantly increased, compared to that of the N, S-CDs [37, 49]. The fluorine-induced defect traps excitons at the local potential well, make the charge preferentially gather around the defect, where the excitons recombine to produce red SSF. However, in solution-state, the large quantity of S=O groups of the solvent molecules (DMSO) interacted with the surface of F, N, S-CDs [50, 51], which weaken the electro-withdrawing capability of surface F-defects. In addition, the HOMO-LUMO energy levels of CDs were investigated by using cyclic voltammetry (Fig. S15 in Supporting information) [52, 53]. The energy gap between LUMO and HOMO of F, N, S-CDs (1.41 eV) is lower than that of the N, S-CDs (1.74 eV), which reveals that the introduction of F-defect effectively changes the system of electronic energy levels of CDs, and thus the PL red-shift from green (N, S-CDs) to yellow (F, N, S-CDs) in solution state (as shown in Scheme 1).

|
Download:
|
| Fig. 5. Illustration of the possible mechanism of F-defects induced SSF of the F, N, S-CDs. | |
In summary, We have proposed a simple and novel F-strategy for synthesis of solid-state red fluorescent F, N, S-CDs. Both 19F NMR spectrum and XPS data confirm the formation of C-F bond at the periphery/edge or on the surface of the F, N, S-CDs. Compared with the N, S-CDs without F doping, the F, N, S-CDs showed an emission redshift and fluorescence QY increase in solution state. Besides, the solution-state F, N, S-CDs exhibited a "chameleon-like" phenomenon (PL emission shifts from yellow to red) in a mixed solvent of H2O/DMSO with different H2O fractions. More remarkably, F-defects are proved by the obvious enhancement of Raman scattering of D band intensity as well as the ratio value of ID/IG. Further, a possible mechanism of F-defects induced SSF is also discussed. Additionally, the F, N, S-CDs showed an unusual thermosensitive-SSF behavior in the temperature range of 80-420 K. It is expected that these red-emissive F, N, S-CDs has the potential applications in temperature-dependent sensors as well as light-emitting devices, particularly, they may be used together with various polymer-like protective coatings having the optical transparency in the red spectral range.
Declaration of competing interestThe authors report no declarations of interest.
AcknowledgmentsThis work was financially supported by the National Natural Science Foundation of China (No. 51772001), Anhui Province Key Research and Development Plan Project International Science and Technology Cooperation Special Project (No. 202004b11020015). We also acknowledge support of the Key Laboratory of Structure and Functional Regulation of Hybrid Materials (Anhui University), Ministry of Education. A portion of this work was performed on the Steady High Magnetic Field Facilities, High Magnetic Field Laboratory, Chinese Academy of Sciences (CAS).
Supplementary materialsSupplementary material associated with this article can be found, in the online version, at doi:10.1016/j.cclet.2021.04.033.
| [1] |
Y.P. Sun, B. Zhou, Y. Lin, et al., J. Am. Chem. Soc. 128 (2006) 7756-7757. DOI:10.1021/ja062677d |
| [2] |
H. Li, Z. Kang, Y. Liu, et al., J. Mater. Chem. 22 (2012) 24230-24253. DOI:10.1039/c2jm34690g |
| [3] |
S.Y. Lim, W. Shen, Z. Gao, Chem. Soc. Rev. 44 (2015) 362-381. DOI:10.1039/C4CS00269E |
| [4] |
X.W. Hua, Y.W. Bao, F.G. Wu, ACS Appl. Mater. Interfaces 10 (2018) 16924-16924. DOI:10.1021/acsami.8b05530 |
| [5] |
A. Xu, G. Wang, Y. Li, et al., Small 16 (2020) 2004621. DOI:10.1002/smll.202004621 |
| [6] |
B. Wang, J. Li, Z. Tang, et al., Sci. Bull. 64 (2019) 1285-1292. DOI:10.1016/j.scib.2019.07.021 |
| [7] |
W. Li, Y. Liu, B. Wang, et al., Chin. Chem. Lett. 30 (2019) 2323-2327. DOI:10.1016/j.cclet.2019.06.040 |
| [8] |
S.T. Yang, L. Cao, P.G. Luo, et al., J. Am. Chem. Soc. 131 (2009) 11308-11309. DOI:10.1021/ja904843x |
| [9] |
X. Teng, C. Ma, C. Ge, et al., J. Mater. Chem. B 2 (2014) 4631-4639. DOI:10.1039/c4tb00368c |
| [10] |
Y. Hong, J.W.Y. Lam, B.Z. Tang, Chem. Commun. (2009) 4332-4353. DOI:10.1039/b904665h |
| [11] |
Y. Hong, J.W.Y. Lam, B.Z. Tang, Chem. Soc. Rev. 40 (2011) 5361-5388. DOI:10.1039/c1cs15113d |
| [12] |
Y. Chen, M. Zheng, Y. Xiao, et al., Adv. Mater. 28 (2016) 312-318. DOI:10.1002/adma.201503380 |
| [13] |
J. Shao, S. Zhu, H. Liu, et al., Adv. Sci. 4 (2017) 1700395. DOI:10.1002/advs.201700395 |
| [14] |
T. Feng, Q. Zeng, S. Lu, et al., ACS Photonics 5 (2018) 502-510. DOI:10.1021/acsphotonics.7b01010 |
| [15] |
H. Yang, Y. Liu, Z. Guo, et al., Nat. Commun. 10 (2019) 1789. DOI:10.1038/s41467-019-09830-6 |
| [16] |
Y. Liu, W. Duan, W. Song, et al., ACS Appl. Mater. Interfaces 9 (2017) 12663-12672. DOI:10.1021/acsami.6b15746 |
| [17] |
J. Zhou, H. Zhou, J. Tang, et al., Microchimica Acta 184 (2017) 343-368. DOI:10.1007/s00604-016-2043-9 |
| [18] |
K. Jiang, Y. Wang, X. Gao, et al., Angew. Chem. Int. Ed. 57 (2018) 6216-6220. DOI:10.1002/anie.201802441 |
| [19] |
T. Lei, X. Xia, J.Y. Wang, et al., J. Am. Chem. Soc. 136 (2014) 2135-2141. DOI:10.1021/ja412533d |
| [20] |
L.E. Zimmer, C. Sparr, R. Gilmour, Angew. Chem. Int. Ed. 50 (2011) 11860-11871. DOI:10.1002/anie.201102027 |
| [21] |
D. O'Hagan, Chem. Soc. Rev. 37 (2008) 308-319. DOI:10.1039/B711844A |
| [22] |
H. Sun, H. Ji, E. Ju, et al., Chem. Eur. J. 21 (2015) 3791-3797. DOI:10.1002/chem.201406345 |
| [23] |
W. Yang, H. Zhang, J. Lai, et al., Carbon 128 (2018) 78-85. DOI:10.1016/j.carbon.2017.11.069 |
| [24] |
G. Zuo, A. Xie, J. Li, et al., J. Phys. Chem. C 121 (2017) 26558-26565. DOI:10.1021/acs.jpcc.7b10179 |
| [25] |
L. Jiang, H. Ding, M. Xu, et al., Small 16 (2020) 2000680. DOI:10.1002/smll.202000680 |
| [26] |
J. Zhou, J. Lian, L. Hou, et al., Nat. Commun. 6 (2015) 8503. DOI:10.1038/ncomms9503 |
| [27] |
M. Lan, S. Zhao, Z. Zhang, et al., Nano Res 10 (2017) 3113-3123. DOI:10.1007/s12274-017-1528-0 |
| [28] |
S. Lu, L. Sui, J. Liu, et al., Adv. Mater. 29 (2017) 1603443. DOI:10.1002/adma.201603443 |
| [29] |
H. Song, X. Liu, B. Wang, et al., Sci. Bull. 64 (2019) 1788-1794. DOI:10.1016/j.scib.2019.10.006 |
| [30] |
F. Yuan, Z. Wang, X. Li, et al., Adv. Mater. 29 (2017) 1604436. DOI:10.1002/adma.201604436 |
| [31] |
K. Bogdanov, A. Fedorov, V. Osipov, et al., Carbon 73 (2014) 78-86. DOI:10.1016/j.carbon.2014.02.041 |
| [32] |
C. Hu, S. Sedghi, A. Silvestre-Albero, et al., Carbon 85 (2015) 147-158. DOI:10.1016/j.carbon.2014.12.098 |
| [33] |
M.J. Krysmann, A. Kelarakis, P. Dallas, et al., J. Am. Chem. Soc. 134 (2012) 747-750. DOI:10.1021/ja204661r |
| [34] |
Y. Li, Y. Zhao, H. Cheng, et al., J. Am. Chem. Soc. 134 (2012) 15-18. DOI:10.1021/ja206030c |
| [35] |
H. Ding, S.B. Yu, J.S. Wei, et al., ACS Nano 10 (2016) 484-491. DOI:10.1021/acsnano.5b05406 |
| [36] |
Q. Xu, P. Pu, J. Zhao, et al., J. Mater. Chem. A 3 (2015) 542-546. DOI:10.1039/C4TA05483K |
| [37] |
P. Long, Y. Feng, C. Cao, et al., Adv. Funct. Mater. 28 (2018) 1800791. DOI:10.1002/adfm.201800791 |
| [38] |
J. Viger-Gravel, C.E. Avalos, D.J. Kubicki, et al., Angew. Chem. Int. Ed. 58 (2019) 7249-7253. DOI:10.1002/anie.201814416 |
| [39] |
M. Murakami, K. Matsumoto, R. Hagiwara, et al., Carbon 138 (2018) 179-187. DOI:10.1016/j.carbon.2018.06.004 |
| [40] |
W. Feng, P. Long, Y. Feng, et al., Adv. Sci. 3 (2016) 1500413. DOI:10.1002/advs.201500413 |
| [41] |
Y. Dong, H. Pang, H.B. Yang, et al., Angew. Chem. Int. Ed. 52 (2013) 7800-7804. DOI:10.1002/anie.201301114 |
| [42] |
Z. Song, F. Quan, Y. Xu, et al., Carbon 104 (2016) 169-178. DOI:10.1016/j.carbon.2016.04.003 |
| [43] |
K. Jiang, S. Sun, L. Zhang, et al., Angew. Chem. Int. Ed. 54 (2015) 5360-5363. DOI:10.1002/anie.201501193 |
| [44] |
C. Hu, C. Yu, M. Li, et al., Small 10 (2014) 4926-4933. DOI:10.1002/smll.201401328 |
| [45] |
C. Struzzi, M. Scardamaglia, N. Reckinger, et al., Nano Res. 10 (2017) 3151-3163. DOI:10.1007/s12274-017-1532-4 |
| [46] |
R. Hu, L. Li, W.J. Jin, Carbon 111 (2017) 133-141. DOI:10.1016/j.carbon.2016.09.038 |
| [47] |
X. Miao, X. Yan, D. Qu, et al., ACS Appl. Mater. Interfaces 9 (2017) 18549-18556. DOI:10.1021/acsami.7b04514 |
| [48] |
C. Scialabba, A. Sciortino, F. Messina, et al., ACS Appl. Mater. Interfaces 11 (2019) 19854-19866. DOI:10.1021/acsami.9b04925 |
| [49] |
H. Kwon, A.O. Furmanchuk, M. Kim, et al., J. Am. Chem. Soc. 138 (2016) 6878-6885. DOI:10.1021/jacs.6b03618 |
| [50] |
D. Li, P. Jing, L. Sun, et al., Adv. Mater. 30 (2018) 1705913. DOI:10.1002/adma.201705913 |
| [51] |
D. Li, C. Liang, E.V. Ushakova, et al., Small 15 (2019) 1905050. DOI:10.1002/smll.201905050 |
| [52] |
F. Rigodanza, L. Đorđević, F. Arcudi, et al., Angew. Chem. Int. Ed. 57 (2018) 5062-5067. DOI:10.1002/anie.201801707 |
| [53] |
A. Bayat, E. Saievar-Iranizad, J. Lumin. 192 (2017) 180-183. DOI:10.1016/j.jlumin.2017.06.055 |