 2021, Vol. 32


b Environment Pollution Control Center, Zibo 255000, China
Nonalcoholic fatty liver disease (NAFLD) is a severe metabolic syndrome caused by excessive lipid deposition in hepatocytes [1, 2]. If NAFLD is not diagnosed promptly, it can rapidly progress to nonalcoholic steatohepatitis and even life-threatening hepatocellular carcinoma [3, 4]. Therefore, it is urgent to establish an in situ, nondestructive and reliable approach for making a definite diagnosis of NAFLD. At present, the methods for diagnosing NAFLD include mainly liver biomarkers and pathological examination [5]. However, these methods have inherent drawbacks in terms of their tedious procedures, poor reproducibility and high false positive rates [6, 7]. Hence, a rapid and accurate imaging diagnosis-based approach for the early detection and evaluation of NAFLD is of critical significance.
Endoplasmic reticulum (ER) stress plays a pivotal role in the widely accepted "second strike" theory of NAFLD [8, 9]. Excess lipids disrupt ER homeostasis, and trigger ER stress in liver cells [10]. Moreover, ER stress can cause unfolded and misfolded proteins and lipids to accumulate in the ER lumen [11]. These accumulated proteins or lipids may alter the microenvironment of the ER, especially its viscosity. Therefore, the development of an ideal and reliable diagnostic method to specifically monitor ER viscosity changes in the liver of mice will help improve the early detection and treatment of NAFLD.
Fluorescence imaging has outstanding advantages for bioimaging, such as great temporal and spatial resolution, and a noninvasive nature, and has become a powerful technology for directly monitoring microenvironmental changes [12, 13]. To date, several near-infrared (NIR) fluorescent probes based on molecular rotors have been reported for detecting viscosity in biosystems due to their deep tissue penetration depths [14-16]. Moreover, some of the latest organelle specific viscosity probes also have been developed [17-20]. However, NIR fluorescent probes for real-time and in situ imaging of ER viscosity alterations in vivo are still lacking.
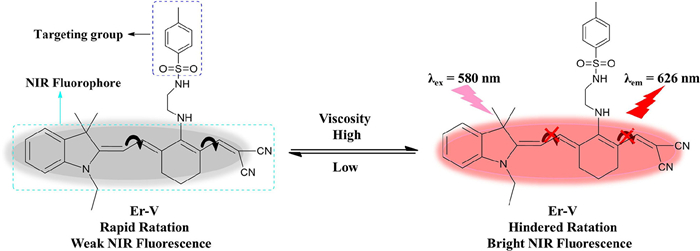
Given the complex conditions in the ER, we fabricated an NIR fluorescent probe, Er-V, to image ER viscosity changes. In the probe structure, malononitrile and methyl sulphonamide moieties are acted as rotor and targeting groups by binding with the corresponding sulphonamide receptor on the ER lumen [16, 21]. The malononitrile and hemicyanine groups are linked by a freely rotatable vinyl bond to form a Π-conjugation system (Scheme 1). Er-V emitted weak fluorescence in nonviscous solvents because the rotor rotated freely around the hemicyanine section. However, the rotation of the rotor was specifically restricted as the environmental viscosity increasing, which inhibited the process of nonradiative energy, and eventually resulted in fluorescence enhancement of Er-V at 626 nm. Therefore, Er-V could elicit a strong fluorescence signal in a high-viscosity environment. Moreover, confocal laser fluorescence images confirmed that Er-V could accurately locate the ER and indicate local changes in viscosity. More importantly, by using Er-V, we observed a significant increase in the viscosity variations of the ER in the liver of mice with NAFLD.

|
Download:
|
| Scheme 1. The probe structure of Er-V and proposed mechanism of its response to viscosity. | |
The detailed synthesis steps of Er-V was shown in Scheme S1 (Supporting information). Compound 2 smoothly reacted with compound 3 through nucleophilic substitution to offer the Er-V. The chemical structure of Er-V was fully characterized by NMR and high resolution mass spectrum (Supporting information).
First, the optical properties of Er-V were investigated in different polar organic solvents (DMF, 1.4-Dio, DMSO, THF, MeOH and glycerol) and PBS. Er-V exhibited various absorption bands ranging from 475 nm to 590 nm in these solutions (Fig. S1a in Supporting information). However, the fluorescence intensities of Er-V were remarkably enhanced in glycerol compared with other solutions (Fig. S1b in Supporting information). As a result, we preliminarily know that Er-V does not respond to environmental polarity. To exclude fluorescent responses from polarity, we perform an experiment in which the viscosity is kept constant, but the polarity is varied. Er-V emitted weak fluorescence in MeOH and THF solutions, proving that ER-V was not sensitive to polarity. However, compared with the strong fluorescence of Er-V in glycerol, its fluorescence in EG was relatively weak (Fig. S2 in Supporting information). To further confirm that Er-V is sensitive to environmental viscosity, the response of Er-V fluorescence was conducted in a methanol-glycerol medium with different proportions of methanol to glycerol. The viscosity value of the medium also increased with glycerol content. The main absorption peak intensities of Er-V at 585 nm slightly increased with increasing was observed from pure MeOH to glycerol in Fig. S3 (Supporting information).
Moreover, a progressive enhancement in the fluorescence at 626 nm an increasing proportion of glycerol (Fig. 1a). Importantly, as shown in Fig. 1b, after fitting the data to the Förster-Hoffmann equation [22], there was a clear linear relationship (R2 = 0.994) between the fluorescence intensity of Er-V and the medium viscosity ranging from 3 cp to 647 cp. As shown in Table S1 (Supporting information), the corresponding fluorescence quantum yields (ϕf) of Er-V were accurately calculated across the solvent range from MeOH (ϕf = 1.1%) to glycerol (ϕf = 20.0%). Additionally, the fluorescence lifetime is considered a key parameter for assessing the properties of viscosity probes [23]. Therefore, we also recorded the fluorescence lifetimes of Er-V in solvents with different viscosities. As depicted in Figs. 1c and d, the fluorescence lifetimes markedly increased with increasing viscosity. Notably, lifetime-viscosity titration experiments yielded an excellent linear relationship (R2 = 0.993) according to the corresponding equation [24]. Therefore, these data confirm that Er-V is an NIR fluorescent probe that is sensitive to environmental viscosity variations.

|
Download:
|
| Fig. 1. (a) Changes in the fluorescence of Er-V (5.0 µmol/L) in different methanol-glycerol systems. (b) The linear relationship between log I626 and log ƞ of Er-V. (c) Fluorescence lifetimes of Er-V (5.0 µmol/L) in various methanol-glycerol systems. (d) The linear relationship between logτ and logƞ. λex = 580 nm, λem = 626 nm. | |
The intracellular microenvironment is an extremely complex biological system that mainly includes many reactive oxygen/nitrogen/sulfur species, various metal anions, enzymes and so on. The selectivity of Er-V was studied on the basis of its fluorescence response in the presence of various related interfering biomolecules. As displayed in Fig. S4 (Supporting information), the fluorescence spectra of Er-V hardly changed in the presence of these biologically relevant species, except in glycerol. These phenomena demonstrate that Er-V has outstanding selectivity for viscosity. To eliminate interferences from pH changes, we needed to evaluate the response of the Er-V fluorescence intensity in solutions with various pH values and viscosities. The fluorescence of Er-V in 30% glycerol solution was much higher than that in PBS solution at the same pH (Fig. S5 in Supporting information). These results indicate that the fluorescence of Er-V is dependent on viscosity rather than pH. Additionally, the fluorescence intensity of Er-V remained almost constant after 55 min in glycerol (Fig. S6 in Supporting information). Collectively, these results demonstrate that Er-V has the ability to track viscosity changes with high selectivity and specificity in complicated biological environments.
Inspired by the above outstanding characteristics of Er-V, we next studied the feasibility of its application in biological systems. First, the intracellular cytotoxicity of Er-V was examined by the standard 3-(4, 5-dimethylthiazol-2-yl)−2, 5-diphenyl tetrazolium bromide (MTT) assay [25]. These cells showed excellent cell viability (Fig. S7 in Supporting information), and the IC50 value was calculated to be 93.2 µmol/L. The above results imply that Er-V possesses very low toxicity and excellent biocompatibility. Next, we carried out distribution imaging experiments to observe the intracellular localization of Er-V. HL-7702 cells were simultaneously stained with Er-V and commercial ER dye. As shown in Fig. 2, the red fluorescence of Er-V was consistent with the green fluorescence of the commercial dye, and the corresponding Pearson's correlation coefficient was determined to be 0.94. Conversely, the coefficients for the colocalization of Er-V with commercial dyes in the mitochondria and lysosomes were calculated to be 0.11 and 0.52, respectively, (Fig. S8 in Supporting information). These results reveal that Er-V targets predominantly into the ER.

|
Download:
|
| Fig. 2. Colocalization fluorescence images of HL-7702 cells stained with Er-V and ER commercial dye. HL-7702 cells were treated with Er-V (5.0 µmol/L) and commercial ER dye (50 nmol/L), simultaneously. (a) Fluorescence image from ER commercial dye (λex = 488 nm, λem = 495-550 nm). (b) Fluorescence image from Er-V (λex = 561 nm, λem = 580-700 nm). (c) The overlay images of image (a) and (b). (d) Intensity profile of the blue line in image (c). Scale bar = 75 µm. | |
Next, we explored whether Er-V can sense changes in local viscosity in ER-stressed HL-7702 cells. Tunicamycin (Tm) is a common reagent used to trigger ER stress by accumulating lipids and proteins into the ER of living cells [26]. Therefore, we chose Tm to induce ER stress in HL-7702 cells. As seen from Fig. 3, the fluorescence intensities of the Tm-stimulated cells were distinctly higher than those of the normal cells. These results unambiguously indicated that the intracellular fluorescence enhancement was triggered by the higher ER viscosity under ER stress. Subsequently, the intracellular photostability of Er-V was examined. As shown in Fig. S9 (Supporting information), Er-V maintained a strong fluorescence intensity for 25 min. These experimental data indicate that Er-V can monitor the ER viscosity changes caused by ER stress over time.

|
Download:
|
| Fig. 3. Fluorescence images of viscosity changes in HL-7702 cells under ER stress. (a, c) The cells were stained with Er-V (5.0 µmol/L, 30 min). (b, d) The cells were exposed to Tm (50 µg/mL, 30 min) and then incubated with Er-V (5.0 µmol/L, 30 min). (e) Relative fluorescence intensity to the control cells. Scale bar = 75 µm. The values are the mean ± s.d. (n = 5), ★★★P < 0.001. λex = 561 nm, λem = 580-700 nm. | |
ER stress is generally considered essential for the initiation and pathogenesis of NAFLD, although the exact mechanism is still somewhat unclear [27]. Studies suggest that excess intracellular lipids and proteins can initiate ER stress, causing changes in the ER microenvironment [11]. Therefore, we next investigated whether Er-V could ER viscosity changes in NAFLD cells. Oleic acid (OA) was selected as a stimulus to cause intracellular metabolism disorder through related signaling regulation [28]. As given in Fig. 4, we clearly observed that normal cells displayed a weak fluorescence signal, while the NIR fluorescence signal in OA-stimulated cells was greatly enhance, demonstrating that the ER viscosity was increased obviously in NAFLD cells. These findings confirm that Er-V can accurately detect ER viscosity changes.

|
Download:
|
| Fig. 4. Fluorescence images of viscosity changes in NAFLD cells. (a, c) HL-7702 cells were stained with Er-V (5.0 µmol/L, 30 min). (b, d) HL-7702 cells were exposed to OA (5.0 µmol/L, 1.0 h) and then incubated with Er-V (5.0 µmol/L, 30 min). (e) Relative fluorescence intensity to the control cells. Scale bar = 50 µm. The values are the mean ± s.d. (n = 5), ★★★P < 0.001. λex = 561 nm, λem = 580-700 nm. | |
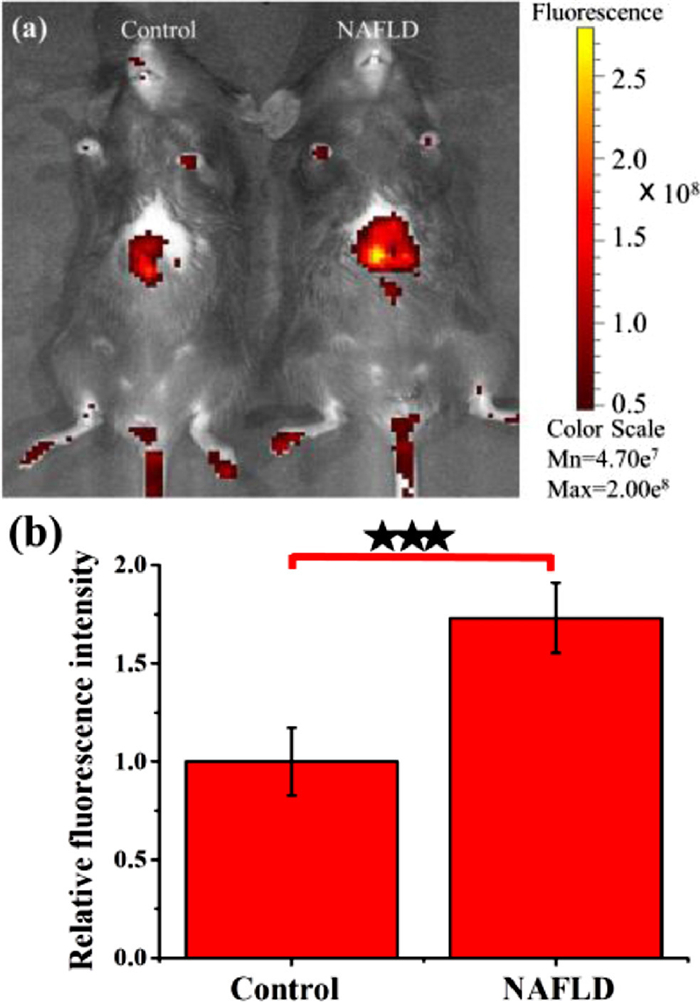
Considering the NIR fluorescence emission properties of Er-V, we applied Er-V to evaluate whether it could distinguish NAFLD mice from normal mice based on discernable viscosity. We first tested the in vivo toxicity of Er-V in C57 mice [29]. As shown in Fig. S10 (Supporting information), the growth conditions, such as the dietary behavior and body weight of the two experimental mouse groups were basically in agreement with those of the normal group for 2 weeks. These results indicate that Er-V has very low toxicity in vivo and can be applied to measure viscosity changes in livers of mice. NAFLD is caused by the excessive accumulation of neutral lipids in the liver, mainly triacylglycerol and cholesteryl ester [30]. Moreover, high-fat diet (HFD) reignites ER stress and then causes liver steatosis during the onset of NAFLD in vivo. Therefore, C57 mice with NAFLD were fed a HFD for 7 weeks [31]. The body weights of model mice were significantly higher than those of normal mice (Fig. S11 in Supporting information). Then, we explored the degree of lesions and lipid depositions in the liver of the two groups of mice by using clinical histochemical staining [32]. Hematoxylin and eosin and oil red O staining showed that the mice fed a HFD had significantly more severe symptoms, such as more extensive lesions and lipid droplet depositions (Fig. S12 in Supporting information). Moreover, we also measured the alanine aminotransferase (ALT) levels in fresh liver tissue homogenates of the two groups of mice with a specific kit, since ALT has recently been recognized as a robust biomarker of NAFLD [33]. The relative ALT content in the NAFLD group was distinctly higher than that in the control group (Fig. S13 in Supporting information). These results collectively manifest that the NAFLD mouse model induced by a HFD was successfully established. After in vivo treatment with Er-V, the NIR fluorescence intensity in the livers of the model mice was significantly stronger than that in the livers of the normal mice (Fig. 5). Furthermore, we dissected mice to observe the fluorescence intensities of certain organs, such as the heart, liver, spleen, lung, and kidney. As shown in Fig. S14 (Supporting information), we observed an increase in the fluorescence signal only in the liver, demonstrating that the liver viscosity of mice fed a HFD was significantly increased due to overdeposition of lipids in the liver during NAFLD. Accordingly, these experimental results provide compelling data that the ingenious platform-based probe Er-V, which enables simultaneous imaging and diagnosis, will be vitally important for early diagnosis and treatment of NAFLD.

|
Download:
|
| Fig. 5. In vivo fluorescence images of the livers of mice in the NAFLD model. (a) Fluorescence imaging of the livers of mice. (b) Fluorescence intensity relative to that from the control mice.. The values are the mean ± s.d. (n = 5), ★★★P < 0.001. λex = 560 nm, λem = 620 ± 20 nm. | |
In summary, we constructed an ultrasensitive NIR fluorescent probe, Er-V, for the visual detection of viscosity dynamics. Er-V can specifically anchor to the ER via methyl sulphonamide moieties, as demonstrated by confocal microscopy fluorescence imaging. Moreover, we found that the viscosity distinctly increased in HL-7702 cells stimulated by oleic acid or Tm. Strikingly, in vivo NIR fluorescence imaging results profoundly that a higher viscosity of the microenvironment occurs in the liver tissue of NAFLD mice. Hence, our current work may provide an ingenious imaging strategy for the early diagnosis and treatment of NAFLD.
Declaration of competing interestThere are no conflicts to declare.
Ethics statementAll of the animal experiments were performed in strict accordance with the relevant laws and guidelines issued and approved by the Ethical Committee of Shandong Normal University for the Care and Use of Laboratory Animals.
AcknowledgmentsThis work was supported by the National Natural Science Foundation of China (Nos. 21927811, 91753111, 22074083, 21907061), the Key Research and Development Program of Shandong Province (No. 2018YFJH0502), and the National Major Scientific and Technological Special Project for "Significant New Drugs Development" (No. 2017ZX09301030004).
Supplementary materialsSupplementary material associated with this article can be found, in the online version, at doi:10.1016/j.cclet.2021.04.035.
| [1] |
L.A. Adams, P. Angulo, K.D. Lindor, CMAJ 172 (2015) 899-905. |
| [2] |
M. Zobair, M.D. Younossi, Clin. Liver Dis. 11 (2018) 92-94. DOI:10.1002/cld.710 |
| [3] |
L. Vigano, A. Lleo, A. Aghemo, HepatoBiliary Surg. Nutr. 7 (2018) 130-133. DOI:10.21037/hbsn.2018.01.01 |
| [4] |
A. Sircana, E. Paschetta, F. Saba, et al., Int. J. Mol. Sci. 20 (2019) 1745. DOI:10.3390/ijms20071745 |
| [5] |
E. Cleveland, A. Bandy, L.B. WanWagner, Clin. Liver Dis. 11 (2018) 98-104. DOI:10.1002/cld.716 |
| [6] |
Y. Sumida, A. Nakajima, Y. Itoh, J. Gastroenterol. 20 (2014) 475-485. |
| [7] |
J.D. Browning, J.D. Horton, J. Clin. Investig. 114 (2004) 147-152. DOI:10.1172/JCI200422422 |
| [8] |
H. Nakagawa, A. Umemura, K. Taniguchi, et al., Cancer Cell 26 (2014) 1-13. DOI:10.1016/j.ccr.2014.06.015 |
| [9] |
J.Y. Kim, R.G. Carbonell, S. Yamachika, et al., Cell 175 (2018) 133-145. DOI:10.1016/j.cell.2018.08.020 |
| [10] |
P. Puri, F. Maridoddin, O. Cheung, et al., Gastroenterology 134 (2008) 568-576. DOI:10.1053/j.gastro.2007.10.039 |
| [11] |
M. Masarone, V. Rosato, M. Dallio, et al., Oxid. Med. Cell Longev. 2018 (2018) 9547613. |
| [12] |
R. Guo, J.L. Yin, Y.Y. Ma, et al., Sens. Actuators B: Chem. 271 (2018) 321-328. DOI:10.1016/j.snb.2018.05.055 |
| [13] |
X.J. Peng, Z.H. Zhang, J.Y. Wang, et al., J. Am. Chem. Soc. 133 (2011) 6626-6635. DOI:10.1021/ja1104014 |
| [14] |
K. Dou, W.J. Huang, Y.H. Xiang, et al., Anal. Chem. 92 (2020) 4177-4181. DOI:10.1021/acs.analchem.0c00634 |
| [15] |
Z.G. Yang, Y.X. He, J.H. Lee, et al., Chem. Commun. 50 (2014) 11672-11675. DOI:10.1039/C4CC04915B |
| [16] |
Y.Q. Zhou, P. Li, X. Wang, et al., Chem. Sci. 11 (2020) 12149-12156. DOI:10.1039/d0sc02922j |
| [17] |
S.X. Zhou, B.C. Zhou, N. Wang, et al., Chin. Chem. Lett. 31 (2020) 2897-2902. DOI:10.1016/j.cclet.2020.03.037 |
| [18] |
X.F. Zhang, L. Wang, N. L, et al., Chin. Chem. Lett. 32 (2021) 2395-2399. DOI:10.1016/j.cclet.2021.02.031 |
| [19] |
X.D. Wang, L. Fan, S.H. Wang, et al., Anal. Chem. 93 (2020) 3241-3249. |
| [20] |
C.X. Chen, H.B. Fang, X.T. Shao, et al., Nat. Commun. 11 (2020) 6290. DOI:10.1002/chem.202001486 |
| [21] |
X.B. Xiao, P. Li, X.F. Hu, et al., Chem. Sci. 7 (2016) 6153-6159. DOI:10.1039/C6SC01793B |
| [22] |
W. Chen, J.Y. Han, J.X. She, et al., Chem. Common. 56 (2020) 7797-7800. DOI:10.1039/d0cc00868k |
| [23] |
Y. He, J.W. Shin, W.J. Gong, et al., Chem. Commun. 55 (2019) 2453-2456. DOI:10.1039/c9cc00300b |
| [24] |
B.C. Chen, C.D. Li, J. Zhang, Chem. Commun. 55 (2019) 7410-7413. DOI:10.1039/c9cc03977e |
| [25] |
X. Wang, P. Li, Q. Ding, et al., Angew. Chem. Int. Ed. 58 (2019) 4674-46788. DOI:10.3390/en12244674 |
| [26] |
H.B. Xiao, C.C. Wu, P. Li, Chem. Sci. 8 (2017) 7025-7030. DOI:10.1039/C7SC02330H |
| [27] |
J.F. Ji, T. Homma, S. Kobayashi, et al., World J. Biol. Chem. 9 (2018) 1-15. DOI:10.1097/CEJ.0000000000000420 |
| [28] |
J. Hu, W. Hong, K.N. Yao, et al., J. Gastroenterol. 25 (2019) 1492-1501. |
| [29] |
X.J. Peng, Z.G. Yang, J.Y. Wang, et al., J. Am. Chem. Soc. 133 (2011) 6626-6635. DOI:10.1021/ja1104014 |
| [30] |
T. Karlas, R. Physician, J. Wiegand, et al., J. Clin. Endocrinol. Metab. 27 (2013) 195-208. |
| [31] |
M.C. Heffern, H.M. Park, H.Y. Au-Yeung, et al., Proc. Natl. Acad. Sci. U. S. A. 113 (2016) 14219-14224. DOI:10.1073/pnas.1613628113 |
| [32] |
D. Cheng, X.Y. Gong, Q. Wu, et al., Anal. Chem. 92 (2020) 11396-11404. DOI:10.1021/acs.analchem.0c02277 |
| [33] |
Y. Chang, S. Ryu, E. Sung, et al., Clin. Chem. 53 (2007) 686-692. DOI:10.1373/clinchem.2006.081257 |