 2021, Vol. 32


b Department of Physics, College of Science, China Pharmaceutical University, Nanjing 211198, China;
c Institute of Tibetan Medicine, University of Tibetan Medicine, Lhasa 850000, China
As a widely used volatile organic compound, acetone is regarded as one of the most harmful reagents to human health and environmental safety due to its easy volatilization, toxic and flammable nature [1,2]. Clinically, it is also considered to be one of the specific biomarkers for diagnosing human type Ⅰ diabetes. An individual may be afflicted with diabetes if his expiration product gives an acetone concentration of above 1.8 ppm, whereas it is lower than 0.9 ppm for a healthy one [3,4]. Therefore, gas sensors aimed at acetone have been extensively investigated, and it is significant for the environment safety as well as the human health to find an acetone gas sensor with excellent performances. Lately, plenty of metal oxide semiconductors, such as Fe2O3 [5], ZnO [6], SnO2 [7] and CuO [8], have been used as gas sensing materials to detect acetone. Among them, Fe2O3 has been proved to be a more promising n-type semiconductor with excellent gas sensing characteristics [9,10]. However, it still has some shortcomings, e.g., low sensitivity and poor selectivity, which set up great obstacles for its commercial applications. Thus, many fascinating methods have been applied to improve the performances of Fe2O3-based gas sensor towards acetone.
As is well-known, the morphology of the sensing material plays a key role in its sensing performances for a metal oxide-based gas sensor. Of late, the metal-organic frameworks (MOFs) have been drawing more and more attention since some metal oxides with defined morphology and amazing shapes can be obtained through a high-temperature calcination of metal ions and organic ligands in them [11,12]. Generally, the metal oxides derived from MOFs can not only avoid aggregation and provide sufficient reaction sites but also facilitate gas diffusivity so that the gas sensing performances can be enhanced a lot [1,13]. In light of the merits of MOFs, many researchers have set their sights on taking advantage of them as precursors to get Fe2O3 in the field of gas sensing. For instance, Gao et al. [14] synthesized Fe2O3 porous nanorods with controlled morphologies by thermolysis of Fe-based MOF (MIL-88A), which exhibited better selectivity to acetone compared to the other samples. Yin et al. [15] used MOF of MIL-53 as a self-sacrificing template for preparing PrFeO3/α-Fe2O3 composite, and exhibited a high gas response and superior selectivity to ethyl acetate gas. Tian et al. [16] have prepared hollow porous Fe2O3 nanoboxes derived from MOF of Prussian blue (PB) and then used for a H2S gas sensor. On the other side, another general route to enhance gas sensing performances of a gas sensor is the surface modification, especially combining with other metal oxides to form an interesting heterojunction. As an attractive p-type material, Co3O4 has been reported as a perfect gas sensing material for detecting reduce gases as a result of its strong catalytic oxidation activity [17,18]. Besides, the ionic radiuses of the Fe and Co are so similar that lattice mismatches and oxygen vacancies can be obtained easily. Thus, combining Fe2O3 with Co3O4 to form p-n heterojunctions can effectively enhance the gas sensing performances of a gas sensor theoretically. Although the gas sensors based on n-type metal oxide and Co3O4 have received widespread attention, to the best of our knowledge, there are few reports on the hollow Fe2O3/Co3O4 microcubes derived from MOF of Prussian blue for improved gas sensing performances towards acetone.
Herein, hollow Fe2O3/Co3O4 microcubes have been fabricated using MOF of PB through a hydrothermal method along with a calcination process, as shown in Fig. 1 (more details can be found in Supporting information). In this strategy, the MOF of PB is used as a soft template to get the microcubes as well as the source of Fe. The fabricated hollow Fe2O3/Co3O4 microcubes have a side length of around 400 nm and an outer shell of 20-40 nm, and their gas sensing properties towards acetone have been investigated carefully. The results show that the gas sensor based on the hollow microcubes had a higher response of 21.2 and a shorter response time of 5 s when exposed to 20 ppm acetone at a working temperature of 200 ℃, which is superior to that of pure Fe2O3 and Co3O4. The excellent gas sensing properties may be attributed to the hollow structures, the catalytic activity of Co3O4 as well as the formed p-n heterojunctions between Fe2O3 and Co3O4, and the gas sensor based on the as-prepared microcubes has a potential to find its practical application to detect acetone, especially towards its low concentration.

|
Download:
|
| Fig. 1. The synthetic scheme of the hollow Fe2O3/Co3O4 structures. | |
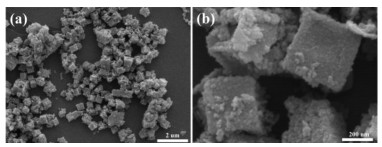
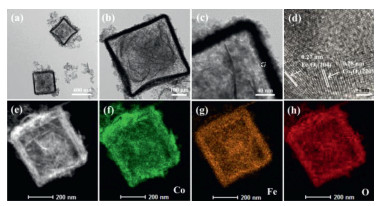
A series of techniques have been used to characterize the samples carefully (more details can be found in Supporting information). The morphologies and microstructures of the samples were elucidated by scanning electron microscopy (SEM) and transmission electron microscopy (TEM). As shown in Fig. S2 (Supporting information), the Fe2O3 composites are composed of microcubes, and the Co3O4 composites consist of irregular nanoparticles. Fig. 2a and b present the SEM images of the obtained sample at low magnification and high magnification, respectively. It can be found that the sample is composed of relatively uniform microcubes, and they have rough surfaces with a side length of 300-400 nm, and quite a number of particles accumulated on the surface of the microcubes. Noticeably, some microcubes have collapsed from the inside, indicating that the microcubes may have a hollow morphology. In order to further confirm this, the microcubes were investigated by TEM. As shown in Figs. 3a-c, it is clear that the microcubes are hollow. They have a side length of around 400 nm, which is in good accordance with the SEM results, and an outside shell thickness of 20-40 nm. Fig. 3d exhibits a high-resolution transmission electron microscope (HRTEM) image of the microcube, from which it can be seen that the interplanar space of ca. 0.28 nm and ca. 0.27 nm coexisted in the same area, corresponding to the < 220 > crystal plane of Co 3O4 and the < 104 > crystal plane of Fe 2O3, respectively. Afterwards, a high angle annular dark field (HADDF) and element mapping spectrogram tests were carried out in order to further study the microcubes. As displayed by Figs. 3e-h, the HADDF image also exhibits hollow microcubes, and the element mapping maps clearly reflects that the microcubes contains elements of Co, Fe and O, which are evenly distributed within the microcubes without obvious aggregation. These results illustrate that Co3O4 has been successfully combined with Fe2O3 to form p-n heterostructures between them.

|
Download:
|
| Fig. 2. (a) SEM images at a low magnification and (b) a high magnification of the sample. | |

|
Download:
|
| Fig. 3. (a-c) TEM images at different magnifications and (d) HRTEM image of hollow Fe2O3/Co3O4 microcubes. (e) HAADF image of a hollow Fe2O3/Co3O4 microcube, and its elemental mapping images: (f) Fe, (g) Co and (h) O. | |
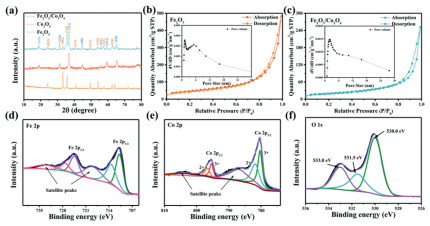
In order to explore their phases, powder X-ray diffraction (XRD) technique was performed on the Fe2O3, Co3O4 and Fe2O3/Co3O4 samples, as presented in Fig. 4a. For the two pristine samples, the obvious diffraction peaks match well with pure hematite Fe2O3 (PDF#33-0664) and pure spinel Co3O4 (PDF#43-1003), respectively [19]. With respect to the hollow Fe2O3/Co3O4 microcubes, the main diffraction peaks can be well indexed to the crystal planes of hematite Fe2O3 and spinel Co3O4, indicating their successful synthesis. In addition, no peaks of other impurities can be observed, illustrating a high purity of the samples. Figs. 4b and c present the nitrogen adsorption-desorption isotherms and pore size distribution curves of pure Fe2O3 and Fe2O3/Co3O4 microcubes. From these figures, it can be seen that an obvious hysteresis loops are formed. They can be assigned to the typical type Ⅳ according to the IUPAC classification, indicating the presence of mesopores in the samples. The specific areas of pristine Fe2O3 and Fe2O3/Co3O4 microcubes are calculated to be 39.9 and 69.5 m2/g, respectively. The microcubes have a much larger specific area than that of pure Fe2O3. Furthermore, to explore the surface elemental compositions, the microcubes were investigated by X-ray photoelectron spectroscopy (XPS). Figs. 4d-f present the Fe 2p, Co 2p and O 1s spectra of the microcubes and the peak fitting results. The spectra of Fe 2p in the Fig. 4d are composed of two main peaks located at 711.1 eV and 724.5 eV. They originate from Fe 2p3/2 and Fe 2p1/2, and two satellite peaks of 719.2 eV and 733.2 eV can be seen [20,21]. The peaks of 780.3 eV and 795.6 eV in the Fig. 4e can be assigned to Co 2p3/2 and Co 2p1/2 with a spin energy separation of 15.3 eV [22]. There are also two low satellite peaks at 787.2 eV and 803.8 eV, corresponding to Co 2p3/2 and Co 2p1/2 [23]. As for the O 1s spectra in the Fig. 4f, the peaks at 530.0 eV, 531.5 eV and 533.0 eV can be assigned to the surface lattice oxygen, surface-adsorbed oxygen (O2−, O22−, O−) and physically adsorbed oxygen species (O2), respectively [20,24].

|
Download:
|
| Fig. 4. (a) XRD patterns of the samples, N2 adsorption-desorption isotherms of (b) Fe2O3 and (c) Fe2O3/Co3O4 microcubes (the insets are their respective pore size distributions). XPS spectra of hollow Fe2O3/Co3O4 microcubes: (d) Fe 2p, (e) Co 2p and (f) O 1s. | |
In order to evaluate the gas sensing performance of the samples, many tests were carried out on the measurement system (more details can be found in Supporting information). Regarding a gas sensor, working temperatures have a significant impact on its performance. The responses of gas sensors based on pure Fe2O3, Co3O4 and Fe2O3/Co3O4 microcubes towards 20 ppm acetone at different temperatures are shown in Fig. 5a. The results clearly show that the responses of the gas sensors all present a parabolic-like shape. It can be seen that with the working temperature rose, the response of each gas sensor first increased, then reached the maximum and decreased finally. It' not hard to understand that the response towards acetone depends on the balance between the adsorption rate and desorption rate. If the working temperature increases, the adsorption of acetone will be accelerated, thereby enhancing the gas response. When the working temperature rises to a higher level, the desorption rate will be much faster than the adsorption rate, thereby reducing the response. Obviously, from the Fig. 5a, the working temperatures of the Fe2O3, Co3O4 and Fe2O3/Co3O4 microcubes-based gas sensor at their maximum responses towards 20 ppm acetone are 270 ℃, 150 ℃ and 200 ℃, respectively. These always can be used as their optimal working temperatures. Meanwhile, the response of microcubes-based gas sensor is 21.2, which is almost 2.1 and 5.5 times much higher than that of Fe2O3 and Co3O4-based gas sensors at their optimal working temperatures. The above results show that the responses of microcubes-based gas sensor are significantly better than that of Fe2O3 and Co3O4-based gas sensors. Hence, the modification of Fe2O3 by Co3O4 cannot only effectively reduce the working temperature of a Fe2O3-based gas sensor, but also increase its response. Fig. 5b displays the responses of the gas sensors to different concentrations of acetone, e.g., 1, 5, 10, 20, 50, 100 and 200 ppm, at their optimal working temperatures. It is obvious that the microcubes-based gas sensor has the optimum responses towards acetone. As the acetone concentration increases, all the gas sensors show a saturated trend, which is due to the relative saturation of adsorption sites on the sensing materials. Fig. 5c gives dynamic curves of the gas sensors towards low acetone concentrations of 0.1, 0.5, 1, 2, 3, 4, 5 ppm at their optimal working temperature. These curves illustrate that all the gas sensors have good response-recovery properties. Among them, microcubes-based gas sensor also showed superior performance than others, and it still has a response of 1.70 when the acetone concentration is as low as 0.1 ppm. Fig. 5d presents the fitting curves of the concentration (x) versus the response (y) obtained from the Fig. 5c. A good linear relationship and a perfect R2 of 0.995 are given for the microcubes-based gas sensor, indicating a promising application for the quantitative detection of acetone at a low concentration. Fig. 5e showed five cycles of microcubes-based gas sensor towards 1 ppm acetone at 200 ℃, and the response varies slightly, demonstrating its excellent stability for low concentration. In addition, the selectivity is also a key parameter for determining a gas sensor's effectiveness and accuracy. Fig. 5f depicts the responses of the gas sensors to acetone, ethanol, methanol, ammonia and toluene of 20 ppm at 200 ℃, respectively. The microcubes-based gas sensor had the highest response of 21.2 towards acetone, which is ca. 1.8, 4.2, 6.4, 16.2 times larger than that of ethanol, methanol, ammonia, and toluene. This indicates the microcubes-based gas sensor has an outstanding selectivity toward acetone against the other four unwanted gases.

|
Download:
|
| Fig. 5. (a) Responses of Fe2O3, Co3O4 and Fe2O3/Co3O4 microcubes-based gas sensors towards 20 ppm acetone under different working temperatures. (b) The dynamic curves of the gas sensors towards the acetone of 1-200 ppm and (c) 0.1-5 ppm at their optimal working temperature, respectively. (d) The fitting curves of gas sensors to low concentrations of acetone. (e) Repeatability of the microcubes-based gas sensor to 1 ppm acetone gas at 200 ℃. (f) The responses of the gas sensors towards 20 ppm of acetone, ethanol, methanol, ammonia and toluene at 200 ℃. | |
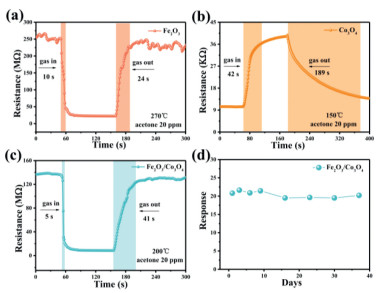
As a real-time monitoring device, the response and recovery times of a gas sensor are other important parameters to pass judgment on the sensing performance for practical applications. Figs. 6a-c illustrate the response and recovery times of the gas sensors to 20 ppm acetone at their optimal working temperatures. Once the acetone was injected into the sealed chamber, the resistance of microcubes-based gas sensor declined swiftly and presents a response time of 5 s, which precedes the Fe2O3-based and Co3O4-based gas sensor by 5 s and 37 s, respectively. When being exposed to the fresh air, the resistances of gas sensors return to their original state gradually, and the recovery time of the microcubes-based gas sensor was 41 s, about 148 s faster than that of the Co3O4-based gas sensor. However, it is 17 s longer than that of the Fe2O3-based gas sensor. This may be due to the high working temperature of Fe2O3-based gas sensor, thus prompting the transmission of gas over its surface and thus leading to a shorter recovery time. Fig. 6d depicts the long-time stability of microcubes-based gas sensor to 20 ppm acetone at 200 ℃. It can be found that the responses to 20 ppm acetone did not change significantly within 37 days, demonstrating that the gas sensor has reliable long-term stability, which will be beneficial to its practical applications. Table S1 (Supporting information) is the comparison of some reported Fe2O3-based gas sensors toward acetone. Taking the response, working temperature and response time into consideration, it is obvious that the microcubes-based gas sensor in this work have advantages in detecting acetone. To ascertain the impact of Co3O4 on the gas sensing properties, the Fe2O3/Co3O4 nanocomposites with different quantity of Co3O4 were also synthesized using the same procedure (details in Supporting information). It found that the compound with moderate content of Co3O4 possesses better sensing performance.

|
Download:
|
| Fig. 6. The resistance of the gas sensors based on (a) Fe2O3, (b) Co3O4 and (c) Fe2O3/Co3O4 microcubes towards 20 ppm acetone at their optimal working temperature, respectively. (d) The long time stability of microcubes-based gas sensor towards 20 ppm acetone at 200 ℃. | |
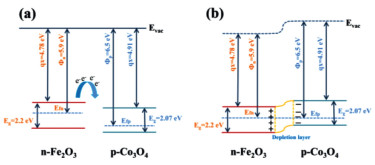
The sensing mechanism of the designed acetone gas sensors can be discussed according to the generally accepted principle at their operating temperatures [18,25]. Based on the results of gas sensing measurements, the microcubes-based gas sensors have enhanced gas sensing performances compared with that of pure Fe2O3 and Co3O4-based gas sensors. This may be explained by the following factors. Firstly, the hollow Fe2O3 /Co3O4 microcubes have a larger specific surface area, abundant mesopores with smaller sizes and more rough surfaces. This can provide more activated sites, and thus facilitates the gas adsorption on their surface so that the gas sensing performances can be enhanced greatly. Furthermore, as shown in Fig. 7, Fe2O3 is a typical n-type semiconductor with a work function of 5.9 eV, and Co3O4 is p-type with a work function of 6.5 eV [26]. The work function of Co3O4 is higher than that of Fe2O3, and thus when they contact with each other to form a p-n heterojunction, the electrons will flow from the Fe2O3 to the Co3O4, and the holes will be transferred from an opposite direction until their Fermi levels reach equilibrium. During this process, the electron concentration changes, leading to an obvious band bending. The p-n heterostructure will produce enhanced charge separation at their contact interface, resulting in an enhanced conductance modulation [27,28]. What is more, the synergistic effect of Fe2O3 and Co3O4 could be another key aspect in improving gas sensing performances. Due to the adding of Co3O4, more lattice mismatches will be generated, and more defects and dangling bonds will be formed at the interface, which will improve the gas sensing performance apparently.

|
Download:
|
| Fig. 7. Schematic of the energy band of the Fe2O3/Co3O4 heterojunction (a) before and (b) after contact. | |
In the study, hollow Fe2O3/Co3O4 microcubes have been prepared by a hydrothermal method followed by an annealing process taking metal-organic framework of PB as a soft template. The hollow microcubes have a side length of around 400 nm and an outer shell of 20-40 nm. Compared with that of pure Fe2O3 and Co3O4, the hollow microcubes-based gas sensor demonstrates enhanced gas sensing performances towards acetone, which could be due to the hollow structure, and the p-n heterojunction formed between Fe2O3 and Co3O4.
Declaration of competing interestThe authors declare that they have no known competing financial interests or personal relationships that could have appeared to influence the work reported in this paper.
AcknowledgementThis work was supported by the National Key Research and Development Project (No. 2019YFC0312602).
Supplementary materialsSupplementary material associated with this article can be found, in the online version, at doi:10.1016/j.cclet.2021.06.062.
| [1] |
D. Zhang, Z. Yang, Z. Wu, G. Dong, Sens. Actuator. B 283 (2019) 42-51. DOI:10.1016/j.snb.2018.11.133 |
| [2] |
D. Han, M. Zhao, J. Alloys Compd. 815 (2020) 152406. DOI:10.1016/j.jallcom.2019.152406 |
| [3] |
Y. Zhang, C. Jia, Q. Kong, et al., ACS Appl. Mater. Interfaces 12 (2020) 26161-26169. DOI:10.1021/acsami.0c04580 |
| [4] |
L. Deng, L. Bao, J. Xu, D. Wang, X. Wang, Chin. Chem. Lett. 31 (2020) 2041-2044. DOI:10.1016/j.cclet.2020.04.033 |
| [5] |
S. Liang, J. Li, F. Wang, et al., Sens. Actuator. B 238 (2017) 923-927. DOI:10.1016/j.snb.2016.06.144 |
| [6] |
Q. Jia, H. Ji, Y. Zhang, et al., J. Hazard Mater. 276 (2014) 262-270. DOI:10.1016/j.jhazmat.2014.05.044 |
| [7] |
X. Kou, N. Xie, F. Chen, et al., Sens. Actuator. B 256 (2018) 861-869. DOI:10.1016/j.snb.2017.10.011 |
| [8] |
F. Wang, H. Li, Z. Yuan, et al., RSC Adv. 6 (2016) 79343-79349. DOI:10.1039/C6RA13876D |
| [9] |
X.H. Jia, C.D. Cheng, S.P. Feng, et al., Appl. Surf. Sci. 481 (2019) 1001-1010. DOI:10.1016/j.apsusc.2019.03.198 |
| [10] |
S. He, C. Yan, X.Z. Chen, et al., Appl. Catal. B 276 (2020) 119138. DOI:10.1016/j.apcatb.2020.119138 |
| [11] |
Z. Li, J.Y. Hu, Y.G. Xiao, et al., Anal. Chim. Acta 1146 (2021) 174-183. DOI:10.1016/j.aca.2020.11.021 |
| [12] |
Z.M. Xu, X.M. Deng, Y. Chen, et al., Sol. RRL 5 (2021) 2000416. DOI:10.1002/solr.202000416 |
| [13] |
H. Wang, X. Wang, R.M. Kong, L. Xia, F. Qu, Chin. Chem. Lett. 32 (2021) 198-202. DOI:10.1016/j.cclet.2020.10.017 |
| [14] |
P.Y. Gao, R. Liu, H.H. Huang, X. Jia, H.B. Pan, RSC Adv. 6 (2016) 94699-94705. DOI:10.1039/C6RA21567J |
| [15] |
Y.Y. Yin, N. Zhang, J. Han, et al., Sens. Actuator. B 297 (2019) 126738. DOI:10.1016/j.snb.2019.126738 |
| [16] |
K. Tian, X.X. Wang, Z.Y. Yu, H.Y. Li, X. Guo, ACS Appl. Mater. Interfaces 9 (2017) 29669-29676. DOI:10.1021/acsami.7b07069 |
| [17] |
W.Y. Li, L.N. Xu, J. Chen, Adv. Funct. Mater. 15 (2005) 851-857. DOI:10.1002/adfm.200400429 |
| [18] |
T.T. Zhou, T. Zhang, J.A. Deng, et al., Sens. Actuator. B 242 (2017) 369-377. DOI:10.1016/j.snb.2016.11.067 |
| [19] |
J. Cao, N. Zhang, S. Wang, H. Zhang, J. Colloid Interface Sci. 577 (2020) 19-28. DOI:10.1016/j.jcis.2020.05.028 |
| [20] |
F. Yang, K.B. Xu, J.Q. Hu, J. Alloys Compd. 729 (2017) 1172-1176. DOI:10.1016/j.jallcom.2017.09.259 |
| [21] |
X.J. Wei, Y.H. Li, H.R. Peng, et al., Chem. Eng. J. 355 (2019) 336-340. DOI:10.1016/j.cej.2018.08.009 |
| [22] |
X.R. Qiao, C. Ma, X. Chang, et al., Sens. Actuator. B 327 (2021) 128926. DOI:10.1016/j.snb.2020.128926 |
| [23] |
M.M. Alam, H.B. Balkhoyor, A.M. Asiri, et al., Surf. Interfaces 20 (2020) 100607. DOI:10.1016/j.surfin.2020.100607 |
| [24] |
Y. Xiang, Y. Zhu, J. Lu, et al., Solid State Sci. 93 (2019) 79-86. DOI:10.1016/j.solidstatesciences.2019.05.008 |
| [25] |
F.H. Zhang, H.Q. Yang, X.L. Xie, et al., Sens. Actuator. B 141 (2009) 381-389. DOI:10.1016/j.snb.2009.06.049 |
| [26] |
Y.J. Kwon, H.G. Na, S.Y. Kang, et al., Sens. Actuator. B 239 (2017) 180-192. DOI:10.1016/j.snb.2016.07.177 |
| [27] |
F. Qu, J. Liu, Y. Wang, et al., Sens. Actuator. B 199 (2014) 346-353. DOI:10.1016/j.snb.2014.04.003 |
| [28] |
C. Li, Z. Chen, W. Yuan, Q.H. Xu, C.M. Li, Nanoscale 11 (2019) 1111-1122. DOI:10.1039/c8nr07041e |