 2021, Vol. 32


b School of Chemical Engineering and Light Industry, Guangdong University of Technology, Guangzhou 510006, China
Lithium-ion batteries (LIBs), as the most widely used energy storage equipment, are mass-produced and applied in portable devices, but the storage of lithium resources in the earth's crust is scarce [1-4]. The sodium element has similar physicochemical properties to lithium and has abundant resource storage. Therefore, sodium-ion batteries (SIBs) are considered one of the most attractive alternatives to lithium-ion batteries (LIBs). Transitional metal sulfides (MxSy) have attracted extensive attention in the development of anode materials for sodium-ion batteries due to their excellent properties of sodium storage. Metal sulfides tend to have higher electrical conductivity than those of their oxides and the M-S bond is weaker than that that of the M-O bond. Hence, the conversion reactions can exhibit fast kinetics during the charge and discharge process of SIBs, especially in 2D transition metal sulfides. Layered molybdenum disulfide (MoS2) is such a typical example, which layer structures provide a large interlayer spacing (0.62 nm) combined with the weak van der Waals interactions between neighboring S-Mo-S layers can promote Na+ migration and alleviate structural deformation during a redox reaction [5-7]. Recently, Rhenium disulfide (ReS2), as a newly emerging member of the 2D TMDs, was found to have similar layer spacing of 0.614 nm to MoS2. Besides, first-principles research results show that the weak coupling of the ReS2 interlayer is more than 25 times weaker than that of MoS2 (18 vs. 460 meV per unit cell). This reveals that ReS2 is more suitable for ionic intercalation for anode material of SIBs [8-10].
However, the inherent drawback of low electrical conductivity of TMDs severely limits their potential applications in SIB. The simplest and most effective way to solve this shortcoming is to mix metal sulfides [11-13]. Compared with single-component metal sulfides, mixed metal sulfides (MMSs) can not only significantly improve the conductivity of the electrode material but also provide abundant lattice mismatches, distortions, and defects at the boundaries of different phases, which can regulate the reaction kinetics of charge carriers [14-17]. Furthermore, dissimilar coupling components have different bandgaps to form the internal electric field (E-field) at the hetero-interfaces, which can overcome the defects of ion transport dynamics caused by the larger ionic radius of Na+ to a certain extent [18,19]. Therefore, the multi-component MMSs anode material with structural heterostructure shows the high reversible capacity and excellent rate performance for Na+ storage [20-22]. Another unavoidable problem of MMSs material is the drastic volume changes electrode materials during the process of continuous insertion, conversion, and/or alloying reaction in the sodium storage mechanism. To address these issues, constructing hollow nanostructure engineering is a reliable strategy for boosting the stability of MMS sodium storage properties [23-26]. Moreover, the large surface area brings by the hollow structure gives accessible electroactive sites and enables the full infiltration of electrolytes [27-30].
Based on all the advantages discussed above, we designed and constructed ReS2@NiS2 heterostructure hollow spheres prepared by hard template method for high-performance SIBs. NiO hollow spheres were synthesized using glucose hydrothermal carbon nanospheres as a sacrificial template. Then few-layered ReS2 nanosheet arrays vertically and uniformly grew on the surface of NiS2 hollow nanospheres. Ultrathin ReS2 nanosheet arrays on the surface can prevent them from restacking and shorten the diffusion distance of sodium ions at the same time. The mixed bimetallic sulfide cannot only improve the electrical conductivity of the electrode material but also promote the electron/ion transport due to the heterostructure. Most importantly, the spherical substrate provides stable support for the overall structure, and the hollow structure provides a buffer space for the volume deformation caused by the subsequent redox reaction. As a result, the NiS2@ReS2 heterostructure hollow sphere exhibited a high specific capacity of 400 mAh/g at the current density of 1 A/g and delivered stable cycling performance even after 220 cycles. Moreover, NiS2@ReS2 exhibited a higher rate capacity at all tested current densities than those of NiS2 and ReS2 single components.
Synthesis of carbon nanosphere (CS) template: Typically, 6 g glucose and 0.4 g cetyltrimethylammonium bromide (CTAB) were dissolved in 50 mL of deionized water by ultrasound and stirring. Transfer the above solution to Teflon-lined autoclave and heat it at 180 ℃ for 12 h. The obtained product was centrifuged and then repeatedly washed with deionized water and ethanol several times. After drying overnight at 60 ℃ in an oven, the final product was collected.
Synthesis of NiO hollow nanosphere: Firstly, prepare 50 mL of 1 mol/L NiCl2 solution, where the solvent is a mixture of water and ethanol with a volume ratio of 1:2. 1 g of carbon nanosphere template was added into the NiCl2 solution at 40 ℃ and stirred for 12 h. The product was collected by centrifugation, washing with deionized water and during in an oven at 60 ℃ overnight. Finally, the product was calcined in a muffle furnace at 500 ℃ for 2 h to remove the template.
Synthesis of NiS2@ReS2 heterostructure: The hollow nanospheres of NiO and sulfur powder were sulfurized at 600 ℃ for 2 h in the argon atmosphere of a tubular furnace with the mass ratio of 1:2. 30 mg of the sulfurized product was added to 40 mL deionized water together with 107.3 mg ammonium perrhenate (NH4ReO4), 160 mg thiourea (CS(NH2)2), and 71.6 mg hydroxylammonium chloride (NH2OH·HCl) and stirred for 2 h. The above solution was transferred to a Teflon-lined stainless autoclave and heated to 240 ℃ and kept for 24 h. After cooling, the product was collected by centrifugation and washed several times with water and ethanol. In order to improve the crystallinity of the product, NiS2@ReS2 was kept at 400 ℃ for 2 h under an argon atmosphere in a tube furnace. The synthesis of pure ReS2 uses the same raw materials and preparation process but does not add NiS2 hollow nanospheres.
Materials characterization: The morphology and internal structure of the sample were characterized by FESEM (JEOL, JSM-7001F) and TEM (JEOL JEM-2100F). The composition and distribution of materials were investigated by energy-dispersive X-ray spectroscopy (EDS). The specific crystal structure and phase identification are performed by XRD (D8 Rigaku9000) at the 2θ range of 5°-80° using Cu-Kα radiation. The chemical bond state of the sample is characterized by XPS (Thermo Scientific K-Alpha) method with Al Kα source.
Electrochemical measurements: The synthesized active material is mixed with acetylene black and the binder (sodium alginate) in a mass ratio of 7:2:1, ground into a slurry, and then coated on the copper foil. A half-cell was assembled in a glove box in an argon atmosphere to test the electrochemical performance of the electrode, in which 1 mol/L NaPF6 in ethylene carbonate (EC), diethyl carbonate (DMC) (1:1, v/v), and 5 vol% of fluoroethylene carbonate (FEC) was used as the electrolyte and Whatman glass fiber as the separator. Galvanostatic charge and discharge test and galvanostatic intermittent titration technique (GITT) are all carried out on the NEWARE battery tester, the voltage range is 0.01 V to 3 V. The GITT test result is the second cycle of the battery. All CV curves and electrochemical impedance spectroscopy (EIS) are performed with an Ivium-n-Stat multichannel electrochemical workstation.
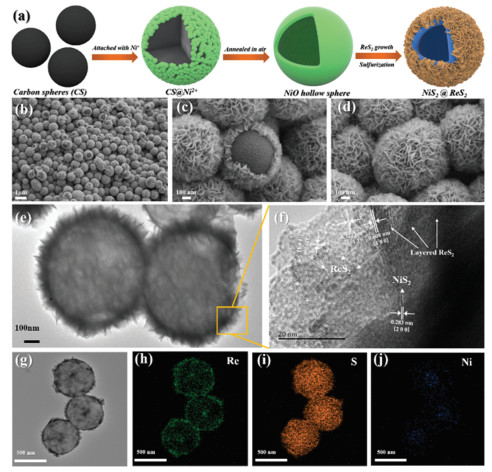
As the fabrication process of NiS2@ReS2 heterostructure shown in Fig. 1a, carbon nanospheres were used as sacrificial hard templates to synthesize NiO hollow sphere precursors. The reason why glucose is selected as the raw material to synthesize carbon nanospheres is that the hydrothermal nanospheres contain abundant functional groups on the outer surface such as hydroxyl or carboxyl groups. These functional groups can easily adsorb a large number of positively charged metal ions in solution [31,32]. The corresponding hollow metal oxide is obtained after removing the carbon template by calcination in the air. The SEM image shown in Figs. S1a and b (Supporting information) reveals that the carbon nanosphere template presents a uniform spherical morphology as expected. The dispersing effect of CTAB on glucose in the solution is the key reason why the diameter of the carbon nanosphere template remains uniform at about 700 nm. The XRD pattern (Fig. S3 in Supporting information) and SEM image in Fig. S1c (Supporting information) confirm the NiO product with hollow nanospheres structure which inherit the similar morphology of the carbon sphere template. Moreover, the SEM image of the broken NiO nanosphere in Fig. S1d (Supporting information) shows that the shell thickness of the hollow sphere is about 80 nm. After the NiO was sulfurized in a tube furnace, ultrathin ReS2 nanosheet arrays were grown on the NiS2 hollow nanosphere substrate by hydrothermal method. Figs. 1b–d show that the ultrathin ReS2 nanosheet arrays successfully and uniformly grows on the outer surface of NiS2 hollow nanospheres. Compared with the SEM images of pure ReS2 with agglomerated structure (Fig. S2 in Supporting information), it can be clearly found that this synthesis strategy effectively prevents the stacking of ReS2 nanosheets.

|
Download:
|
| Fig. 1. (a) The schematic diagram of the fabrication process of NiS2@ReS2 hollow heterogeneous structure spheres. FESEM images with a different magnification of (b-d) NiS2@ReS2 heterostructure hollow nanospheres. (e) TEM image and (f) high-resolution TEM (HRTEM) and (g-j) EDS mapping of the NiS2@ReS2 heterostructure. | |
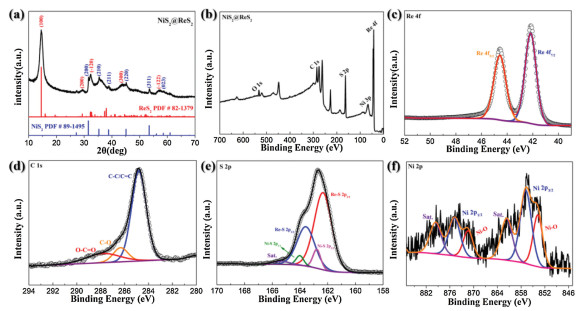
The transmission electron microscopy (TEM) image in Fig. 1e further confirms the hollow spherical structure of NiS2 and the ultrathin sheet of ReS2 uniformly coat externally. According to the high-resolution TEM in Fig. 1f, it can be clearly seen that the marked interatomic distance 0.439 nm, 0.322 nm and 0.608 nm of the external sheet material correspond to the (-1 0 1), (0 -1 2) and (1 0 0) planes of ReS2 respectively. Besides, there is a lattice distance of 0.283 nm corresponding to the (2 0 0) plane of NiS2 in the dark interior. According to the XRD pattern result in Fig. 2a, the existence and distribution of the NiS2 and ReS2 can be proved. As shown in Fig. 2a, strong diffraction peaks at 14.5°, 29.3°, 32.4°, 44.6° and 57.8° respectively correspond to the (1 0 0), (2 0 0), (-1 2 0), (3 0 0) and (-1 2 2) planes in the powder diffraction file No.82-1379 (ReS2). The other weak diffraction peaks at 31.5°, 35.3°, 38.8°, 45.1°, 53.5° and 58.6° correspond to the (2 0 0), (2 1 0), (2 1 1), (2 2 0), (3 1 1) and (0 2 3) planes of the powder diffraction file No.89-1495 (NiS2), respectively. Furthermore, the EDS images in Figs. 1g–j clearly reveal the uniform distribution of the three elements. S element is scattered throughout the material, so the signal is the strongest. The distribution of the Re element clearly shows a hollow shape of the structure. Finally, the signal of the Ni element is weak because it is wrapped by ReS2 nanosheets. Hence, the heterostructure of NiS2 hollow sphere as the inner core and ReS2 as the outer shell is basically established.

|
Download:
|
| Fig. 2. (a) XRD pattern of the NiS2@ReS2 heterostructure. (b) XPS survey spectra of NiS2@ReS2 heterostructure. High-spectra (c) Re 4d, (d) C 1s and (e) S 2p XPS spectra and (f) high-resolution Ni 2p XPS spectra of pure NiS2. | |
In order to investigate the elemental composition and surface chemical state of the material, we conducted an X-ray photoelectron spectroscopy (XPS) measurement. The XPS survey spectrum shown in Fig. 2b indicates that the material is mainly composed of S, Ni and Re. In Fig. 2c, the high-resolution XPS spectrum of the Re 4f shows a set of double peaks at 44.5 eV and 42.2 eV, which correspond to the Re f5/2 and f3/2 in ReS2, respectively. The S 2p XPS spectrum in Fig. 2e shows its two chemical states, in which the strong double peaks correspond to S 2p1/2 and S 2p3/2 of the Re-S bond at 163.6 eV and 162.3 eV, respectively. Then the weak double peaks at 164.0 eV and 162.8 eV are S 2p1/2 and S 2p3/2 of the Ni-S bond. Besides, a small satellite peak at 165.3 eV may be caused by partial oxidation on the sample surface. As shown in Fig. 2d, the peak of the high-resolution C 1s spectrum at a binding energy of 284.8 eV is sp2 hybridized C=C or C-C, and the two other peaks at 287.7 eV and 286.3 eV correspond to two chemical states of O-C=O and C-O [33]. It is worth noting that the Ni 2p spectrum of the NiS2@ReS2 heterostructure is difficult to be detected because the Ni element is inside the structure. Therefore, we performed XPS measurement on the intermediate NiS2 to explore the chemical state of Ni. As can be seen from Fig. 2f, there are two chemical states of Ni, including Ni-S bond and Ni-O bond. The strong double peaks at 874.9 eV and 865.9 eV correspond to Ni 2p1/2 and Ni 2p3/2 of the Ni-S bond. The weak double peaks at 871.4 eV and 853.8 eV correspond to the Ni-O bond due to a small amount of surface oxidation in the air or not complete sulfurization. Finally, there are two satellite peaks due to the shake-up satellites at 879.7 eV and 861.6 eV in the spectrum.
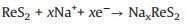
In order to study the sodium storage performance of NiS2@ReS2, cyclic voltammetry and galvanostatic discharge-charge cycling were used to evaluate the electrochemical performance in the SIB. The three-circle CV curve at a scan rate of 0.1 mV/s is shown in Fig. 3a. In the first circle of the CV curve, there are two obvious reduction peaks located at 0.3 V and 1.1 V. The peak at 1.1 V is due to the continuous intercalation of Na+ into the interlayer of ReS2 and the formation of NaxReS2 intermediates, while the peak at 0.3 V corresponds to the continued reaction of NaxReS2 to eventually form Na2S and Re. The specific reaction process is as follows [34]:
|
(1) |

|
(2) |

|
Download:
|
| Fig. 3. (a) Cyclic voltammetry curves of NiS2@ReS2 at a scan rate of 0.1 mV/s. (b) First cycle charge-discharge curves of NiS2@ReS2, NiS2 and ReS2 at a current density of 0.1 A/g. Charge-discharge curves of NiS2@ReS2 at (c) different cycle and (d) current densities. (e) Rate performance of NiS2@ReS2 heterostructure, NiS2 hollow sphere, and pure ReS2. (f) Comparisons of rate performance of ReS2/C nanocomposite [34], 1D TiO2-Nt@ReS2-NS [10], ReS2 nanosheets/rGO [9], Rgo@ReS2@N-C [8], (NSFHCSs) ReS2@C [35], durian-like NiS2 [36] and NiS2@rGO-160 [37]. (g) Long-term cycling performance of NiS2@ReS2 heterostructure, NiS2 and ReS2 at a current density of 1 A/g. | |
The oxidation peak at 1.9 V represents the desodiation of the material and the reformation of the ReS2 process, which remains essentially consistent in subsequent CV curves. For NiS2, the peak strength is not as strong as ReS2 because it is located in the interior of the structure, and the reaction process is described as follows [38]:
|
(3) |

|
(4) |
In the first CV curve, one of the reduction peaks is at 1.4 V, and the other reduction peak exists at 0.9 V in the subsequent CV curve. The pair of oxidation peaks are located at 1.3 V and 2.3 V respectively, corresponding to the two-step reaction of NiS2.
The difference between the first circle of the CV curve and the following scan curve is attributed to the formation of the irreversible solid-electrolyte interphase (SEI), and the high overlap of the subsequent CV curves proves that the material has good reversible performance in the process of Na+ deintercalation. The redox reaction inferred by the CV curve is further confirmed by the NiS2@ReS2 heterostructure and its single-component first cycle charge-discharge curve platform shown in Fig. 3b and Figs. S4 and S5 (Supporting information). It is obviously that the NiS2@ReS2 heterostructure displays higher capacity than those of pure NiS2 and ReS2 electrodes. As shown in Fig. 3c, the charge-discharge curves of the different number of cycles at 1 A/g correspond to the peak position in the CV curve. In the first discharge curve, the two obvious plateaus at 1.3−1.1 V and 0.6−0.5 V correspond to the two reduction peak positions of the first cycle of CV, and the slope change position of the charging curve also coincides with the position of the oxidation peak. Meanwhile, after excluding the first 5 cycles of charging and discharging at 0.1 A/g, the hysteresis from the 20th cycle to the 100th cycle is very small, and the specific capacity retention rate is 84.5%. Figs. 3d and e show the rate performance of bimetallic sulfide NiS2@ReS2 heterostructure hollow spheres and their single components. All the measured current densities were 0.1, 0.2, 0.5, 1, 2 and 5 A/g. We can clearly see that the specific capacity of the heterostructure composite material is higher than that of the single-component electrode at all current densities. At the same time, the specific capacity of the NiS2@ReS2 electrode is almost the same as that of the initial 2–5 cycles when the current density goes from low to high until the final return to 0.1 A/g. To fully demonstrate the performance of the NiS2@ReS2 electrode, the comparison of other recently reported NiS2 or ReS2 composites materials on SIBs is shown in Fig. 3f. Obviously, the NiS2@ReS2 electrode materials have better rate performance than those of NiS2 and ReS2 based electrode materials. At low current density, the specific capacity of NiS2@ReS2 is higher than that of other NIS2 or ReS2 composite materials, while various materials exhibit similar performance at high current densities of 2–5 A/g. This is because at low current density, the enhancement of charge transport by the heterostructure can be more reflected. The long-term cycling performance of the material at a high current density of 1 A/g (the first five cycles at 0.1 A/g) is shown in Fig. 3g. Even after 220 cycles, NiS2@ReS2 still maintains a higher specific capacity of 287.8 mAh/g with retention rate of 81.6%.
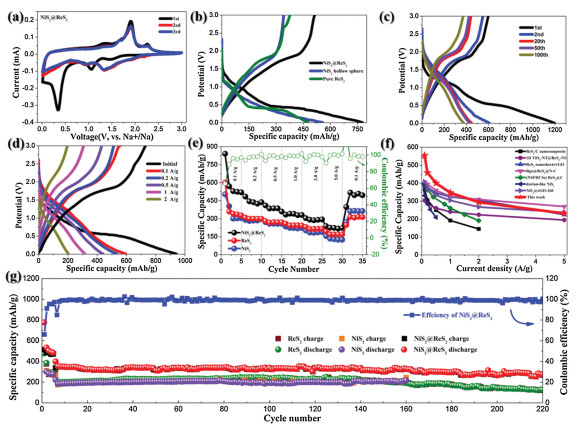
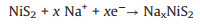
To further explore the discharge mechanism of NiS2@ReS2 electrode in SIB, all the CV curves at different scan rates from 0.1 mV/s to 1 mV/s were summarized and analyzed. As shown in Fig. 4a, there are two obvious redox peaks in all CV curves that gradually become apparent with the increase of the scan rate. From the equation: I=avb, the relationship between the current (i) at the redox peak position and the scan rate (v) can be known. The value of b in the equation ranges from 0.5 to 1. If b is close to 0.5, the electrochemical reaction is basically controlled by ion diffusion, on the contrary, the closer to 1, the pseudocapacitive behavior during the reaction is dominant. As shown in Fig. 4b, the slope b values are obtained by fitting the redox peaks In(v)-In(i) at different scan rates, and the b value of peaks 1 and 2 are 0.985 and 0.936, respectively. Moreover, the specific pseudocapacitive area can be obtained by the equation: i(V) = k1v + k2v1/2. In the equation, k1v represents the capacitive contribution and k2v1/2 represents the diffusion-control contribution. The relationship between the current under the corresponding voltage and the scan rate can be fitted by the equation to get can the parameters k1 and k2 [39]. As shown in Fig. 4c, the capacitance contribution area at 1 mV/s scan rate accounts for 90.64% of the original CV area. The pseudocapacitive contribution rates at remaining scan rate are summarized in Fig. 4d, which are 72%, 80%, 84%, 87% and 88% at 0.1, 0.2, 0.4, 0.6 and 0.8 mV/s, respectively. The NiS2@ReS2 electrode exhibits excellent pseudo-capacitance for two reasons. First of all, the spherical substrate inside the material and the ultra-thin sheet outside provide a highly accessible surface area, which is conducive to accommodate more ions embedded so that enhances the surface redox pseudo-capacitance. Secondly, the microelectronic field composed of two sulfides heterostructures at the interface enhances the transport kinetics of ions, while the hierarchical hollow nanostructure is more conducive to the process of concomitant faradaic charge-transfer [40,41].

|
Download:
|
| Fig. 4. (a) CV profiles of NiS2@ReS2 at different scan rate. (b) Pseudocapacitive area under the CV curve at a scan rate 1 mV/s. (c) 3D bar graph of pseudocapacitive contribution rate at different scan rates. (d) ln(peak current) versus ln(scan rate) plots at different redox states. | |
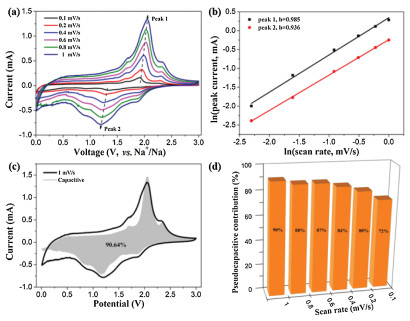
As shown in Fig. 5a, the electrochemical dynamical behavior of sodium-ion battery with NiS2@ReS2 heterostructure electrode was analyzed by electrochemical impedance spectroscopy (EIS). Use the equivalent electrical circuit in the lower right corner of the Fig. 5a to fit the EIS data. All curves are composed of a semicircle in the high-frequency region and an inclined straight line in the low-frequency region. The semicircular curve reflects the charge transfer resistance between electrode and electrolyte, while the straight slope represents the diffusion resistance of Na+. Before the battery cycle, the electrode shows a large resistance, but the resistance after the cycle is far less than before. This is because of the formation of solid electrode interface on the electrode surface after cycling, and the heterostructure microelectronic field provides a positive effect on ion transport. After that, the electrode resistance gradually increases with the battery cycle, which may be attributed to the partial dissolution of the solid electrode interface. However, the electrode resistance is still much lower after 100 cycles than before. Besides, the linear slope of all curves in the low-frequency region is basically the same, which proves that the diffusion of Na+ is always stable. Through a galvanostatic intermittent titration technique (GITT), we further explored the changes in Na+ diffusion behavior during charge and discharge. In the GITT measurements shown in Fig. 5b, the battery alternates between 10 min of constant current charge and discharge at a current density of 0.1 A/g and 30 min of open-circuit rest until a cycle between 0.01 V and 3 V is completed. The diffusion constant of Na+ is calculated by the following equation:

|
(5) |

|
Download:
|
| Fig. 5. (a) Nyquist plot of the NiS2@ReS2 electrodes before the cycling tests and after different cycles at 1 A/g. (b) Detailed voltage response of NiS2@ReS2 electrode during a single current pulse with time. (c) Diffusion coefficient of Na+ and (d) charge-discharge curve in GITT measurement of NiS2@ReS2 electrode. (e) Schematic illustration of the sodiation/desodiation process in NiS2@ReS2 heterostructures. | |
In the equation m is the mass, M is molar mass, VM is the molar volume of the sample, A is the total surface area of the electrode and τ is the time to apply the current pulse [42-46]. The value of the voltage drops between the initial state and the steady-state (ΔEs) and the total change of the cell voltage during a constant pulse time (ΔEx) can be intuitively seen from the detailed voltage response of the electrode during a single current pulse and two holds in Fig. 5c. The result of Na+ diffusion coefficients (DNa+) calculated during all pulses are shown in Fig. 5d. During the discharge process, the DNa+ does not change much, and the obvious decrease around 0.3 V and 1.2 V may be attributed to the formation of the mesophase in the reaction of NiS2 and ReS2. The DNa+ continues to decrease in the charging process, which is due to the insertion of Na+ tends to be saturated gradually. Fig. 5e demonstrates the possible sodiation/desodiation process of NiS2@ReS2 heterostructure.
In summary, we have successfully designed and synthesized NiS2@ReS2 heterostructure anode materials for sodium-ion batteries with the combination of internal NiS2 hollow spheres and external ultrathin ReS2 nanosheet arrays. The NiS2@ReS2 heterostructure displays excellent electrochemical performance, which are in good line with the design principle of the heterostructure. While assessing as anode materials of SIBs, the NiS2@ReS2 heterostructure delivered good rate capacity (238 mAh/g at 5 A/g) and stable long-term cycling performance (287.8 mAh/g at 1 A/g after 220 cycles), which come from the high conductivity of the bimetallic sulfides and the ultrafast Na+ transport kinetics at the heterogeneous interface by the two components. Moreover, the surface faradaic charge-transfer reactions brought about by the complex three-dimensional structure gives the material surprising pseudocapacitive properties.
Declaration of competing interestThe authors report no declarations of interest.
AcknowledgementThis work was supported by the Natural Science Foundation of Guangdong Province (No. 2020A1515010886).
Appendix A. Supplementary dataSupplementary material related to this article can be found, in the online version, at doi: https://doi.org/10.1016/j.cclet.2021.04.011.
| [1] |
Q.X. Deng, M.Q. Wang, Z.L. Peng, et al., J. Colloid Interface Sci. 585 (2021) 51-60. DOI:10.1016/j.jcis.2020.11.052 |
| [2] |
H.J. Liang, J.Y. Wu, M.Q. Wang, et al., Dalton Trans. 49 (2020) 13311-13316. DOI:10.1039/D0DT02373F |
| [3] |
X.L. Liu, J.Y. Wu, M.Q. Wang, et al., Ceram. Int. 46 (2020) 27608-27615. DOI:10.1016/j.ceramint.2020.07.255 |
| [4] |
X. Yang, Y.Y. Wang, B.H. Hou, et al., Acta Metall. Sin. (Engl. Lett.) 34 (2021) 390-400. DOI:10.1007/s40195-020-01001-7 |
| [5] |
S. Gong, G.Y. Zhao, N.Q. Zhang, K.N. Sun, ChemElectroChem 6 (2019) 3393-3400. DOI:10.1002/celc.201900783 |
| [6] |
Y.Y. Wang, W.P. Kang, P. Ma, et al., Mater. Chem. Front. 4 (2020) 1212-1221. DOI:10.1039/C9QM00735K |
| [7] |
Y.Q. Teng, H.L. Zhao, Z.J. Zhang, et al., ACS Nano 10 (2016) 8526-8535. DOI:10.1021/acsnano.6b03683 |
| [8] |
B. Chen, H. Li, H.X. Liu, et al., Adv. Energy Mater. 9 (2019) 1901146. DOI:10.1002/aenm.201901146 |
| [9] |
S. Liu, Y. Liu, W.W. Lei, et al., J. Mater. Chem. A 6 (2018) 20267-20276. DOI:10.1039/C8TA08206E |
| [10] |
X.Q. Wang, B. Chen, J. Mao, et al., Electrochim. Acta 338 (2020) 135695. DOI:10.1016/j.electacta.2020.135695 |
| [11] |
J. Liu, Y.G. Xu, L.B. Kong, et al., J. Colloid Interface Sci. 575 (2020) 42-53. DOI:10.1016/j.jcis.2020.04.074 |
| [12] |
Y.J. Fang, D.Y. Luan, X.W. Lou, Adv. Mater. 32 (2020) e2002976. DOI:10.1002/adma.202002976 |
| [13] |
L.D. Shi, D.Z. Li, P.P. Yao, et al., Small 14 (2018) 1802716-1802725. DOI:10.1002/smll.201802716 |
| [14] |
L. Cao, X.H. Liang, X. Ou, et al., Adv. Funct. Mater. 30 (2020) 1910732. DOI:10.1002/adfm.201910732 |
| [15] |
G.Z. Fang, Q.C. Wang, J. Zhou, et al., ACS Nano 13 (2019) 5635-5645. DOI:10.1021/acsnano.9b00816 |
| [16] |
Y.M. Lin, Z.Z. Qiu, D.Z. Li, et al., Energy Storage Mater. 11 (2018) 67-74. DOI:10.1016/j.ensm.2017.06.001 |
| [17] |
B.H. Hou, Y.Y. Wang, D.S. Liu, et al., Adv. Funct. Mater. 28 (2018) 1805444-1805453. DOI:10.1002/adfm.201805444 |
| [18] |
Y.W. Liu, T.F. Zhou, Y. Zheng, et al., ACS Nano 11 (2017) 8519-8526. DOI:10.1021/acsnano.7b04617 |
| [19] |
C.Z. Zhang, F. Han, J.M. Ma, et al., J. Mater. Chem. A 7 (2019) 11771-11781. DOI:10.1039/C9TA02388G |
| [20] |
P. Prabhu, V. Jose, J.M. Lee, Matter 2 (2020) 526-553. DOI:10.1016/j.matt.2020.01.001 |
| [21] |
Y. Zhang, Q. Zhou, J.X. Zhu, et al., Adv. Funct. Mater. 27 (2017) 1702317. DOI:10.1002/adfm.201702317 |
| [22] |
Y.Z. Liu, C.H. Yang, Q.Y. Zhang, M.L. Liu, Energy Storage Mater. 22 (2019) 66-95. DOI:10.1016/j.ensm.2019.01.001 |
| [23] |
J.M. Jiang, G.D. Nie, P. Nie, et al., Nano-Micro Lett. 12 (2020) 183. DOI:10.1007/s40820-020-00521-2 |
| [24] |
H.Q. Liu, K.Z. Cao, W.Y. Li, et al., J. Power Sources 437 (2019) 226904. DOI:10.1016/j.jpowsour.2019.226904 |
| [25] |
X.H. Liu, W.H. Lai, S.L. Chou, Mater. Chem. Front. 4 (2020) 1289-1303. DOI:10.1039/C9QM00674E |
| [26] |
H.S. Fan, H. Yu, Y.F. Zhang, et al., Nano Energy 33 (2017) 168-176. DOI:10.1016/j.nanoen.2017.01.043 |
| [27] |
J.W. Nai, X.W. Lou, Adv. Mater. 31 (2019) e1706825. DOI:10.1002/adma.201706825 |
| [28] |
W.H. Ren, D.N. Liu, C.L. Sun, et al., Small 14 (2018) e1800659. DOI:10.1002/smll.201800659 |
| [29] |
S. Fan, S.Z. Huang, Y.X. Chen, et al., Energy Storage Mater. 23 (2019) 17-24. DOI:10.1016/j.ensm.2019.05.043 |
| [30] |
H.S. Fan, H. Yu, Y.F. Zhang, et al., Energy Storage Mater. 10 (2018) 48-55. DOI:10.1016/j.ensm.2017.08.006 |
| [31] |
Y.M. Liu, X. Li, Y.L. Wang, et al., Sens. Actuators B: Chem. 319 (2020) 128299. DOI:10.1016/j.snb.2020.128299 |
| [32] |
S. Zhang, L.J. Zhao, B.Y. Huang, X.G. Li, Sens. Actuators B: Chem. 319 (2020) 128264. DOI:10.1016/j.snb.2020.128264 |
| [33] |
H.S. Fan, H. Yu, Y.F. Zhang, et al., Angew. Chem. Int. Ed. 56 (2017) 12566-12570. DOI:10.1002/anie.201706610 |
| [34] |
Y. Von Lim, S.Z. Huang, Q.Y. Wu, et al., Nano Energy 61 (2019) 626-636. DOI:10.1016/j.nanoen.2019.04.041 |
| [35] |
X. Zhang, C. Shen, H. Wu, et al., Energy Storage Mater. 26 (2020) 457-464. DOI:10.1016/j.ensm.2019.11.019 |
| [36] |
K.J. Zhu, G. Liu, Y.J. Wang, et al., Mater. Lett. 197 (2017) 180-183. DOI:10.1016/j.matlet.2017.03.087 |
| [37] |
K. Li, J.H. Yu, Q.Y. Wang, et al., Nanotechnology 32 (2021) 195406. DOI:10.1088/1361-6528/abde04 |
| [38] |
T.T. Vu, S. Park, J. Park, et al., J. Mater. Chem. A 8 (2020) 24401-24407. DOI:10.1039/D0TA09801A |
| [39] |
V. Augustyn, P. Simon, B. Dunn, Energy Environ. Sci. 7 (2014) 1597-1614. DOI:10.1039/c3ee44164d |
| [40] |
H. Liu, D. Zhao, P. Hu, X. Wu, Chin. Chem. Lett. 29 (2018) 1799-1803. DOI:10.1016/j.cclet.2018.11.019 |
| [41] |
M. Dai, D. Zhao, X. Wu, Chin. Chem. Lett. 31 (2020) 2177-2188. DOI:10.1016/j.cclet.2020.02.017 |
| [42] |
S.W. Fan, G.D. Li, F.P. Cai, G. Yang, Chemistry 26 (2020) 8579-8587. DOI:10.1002/chem.202000418 |
| [43] |
P. Li, J.Y. Hwang, Y.K. Sun, ACS Nano 13 (2019) 2624-2633. DOI:10.1021/acsnano.9b00169 |
| [44] |
Z.T. Li, Y.F. Dong, J.Z. Feng, et al., ACS Nano 13 (2019) 9227-9236. DOI:10.1021/acsnano.9b03686 |
| [45] |
J.J. Wang, L.G. Wang, C. Eng, J. Wang, Adv. Energy Mater. 7 (2017) 1602706. DOI:10.1002/aenm.201602706 |
| [46] |
Y. Liu, D. Zhao, H. Liu, et al., Chin. Chem. Lett. 30 (2019) 1105-1110. DOI:10.1016/j.cclet.2018.12.024 |