 2021, Vol. 32


b School of Physics and Electronics, Hunan University, Changsha 410082, China;
c School of Physics and Electronic Engineering, Xinyang Normal University, Xinyang 464000, China
Along with the rapid development of information technology and artificial intelligence, the electrical energy storage (EES) devices are gaining greater importance, which are the key factors that determine the miniaturization, long-life and high safety of electronic products [1-4]. At present, lithium-ion batteries (LIBs), after several dozen years development, have been the primary power source for portable electronics, electric vehicles and smart grids. However, the great demand for LIBs has been limited by its low abundance, uneven distribution and relatively high cost [5-9]. In this regard, other batteries based on earth-abundant elements such as sodium, potassium, and magnesium have become favorable alternatives and supplements for LIBs in the further EES system. It has been found that both potassium and lithium have similar chemical property, that is, potassium-ion batteries (KIBs) can be operated using principles similar to LIBs [10-14]. In other word, K+ ions commute between the cathode and the anode in a rocking-chair manner during the charge/discharge processes. More importantly, the natural abundance of potassium, similar redox potential of potassium to lithium and low cost also gives KIBs a better prospect for practical applications. In addition, the low redox potential (−2.93 V vs. E0) enables KIBs to have a higher discharge voltage platform as well as a higher energy density compared to LIBs, which gives them a great advantage over other energy storage technologies especially in large scale energy storage systems [15-18].
Up to now, various cathode and anode materials have been investigated for KIBs. In terms of cathode electrode, the common intercalated-type cathode materials including layered metal oxides, polyanions and prussian blue analogue still face the problem of inferior capacity (lower than 100 mAh/g). That is due to the intrinsic drawback of intercalation-type cathodes, which is only accommodate one potassium ion per transition metal core [19, 20]. Compared intercalated-type materials, conversion-reaction-type materials been verified to be capable of delivering much higher capacities because they can hold more than one K+ per transition metal core, resulting in higher theoretical capacities. However, reports on this aspect are quite rare. Fluoride, like CFx, FeFx, as a typical high-voltage and high-capacity conversion-reaction-type cathode materials, was firstly introduced into LIBs [20-22]. After that, they were also applied to KIBs, for example, CFx as a high capacity conversion-reaction-type cathode for KIBs was investigated, which delivers a remarkable discharge capacity of > 250 mAh/g at 20 mA/g [23]. But, its inferior cyclic capacity, stemmed from the structure collapses of irregular particulate material during the cycle, limits the further application, which is also the main problem faced by electrode materials of KIBs. More precisely, since the size of K+ (1.38Å) is much larger than Na+ (1.02Å) and Li+ (0.76Å), the electrode materials of KIBs usually have to withstand more severe swelling during cycling [24]. Therefore, common conversion-type materials, like fluoride, still suffer from the huge volume changes during the cycling process and cannot be introduced to KIBs from LIBs in parallel.
Recently, researchers found that transition metal dichalcogenides (TMDCs), such as CoS2 [25], TiSe2 [26], FeSe2 [13], MoSe2 [27], have an appropriate lamellar crystal structure to facilitate K+ insert, thereby reducing the structural damage of the material. These materials have been widely used in anode materials for KIBs [18, 27, 28]. However, the electro-chemical polarization and the problem of anode electrode matching caused by their naturally high voltage platform make it difficult to use them as a reasonable anode electrode. For example, When MoSe2 is used as the anode electrode [27], its discharge platform is higher than 1.5 V, while FeSe2 is higher than 2 V [13, 29]. In this regard, these materials with a high discharge platform can also be actively used in the cathode electrode, so as to be fully investigated for conversion-reaction-type materials. Apart from the high voltage platform, another issue that needs our attention is how to overcome low conductivity and realize the superiority of TMDCs. To this end, researchers often combine the TMDCs with other electrically conductive materials. For example, MoSe2/amorphous carbon composite was used for KIBs, showing that amorphous carbon layer outside the active material can improve the electrical conductivity of the composite and enhance electrochemical performances [27]. However, the tightened carbon-coating structure is still unable to withstand large volume changes (≈ 200%) for large K+ [30, 31]. Recently, the yolk-shell structure received wide attention for alkali metal ion battery, in which the integrated carbon shell can provide the extra void space for the inner active material to accommodate the large volume expansion during cycling. Compared with other structures, this yolk-shell structure has obvious advantages, especially in improving the performance of KIBs [19].
Herein, based on the electrochemical mechanism of KIBs, we prepared architecturally yolk-shelled FeSe2@N-doped carbon nanoboxes (FeSe2@C NBs) through template etching and hydrothermal selenization strategy as the conversion-reaction-type cathode materials for KIBs. Furthermore, by controlling the etching time, the optimal content of FeSe2 in a carbon nanobox was obtained, which can provide the suitable void space to accommodate the large volume variation of FeSe2 and maintain the integrity of the electrode structure. More importantly, the integrated N-doped carbon shell can not only enhance the electrical conductivity and facilitate electrons/ions transfer but also restrain the agglomeration of FeSe2. Benefiting from these favorable effects, when explored as the cathode materials for KIBs, the FeSe2@C NBs electrode endow them with a high energy density of about 411 Wh/kg, a high specific capacity of 257 mAh/g at 100 mA/g, a remarkable rate performance of 128 mAh/g at 1000 mA/g, and ultra-long cycling stability 221 mAh/g after 700 cycles, together with a decay rate of 0.02% per cycle. Here, we use a typical template method to prepare Fe3O4@C nancubes (Fe3O4@C NCs). First of all, Fe2O3 nanocubes template was synthesized by a typical hydrothermal method [32]. Next, 400 mg pre-prepared Fe2O3 nanocubes and 200 mg of polydopamine (PDA) hydrochloride were uniformly dispersed in a 500 mL Tris-buffer solution with a concentration of 10 mmol/L. The above solution was sufficiently ultrasonic treatment and stirred under dark conditions for 12 h at room temperature. The resultant product was centrifuged in ethanol and deionized water, following by dried at 70 ℃ overnight and the Fe2O3@PDA nanocubes (Fe2O3@PDA NCs) were obtained. Finally, the obtained Fe2O3@PDA NCs were annealed at 450 ℃ for 2 h with an Ar environment, and then the core-shelled Fe3O4@C NCs were obtained.
To achieve the purpose of yolk-shell structure, an etching treatment is important. Here, the obtained Fe3O4@C NCs were dispersed into a HCl solution with a concentration of 4 mol/L, and then ultrasonic treatment for 30 min at a power of 150 W. The yolk-shelled Fe3O4@C NBs were obtained. Notably, in order to get the optimal structure, different etching times (10 min and 20 min) are also carried out for comparison. Next, 200 mg selenium powder was dispersed in 5 mL hydrazine hydrate (80%) and stirred until completely dissolved at a hot plate of 80 ℃. Meanwhile, the 100 mg of Fe3O4@C NBs was dispersed in a 40 mL solution of water and ethanol (1:1, v/v), and then the solution of hydrazine hydrate with selenium is added drop by drop. After stirring the above mixture at room temperature for 10 min, add it into a 100 mL Teflon-lined stainless-steel autoclave for hydrothermal reaction 12 h at 150 ℃. The final product is centrifuged several times with deionized water and ethanol to obtain the yolk-shell FeSe2@CNBs. The pure FeSe2 was also synthesized through an identical selenizing method, and just replace 100 mg Fe3O4@C NBs with 100 mg Fe2O3 nanocubes.
The morphologies and nanostructure of the prepared samples were investigated by field-emission scanning electron microscope (SEM, Hitachi S-4800) and transmission electron microscopy (TEM, Tecnai F20 equipped with energy dispersive Spectrometer). The crystal structure of the sample was tested by a Bruker D8 Focus X-ray diffractometer (XRD) system. The surface chemistry was identified by X-ray photoelectron spectrometer (XPS, PHI-1600). A thermogravimetric analyzer (TGA-600) was used to test the TGA curve in air.
Here, we made the cathodes from the active material (FeSe2@C NBs and pure FeSe2) for battery test cells. Firstly, the work electrode slurry was prepared by mixing active materials, ketjen black and polyVinylidene fluoride (PVDF) binder with a weight ratio of 8:1:1. Next, the mixed slurry was evenly applied to an aluminum collector and vacuum dried in 80 ℃ for overnight. And the average active materials load on each working sheet is about 0.8–1.1 mg/cm2. The separator used the Whatman GF/D glass fiber to separate the anode and cathode, and a 3 mol/L potassium bis(fluoroslufonyl) imide (KFSI) dissolved in dimethyl ether (DME) was applied for as the electrolyte. The half cells of using 2032 coin cells were assembled in a glove box filled with Ar gas, and then used potassium metal as the counter electrode. The electrochemical performances was tested by Arbin 2000 battery tester with 0.7–3.0 V vs. K/K+. In an electrochemistry workstation (Prinston Versa STAT MC electrochemistry workstation), the cyclic voltammetry (CV) and (electrochemical impedance spectroscopy) EIS measurements were performed. All the electrochemical tests were measured at room temperature and all the capacities of KIBs were calculated by the weight of activity materials.
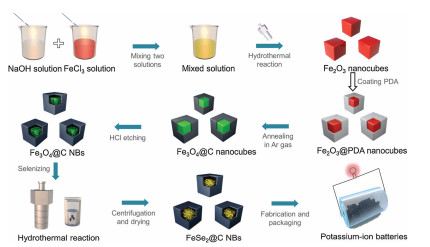
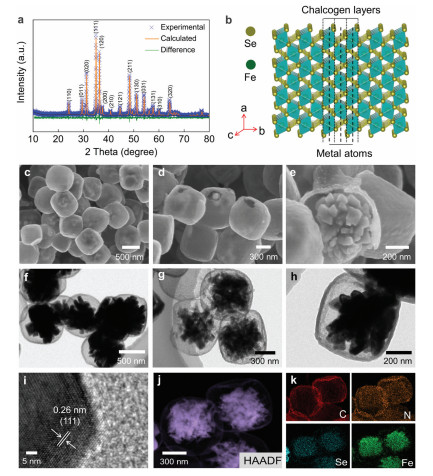
As shown in Fig. 1, the synthesis diagrams are displayed, which details the fabrication process of the yolk-shelled FeSe2@C NBs by template method. To be specific, by mixing FeCl3 and NaOH solutions and carrying out a full hydrothermal reaction at 100 ℃ for 4 days, the Fe2O3 nanocubes template is first synthesized. Next, by PDA coating and sintering in Ar atmosphere (450 ℃ for 2 h), we get the core-shelled Fe3O4@C NCs. Here, 'C' is a nitrogen-doped carbon layer, which comes from the amino group contained in PDA. In order to obtain the optimal yolk-shell structure to buffer the volume expansion of the potassiation process, we carried out an etching investigation on Fe3O4@C NCs. Combined with the increase in volume after Fe3O4 selenization and the approximately 200% volume expansion after potassiation, we found that the composite with 30 min etching time has the optimal structure through SEM image analysis. Finally, by a simple hydrothermal selenization, FeSe2@C NBs was obtained. Here, compared with other high-temperature sintering methods (> 300 ℃) [6, 28, 29, 33], our low-temperature (150 ℃) hydrothermal selenization method not only is a safe and environmentally friendly method but can effectively prevent the production of other multi-selenium compounds to obtain a prefect crystalline phase. Notably, the low-temperature reaction can better maintain the structure of the material and improve the performance of the battery. The low-temperature selenization method can be confirmed by X-ray diffraction (XRD) of the sample. In Fig. 2a, the XRD pattern is fully consistent with orthorhombic FeSe2 (JCPDS No. 79-1892). Here, N-doped carbon has a very weak peak relative to FeSe2, so it is not obvious. By using GSAS2 refinement software, Rietveld refinement conducted on the FeSe2@C NBs sample revealed the lattice parameters c to be 5.7156Å, which represent a perfect fit to that of the standard FeSe2 samples (c = 5.715 Å); thus, this confirms the high level of chemical purity of the produced samples. The Rietveld refinement results of Rwp and GOF value is 13.089 and 1.06, respectively. In addition, the corresponding description has been added to the manuscript. In Fig. S1 (Supporting information), the XRD pattern of pure FeSe2 is also consistent with orthorhombic FeSe2 (JCPDS No. 79-1892), which further verified that low-temperature hydrothermal selenization is a feasible solution. Meanwhile, the crystal structure of FeSe2 is shown in Fig. 2b. TMDCs like FeSe2, their metal atoms are sandwiched between two chalcogen layers. According to previous reports [25, 26], this lamellar crystal structure allows K+ to insert and extract conveniently compared to other structures. To better analyze the various components of FeSe2@C NBs and pure FeSe2, thermogravimetric (TG) analysis were given as exhibited in Fig. S2a (Supporting information). Here, the TG was measured from 0 ℃ to 1000 ℃ under air environment with a heating rate of 10 ℃/min. The two TG curves consistently show a slight rise around 300 ℃ due to the formation of FeSe2O3 [34]. Subsequently, with the disappearance of carbon and the formation of the final product Fe2O3, the curve begins to decline significantly [35], which stabilize after the temperature reaches 500 ℃. In the end, FeSe2@C NBs and pure FeSe2 attenuate 47.6% and 65.4% of their initial mass, respectively, resulting in a carbon content of approximately 17.8 wt% in FeSe2@C NBs. The relatively high carbon content can effectively compensate for the low conductivity of FeSe2 and promote ion and electron transport. Furthermore, the FeSe2@C NBs sample was explored by X-ray photoelectron spectroscopy (XPS) in Figs. S2b–f (Supporting information).

|
Download:
|
| Fig. 1. The overall schematic for the preparation of yolk-shelled FeSe2@C NBs involving a template coating, high-temperature carbonization, as well as low-temperature hydrothermal selenization process. | |

|
Download:
|
| Fig. 2. X-ray diffraction (XRD) of (a) FeSe2@C NBs and (b) the corresponding molecular structure of FeSe2. (c–e) SEM images and (f–h) TEM images of the obtained FeSe2@C NBs with different magnifications. (i) HRTEM images of FeSe2@C NBs. (j, k) EDS mapping of C, Co and P. | |
The survey spectra (Fig. S2b) shows the existence of the Fe, O, N, C, and Se elements, and the presence of O element is due to the oxygen adsorbed on the sample surface. In the high-resolution Fe 2p spectrum (Fig. S2c), two sharp peaks located at about 719.7 and 706.7 eV is corresponding with the characteristic peaks of FeSe 2, and the peaks at 725.5 and 711.5 eV were attributed to Fe3+, the peaks of Fe2+ is related the 719.6 and 706.6 eV. The Se fitting lines (Fig. S2d) mean that the FeSe2@C NBs had the core-level band of the Se 3d region. The peaks at 54.6 and 55.4 eV are related to the Fe-Se band and Se-Se band, respectively. Meanwhile, the peak at 58.8 eV (Se-O band) indicates the existence of oxidation state of Se compounds. In C 1s spectra (Fig. S2e), four peaks located at 296.1, 286.5, 285.1 and 284.4 eV were derived from C=O, C-O, C-C and C=C, respectively. In Fig. S2f, N 1s spectrum shows three peaks at 400.7, 399.8 and 398.4, which is corresponding with the graphite N, pyrrole-N & σ(Fe-N) and pyridinic N, respectively [29, 33, 36-38]. Meanwhile, in Fig. S3 (Supporting information), the Raman spectraof FeSe2@C NBs shows two main peaks located 1370 and 1587 cm−1, which is corresponding to sp2 carbons in defect (D band) and graphitic regions (G band), respectively.
In Figs. 2c–k, the morphology and structure are further explored by using the scanning electron microscopy (SEM) and transmission electron microscopy (TEM). Figs. 2c–e show the SEM images of as-obtained FeSe2@C NBs with different magnification, where the samples presents a highly uniform cube structure with an average particle size of ≈ 550 nm. In Figs. 2c and d, the dense N-doped carbon shell completely envelops FeSe2 and the FeSe2 within could be faintly seen. In particular, the yolk-shell structure is clear in Fig. 2e and from the broken carbon shell, it can be seen that the FeSe2 inside presents a rod-like aggregate. In addition, we can observe that the carbon shell is very thin, which contributes a low percentage of carbon content, giving the active material a higher theoretical battery capacity. TEM images with different magnification are shown in Figs. 2f–h. The yolk-shell structure is very obvious in TEM images and the carbon shell still leaves enough space for the volume change of FeSe2. Moreover, the carbon shell is a prefect nanocavity, which can prevent FeSe2 from smashing and falling apart. From Figs. 2g and h, it can be seen that FeSe2 materials show obvious mesoporous characteristics, which is very advantageous for inserting and extracting of K+. Besides, we can see that 30 min of etching time can leave a uniform and suitable interior space. To compare the effects of different etching times, the SEM images of 10- and 20-min etching times were also shown in Fig. S4 (Supporting information). During the process of selenization, the volume of Fe3O4 is greatly increased when converted into FeSe2. For 10-min etching time (Figs. S4a and b), the internal huge FeSe2 block is directly exposed to the electrolyte by bursting the carbon shell, resulting in poor cycling performance. With regard to 20-min etching time (Figs. S4c and d), although FeSe2 is still confined to the carbon shell, the SEM images show that FeSe2 basically fills the entire carbon chamber. In this case, the yolk-shell structure similar carbon coated structure and there is no enough room for FeSe2 to change freely. Therefore, from a structural point of view, 30-min etching time is the most appropriate parameter. The SEM image and XRD pattern of this etched Fe3O4@C NBs is shown in Figs. S5a and b (Supporting information). We can clearly see that 30-min of ultrasonic etching did not change the yolk-shell structure, and the strong carbon skeleton can still support the internal materials well. In addition, the recessed carbon shell indicates that the etching process can leave a good internal expansion space. Meanwhile, all of the diffraction peaks match well with the normal characteristic diffractions of the Fe3O4 inverse spinel structure (PDF No. 89-0691). In Fig. S6 (Supporting information), the SEM images of pure FeSe2 clusters without carbon shell are shown, which shows a disorganized structure. Furthermore, the measured neighboring interplanar spacing is 0.26 nm from the HRTEM image in Fig. 2i, and can be indexed to the (111) plane of orthorhombic FeSe2. The elemental mapping images of FeSe2@C NBs (Figs. 2j and k) display that C, N, Se and Fe elements are evenly distributed. The presence of element N comes from the use of PDA and hydrazine hydrate during the preparation process. In Fig. S7 (Supporting information), the EDS spectra also prove the existence of the several elements.
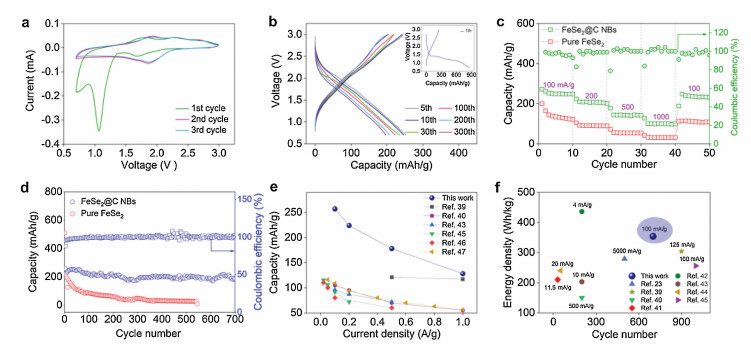
In order to demonstrate the real feasibility of our presented structure in KIBs, the electrochemical properties of FeSe2@C NBs cathode were examined. In Fig. 3a, the CV curves of initial three discharge/charge cycles was performed at a scan rate of 0.1 mV/s between 0.8 V to 3.0 V. In order to study the phase transition of FeSe2/N-C NBs during charge and discharge, we compared the XRD diffraction peaks of the electrode at the beginning and after the cycle (Fig. S8 in Supporting information). We find that after a continuous cycle, the final discharge product cannot exhibit the peak of FeSe 2, but there are obvious peaks of Se, K2Se and K2Se2. Combined with the previous studies [13, 29], the detailed reaction mechanism of charges and discharges can be expressed. In the first cycle, two obvious peaks located at 1.7 and 1.08 V in cathodic scan are most probably correspond to the conversion reaction of 3FeSe2 + xK+ + xe− → KxFe3Se4 + 2Se and KxFe3Se4 + (8 - x)K+ + (8 - x)e− → 4K2Se + 3Fe, which attributed to the generation of K2Se and Fe, and the formed of SEI layer decomposed by the electrolyte. In the following cycles, the sharp peak (1.08 V) shifts to 1.78 V, indicating an activation process and the irreversible formation of an SEI film during the first cycle. In first anodic cycle, two oxidation peaks at 1.8 and 2.26 V are assigned to the reaction of 3Fe + 4K2Se → KxFe3Se4 + (8 - x)K+ + (8 - x)e− and KxFe3Se4 → Fe3Se4 + xK+ + xe−. The following CV profiles showed tiny change after the first cycle, which implies the high reversible electrochemical reaction of FeSe2@C NBs. Meanwhile, the charge/discharge profiles of FeSe2@C NBs anode at 100 mA/g was shown to further elucidate the electrochemical process of FeSe2@C NBs electrode (Fig. 3b). We have given charge/discharge curves with the 1st, 5th, 10th, 30th, 100th, 200th and 300th cycles, and from the first cycle (the insertion figure), a low Coulomb efficiency (~30.8%) is attributed to the formation of SEI film. However, the Coulomb efficiency of following cycles is close to 100%, and it can still maintain a high efficiency even the 300th cycles, implying a good cyclic stability. The rate performance of FeSe2@CNBs electrode was further evaluated in Fig. 3c. With changes in current density of 0.1, 0.2, 0.5 and 1.0 A/g, the specific of 257, 224, 178 and 128 mAh/g was obtained, respectively. When the current density returns to 0.1 A/g, the battery capacity returns to about 248 mAh/g, indicating a better reversibility. The cyclic performance is also investigated (Fig. 3d). To specific, even after 700 cycles at a current density of 0.1 A/g, approximately 86% of its second discharge capacity associated with an average. Columbic efficiency of 99.7% could still be maintained. As with other selenides, the volume initially declines rapidly in the cycle and then tends to stabilize, which may be related to electrochemical reconfiguration of the electrode material during the charging process. Meanwhile, the cyclic performance of pure FeSe2 also is given in order to compare the advantages of the yolk-shell structure. Obviously, after about 500 cycles, the volume of pure FeSe2 is reduced to 10% of the initial. To evaluate the advantages of the FeSe2@C NBs electrode, the rate capacity compared with other intercalated-type electrodes is shown in Fig. 3e. From the comparative literature, our designed electrode exhibits a record high rate capacity, especially at low current density, which is due to the robust nitrogen-doped carbon skeleton resulting in effective transmission of ion and electron. Meanwhile, the compared cycle capacity is also shown in Fig. 3f. Although our electrode has a lower discharge platform of ~ 1.6 V compared to other intercalated-type electrodes (~3 V), such as Prussian blue and its Analogues as well as polyanionic pompounds, the calculated energy density is much higher than them. Even after 700 cycles, our battery can still maintain an energy density of about 354 Wh/kg, which is one of the highest densities reported, achieving an optimal balance between high-density and long-life [23, 39-47]. Such excellent performance is attributed the designed yolk-shell structured of active material, indicating the carbon nanoboxes can provide a suitable void space to accommodate the large volume variation of FeSe2 and maintain the integrity of the electrode structure during the charge/discharge process.

|
Download:
|
| Fig. 3. (a, b) Typical CV curves and charge/discharge curves of the FeSe2@C NBs electrode. (c) The rate capability for FeSe2@C NBs and pure FeSe2 electrode. (d) Long-term cycle stability and Coulombic efficiency at 0.1 A/g over 700 cycles. Comparison of (e) the rate and (f) cycle performances of FeSe2@C NBs cathode with other reported cathodes. | |
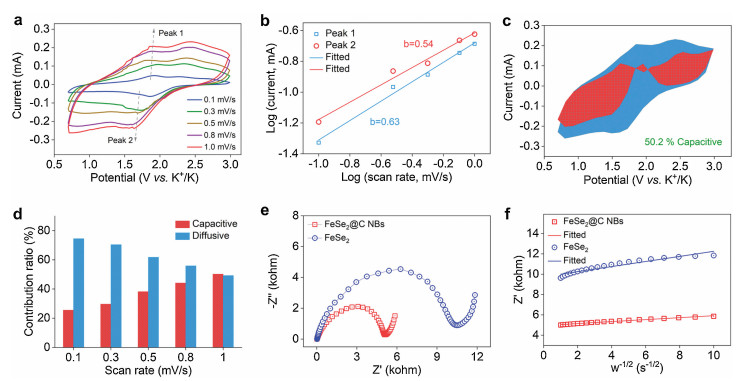
To further investigate electrochemical behavior of FeSe2@C NBs cathode, the redox pseudocapacitive contribution of this electrode was investigated through analyzing CV curves. Firstly, the CV curves at different sweep rates can see three typical redox peaks (Fig. 4a). Among them, the dotted line is marked by two relatively obvious peak positions. According to the equation of i = av, the peak current (i) and scan rate (v) has a stable relationship, and where a and b are the adjustable parameter. The b value typically varies between 0.5 and 1, which qualitatively demonstrates the pseudocapacitive fraction in the total capacity. When the b value closes to 0.5, the electrochemical behavior is controlled by a diffusion-controlled process with a feature of an ideal battery-type material, and the b value approaches 1.0, signifying a surface capacitance-dominated process and corresponding to a well-defined pseudocapacitance-type electrode material. By linear fitting the logarithms of peak current (i) and scan rate (v) in Fig. 4b, the obtained b value of two peaks is 0.54 (peak 2) and 0.63 (peak 1), revealing the fast kinetics of the FeSe2@CNBs electrode are mainly derived from the diffusion-controlled behaviors. Besides, the pseudo-capacitive contribution could be divided into two parts by the rule: i (V) = k1v + k2v1/2, where the k1v is capacitive contributions and k2v1/2 is the diffusion contributions. As exhibited in Fig. 4c, the percentage of capacitive contribution is about 50.2%, which is a one-to-one distribution at 1 mV/s. Meanwhile, under the different scan rate of 0.1, 0.3, 0.5, 0.8 and 1.0 mV/s, the capacitive contribution goes up as the scan rate goes up (Fig. 4d). To further probe the electrochemical process, electrochemical impedance spectra (EIS) of fresh electrode of FeSe2@CNBs electrode were measured from 0.01 kHz to 100 kHz (Fig. 4e). In the high frequency, the depressed semicircles of two electrodes were attributed to the charge transfer (Rct), and in low-frequency region, the sloping lines were derived from the diffusion. Fig. S9 (Supporting information) shows the shows an equivalent circuit model for electrochemical EIS fitting. The FeSe2@C NBs electrode showed a lower charge Rct (5.03 kΩ) than that of the FeSe2 electrode (10.3 kΩ) and the better efficiency of charge transfer of FeSe2@C NBs electrode can be attributed to yolk-shell structure and highly conductive N-doped carbon shell. In addition, the relationship between Z' and the reciprocal of the square root of the angular frequency ω−1/2 is shown in Fig. 4f. The slopes of fitting line are the Warburg coefficient (σω) that is inversely proportional to DK+1/2 (DK+ represents the K-ion diffusion coefficient). Obviously, the FeSe2@C NBs electrode has slightly smaller slope than FeSe2 electrode, which shows FeSe2@C NBs electrode has a K-ion diffusion coefficient. This also confirms that N-doped carbon shell not only function as an electrolyte supply depot and afford an extremely short ion-diffusion length, but shell-to-shell contact also facilitates ion transfer within the electrode.

|
Download:
|
| Fig. 4. (a) CV curves of FeSe2@C NBs electrode under different sweep rates. (b) The linear relation of peak currents and scan rates. (c) Capacitive contribution at 1 mV/s. (d) Contribution ratio of the capacitive- and diffusion-controlled capacity versus the scan rate. (e) The Nyquist plots without charge/discharge cycles of FeSe2@C NBs and pure FeSe2 electrode. (f) The linear relationship between Z' and ω−1/2 of FeSe2@C NBs and pure FeSe2 electrode in the low-frequency region. | |
To further verify the unique effect of yolk-shell structure during cycling of KIBs, Fig. S10 (Supporting information) describes the K+/e− transfer mechanism and structural changes of different materials. When large-sized potassium ions enter FeSe2, the bared active material without cushioning layer often encounter many problems during cycling, for example, intrinsically poor ionic conductivity, substantial volume (up to 200%) and morphological changes during cycling, active material dissolution, substantial resistance buildup and irreversible growth of the cathode electrolyte (Fig. S10a). This undoubtedly results in poor battery performance. But, when the yolk-shell structural (carbon shell) materials are adopted as the active materials, the above problems can be basically solved. As shown in Fig. S10b, the yolk-shell FeSe2@C NBs electrode has many fascinating advantages. Firstly, high-conductivity N-doped carbon shell can compensate for the poor conductivity of FeSe2 itself, facilitating ion entry into the active material. Secondly, the carbon shells as the nanocavities afford an extremely short ion-diffusion length and function as an electrolyte supply depot, which is desirable for high-efficiency potassium storage. Importantly, compared with other carbon-coated structures, this yolk-shell structure can provide an adaptive free space for active material volume variation while always keeping the carbon shell intact, which also can prevent the broken active material from dissolving into the electrolyte and further reduce the increase in resistance of the electrolyte
In this work, yolk-shell FeSe2@C nanoboxes were successfully prepared by template etching combined with subsequent low-temperature hydrothermal selenization. Compared with other selenization methods, this method can not only obtain regular and uniform samples but produce very pure crystal phase at low selenization temperature (150 ℃). Based on FeSe2 higher voltage platform, we firstly use it as a cathode material for KIBs, which shows outstanding electrochemical performance. The excellent performance can be attributed to the following aspects: (ⅰ) The intrinsically poor conductivity of FeSe2 is compensated for by the N-doped carbon shell; (ⅱ) The close connection between the carbon shells makes the whole electrode a tight conductive network, affording an extremely short ion-diffusion length; (ⅲ) Although potassium has a large size resulting a huge volume expansion, there will be enough space inside the carbon shell to allow it to change freely by selecting the optimal etching time; (ⅳ) The shell also prevent the broken active material from dissolving into the electrolyte and further reduce the substantial resistance buildup, contributing to extremely long cycle stability. Besides, this work presents a simple, environmental, and universal technique for the synthesis of selenide, and the rational design of Fe-based yolk-shell structure also provides a promising strategy for advanced energy storage systems. Declaration of competing interest
The authors declare that they have no known competing financial interests or personal relationships which have or could be perceived to have influenced the work reported in this article.
AcknowledgmentsThe authors acknowledge the financial support from the National Postdoctoral Program for Innovation Talents (No. BX201700103), and China Postdoctoral Science Foundation Funded Project (No. 2018M633664).
Appendix A. Supplementary dataSupplementary material related to this article can be found, in the online version, at doi:https://doi.org/10.1016/j.cclet.2021.04.002.
| [1] |
H. Fan, H. Yu, Y. Zhang, et al., Energy Storage Mater. 10 (2018) 48-55. DOI:10.1016/j.ensm.2017.08.006 |
| [2] |
J. Wang, B. Wang, Z. Liu, et al., Adv. Sci. 6 (2019) 1900904. DOI:10.1002/advs.201900904 |
| [3] |
F. Yang, H. Gao, J. Hao, et al., Adv. Funct. Mater. 29 (2019) 1808291. DOI:10.1002/adfm.201808291 |
| [4] |
Z. Tu, S. Choudhury, M.J. Zachman, et al., Nat. Energy 3 (2018) 310-316. DOI:10.1038/s41560-018-0096-1 |
| [5] |
J. Ge, B. Wang, J. Wang, Q. Zhang, B. Lu, Adv. Energy Mater. 10 (2019) 1903277. |
| [6] |
K. Zhang, Z. Hu, X. Liu, Z. Tao, J. Chen, Adv. Mater. 27 (2015) 3305-3309. DOI:10.1002/adma.201500196 |
| [7] |
J. Wang, B. Wang, B. Lu, Adv. Energy Mater. 10 (2020) 2000884. DOI:10.1002/aenm.202000884 |
| [8] |
W. Sun, Y. Li, Y. Liu, et al., J. Mater. Chem. A 6 (2018) 14155-14161. DOI:10.1039/C8TA04572K |
| [9] |
W. Sun, Y. Li, K. Xie, et al., Nano Energy 54 (2018) 175-183. DOI:10.1016/j.nanoen.2018.10.006 |
| [10] |
H. Liu, X.B. Cheng, J.Q. Huang, et al., ACS Mater. Lett. 1 (2019) 217-229. DOI:10.1021/acsmaterialslett.9b00118 |
| [11] |
Y. Xu, Y. Du, Z. Yi, et al., J. Energy Chem. 58 (2021) 593-601. DOI:10.1016/j.jechem.2020.10.039 |
| [12] |
Y. Yi, Z. Sun, C. Li, et al., Adv. Funct. Mater. 30 (2019) 1903878. |
| [13] |
Y. Zhao, Z. Sun, Y. Yi, et al., Nano Res. 14 (2020) 1413-1420. |
| [14] |
X. Xu, Y. Zhang, H. Sun, et al., Adv. Electron. Mater. (2021) 2000967. DOI:10.1002/aelm.202000967 |
| [15] |
X.B. Cheng, C.Z. Zhao, Y.X. Yao, et al., Chem 5 (2019) 74-96. DOI:10.1016/j.chempr.2018.12.002 |
| [16] |
H. Sun, Y. Zhang, X. Xu, et al., J. Energy Chem. 61 (2021) 416-424. DOI:10.1016/j.jechem.2021.02.001 |
| [17] |
Z. Yi, J. Xu, Z. Xu, et al., J. Energy Chem. 60 (2021) 241-248. DOI:10.1016/j.jechem.2021.01.022 |
| [18] |
C. An, Y. Yuan, B. Zhang, et al., Adv. Energy Mater. 9 (2019) 1900356. DOI:10.1002/aenm.201900356 |
| [19] |
S.H. Yu, X. Feng, N. Zhang, J. Seok, H.D. Abruña, Acc. Chem. Res. 51 (2018) 273-281. DOI:10.1021/acs.accounts.7b00487 |
| [20] |
D.L. Ma, Z.Y. Cao, H.G. Wang, et al., Energy Environ. Sci. 5 (2012) 8538. DOI:10.1039/c2ee22568a |
| [21] |
M.A. Reddy, B. Breitung, V.S.K. Chakravadhanula, et al., Adv. Energy Mater. 3 (2013) 308-313. DOI:10.1002/aenm.201200788 |
| [22] |
S.W. Kim, D.H. Seo, H. Gwon, J. Kim, K. Kang, Adv. Mater. 22 (2010) 5260-5264. DOI:10.1002/adma.201002879 |
| [23] |
H. Yue, H. Chen, C. Zhao, et al., J. Energy Chem. 53 (2021) 347-353. DOI:10.1016/j.jechem.2020.05.024 |
| [24] |
B. Ji, W. Yao, Y. Zheng, et al., Nat. Commun. 11 (2020) 1225. DOI:10.1038/s41467-020-15044-y |
| [25] |
X. Jia, E. Zhang, X. Yu, B. Lu, Energy Technol. 8 (2019) 1900987. |
| [26] |
H. Yu, X. Cheng, M. Xia, et al., Energy Storage Mater. 22 (2019) 154-159. DOI:10.1016/j.ensm.2019.01.010 |
| [27] |
J. Ge, L. Fan, J. Wang, et al., Adv. Energy Mater. 8 (2018) 1801477. DOI:10.1002/aenm.201801477 |
| [28] |
T. Wang, W. Guo, G. Wang, et al., J. Alloys Compd. 834 (2020) 155265. DOI:10.1016/j.jallcom.2020.155265 |
| [29] |
Y. Liu, C. Yang, Y. Li, et al., Chem. Eng. J. 393 (2020) 124590. DOI:10.1016/j.cej.2020.124590 |
| [30] |
W. Sun, C. Liu, Y. Li, et al., ACS Nano 13 (2019) 12137-12147. DOI:10.1021/acsnano.9b06629 |
| [31] |
M. Chen, Z. Zhang, L. Si, R. Wang, J. Cai, ACS Appl. Mater. Interfaces 11 (2019) 35050-35059. DOI:10.1021/acsami.9b14287 |
| [32] |
X.Y. Yu, L. Yu, L. Shen, et al., Adv. Funct. Mater. 24 (2014) 7440-7446. DOI:10.1002/adfm.201402560 |
| [33] |
G.D. Park, J.H. Kim, Y.C. Kang, Mater. Charact. 120 (2016) 349-356. DOI:10.1016/j.matchar.2016.09.019 |
| [34] |
P. Ge, H. Hou, S. Li, L. Yang, X. Ji, Adv. Funct. Mater. 28 (2018) 1801765. DOI:10.1002/adfm.201801765 |
| [35] |
S.K. Park, J.K. Kim, Y.C. Kang, Chem. Eng. J. 334 (2018) 2440-2449. DOI:10.1016/j.cej.2017.12.014 |
| [36] |
W. Ye, K. Wang, W. Yin, et al., Electrochim. Acta 323 (2019) 134817. DOI:10.1016/j.electacta.2019.134817 |
| [37] |
Y. Tang, Z. Zhao, X. Hao, et al., J. Mater. Chem. A 7 (2019) 4469-4479. DOI:10.1039/C8TA10614B |
| [38] |
Y. Lan, J. Zhou, K. Xu, et al., Chem. Commun. 54 (2018) 5704-5707. DOI:10.1039/C8CC02669F |
| [39] |
Z. Shadike, D.R. Shi, T. Wang, et al., J. Mater. Chem. A 5 (2017) 6393-6398. DOI:10.1039/C7TA00484B |
| [40] |
X. Wang, X. Xu, C. Niu, et al., Nano Lett. 17 (2017) 544-550. DOI:10.1021/acs.nanolett.6b04611 |
| [41] |
Y. Hironaka, K. Kubota, S. Komaba, Chem. Commun. 53 (2017) 3693-3696. DOI:10.1039/C7CC00806F |
| [42] |
V. Mathew, S. Kim, J. Kang, et al., NPG Asia Mater. 6 (2014) e138-e138. DOI:10.1038/am.2014.98 |
| [43] |
Y. Chen, W. Luo, M. Carter, et al., Nano Energy 18 (2015) 205-211. DOI:10.1016/j.nanoen.2015.10.015 |
| [44] |
H. Kim, D.H. Seo, J.C. Kim, et al., Adv. Mater. 29 (2017) 1702480. DOI:10.1002/adma.201702480 |
| [45] |
S. Chong, Y. Chen, Y. Zheng, et al., J. Mater. Chem. A 5 (2017) 22465-22471. DOI:10.1039/C7TA08139A |
| [46] |
X. Jiang, T. Zhang, L. Yang, G. Li, J.Y. Lee, ChemElectroChem 4 (2017) 2237-2242. DOI:10.1002/celc.201700410 |
| [47] |
L. Fan, R. Ma, J. Wang, H. Yang, B. Lu, Adv. Mater. 30 (2018) e1805486. DOI:10.1002/adma.201805486 |