 2021, Vol. 32


b Key Laboratory for Photonic and Electronic Bandgap Materials, Ministry of Education, School of Physics and Electronic Engineering, Harbin Normal University, Harbin 150025, China;
c Beijing Key Laboratory of Microstructure and Property of Solids, Faculty of Materials and Manufacturing, Beijing University of Technology, Beijing 100124, China;
d School of Materials Science and Engineering, Wuhan University of Technology, Wuhan 430070, China
Although rechargeable lithium–oxygen (Li–O2) batteries have attracted a great deal of attention in the past decade due to an ultra-high theoretical energy density of 3505 Wh/kg, their practical applications are still hindered by the slow kinetics of oxygen catalytic cathodes [1–5]. In order to facilitate both oxygen reduction reaction (ORR) and oxygen evolution reaction (OER), great efforts have been dedicated to the designs of catalyst nanostructures and electrode architectures [6,7]. The rationally designed architectures of catalysts and electrodes could expose the catalytic active sites as more as possible, accommodate the insoluble discharge product Li2O2, and maintain the diffusion paths of oxygen and electrolyte [8,9]. In the past years, novel nanoarray architectures for gas diffusion cathodes have been designed to enhance the capacities and cycle lives of Li–O2 batteries [8,10–14].
Besides the architecture design, surface electronic structure of catalysts is another significant factor that strongly influences the catalytic activities of oxygen cathodes [15]. As a heterogeneous catalysis process, modifying the interactions and energy barriers between catalysts and reactants (O2), intermediates (LiO2), and final products (Li2O2) via electronic structure tuning are effective approaches to facilitate the reaction kinetics [16,17]. Heteroatom substitution, surface functional group modification and etc. have been demonstrated as effective methods for surface electronic structure tuning [18]. For example, our previous study introduced carboxyl groups onto the carbonaceous cathode surface via acid treatment. Surface carboxyl groups function as the nucleation sites to induce the formation of toroid-like Li2O2 and thus result in enhanced discharge capacities [19]. The surface electronic structure tuning of catalysts are usually realized via chemical approaches. By contrast, physical techniques are believed to be more effortless and effective considering their easier control on the degree of surface treatment without destroying the inner structure. For instance, the low pressure Ar plasma has been widely used for the modification of surface oxides in catalyst synthesis [20–22].
Herein, for the first time, we propose a facile oxygen plasma treatment to synergistically tune the electrochemical surface areas (ECSAs) and surface cobalt valences of Co3O4 nanosheet arrays (NAs). Firstly, oxygen plasma could etch the nanosheets to enhance their ECSAs. Secondly, pure oxygen atmosphere could alter the oxygen vacancy concentration and average valence of cobalt on the surface. Experimental results show that the synergistically tuned ECSAs and surface cobalt valences enhance the reversible capacities of Co3O4 NAs up to 3.45 mAh/cm2.
Pristine Co3O4 NAs on carbon cloth (CC) were prepared by a simple electrodeposition process followed by an annealing in air [23,24]. All the experimental details are presented in Supporting information. After oxygen plasma treatment, samples were marked as Co3O4@CC–Xs (X = 6, 8, 10, 12), in which X is the treatment time in minute. Accordingly, the pristine Co3O4 NAs is denoted as Co3O4@CC–0.
The morphologies of pristine and oxygen plasma-treated Co3O4 NAs were compared by scanning electron microscopy (SEM) studies. Pristine Co3O4@CC–0 in Fig. 1a shows a three-dimensionally porous architecture composed of interconnected nanosheets vertically grown on CC. By contrast, the nanosheets on oxygen plasma-treated Co3O4@CC–10 in Fig. 1b become sparser and more porous. There are more nanoholes emerging on the plasma-treated nanosheets. Meanwhile, the three-dimensional array architecture of Co3O4 NAs almost remains. These results indicate that the Co3O4 nanosheets are etched by the oxygen plasma. The etching effect were further demonstrated by the SEM image comparisons in Fig. S1 (Supporting information) for Co3O4@CC–Xs. It is clearly seen that the Co3O4 nanosheets on CC gradually shrink to thinner ones and become more porous as the plasma treatment time increases. However, after 12-min treatment, the nanosheet arrays on Co3O4@CC–12 completely collapse to aggregated nanoparticles. That means long-time oxygen plasma treatment has calcination effect, which is similar to the effect in high temperature treatment. Although the morphologies have been significantly changed, X-ray diffraction (XRD) patterns of Co3O4@CC–0 and Co3O4@CC–10 in Figs. 1c and d show identical spinel structures. Besides the wide and strong diffractions peaks at 25.3° marked with # that are ascribed to the (002) plane diffractions of CC substrates, all the other diffraction peaks of Co3O4@CC–0 and Co3O4@CC–10 are well indexed to spinel Co3O4 (JCPDS card No. 43-1003) [25,26].

|
Download:
|
| Fig. 1. SEM images, TEM images, XRD patterns and SAED patterns of (a, c, e, g) Co3O4@CC−0 and (b, d, f, h) Co3O4@CC−10. | |
The morphologies and crystalline structures of Co3O4 NAs with and without plasma treatment were also studied by transmission electron microscope (TEM) and selected area electron diffraction (SAED) studies. The TEM images of both samples in Figs. 1e and f show morphologies of crystalline grain packing with particle diameters of ca. 25 nm, which are consistent with the porous feature of Co3O4 nanosheets. The analogous SAED patterns in Figs. 1g and h reveal the polycrystalline characters of Co3O4 NAs and clearly represent (220), (311) and (440) planes of spinel structure with interlayer spacing of 0.29 nm, 0.24 nm and 0.14 nm, respectively [27]. All these results indicate that the spinel crystalline structure of Co3O4 remains unchanged after the oxygen plasma treatment, although the shrinkage and erosion of nanosheets are observed.
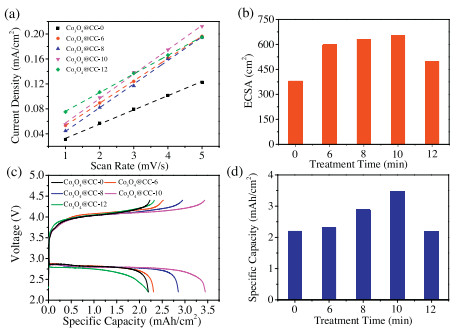
The BET specific surface areas and ECSAs of Co3O4 NAs are expected to change through the plasma treatment because of the etching and calcination effects. The nitrogen sorption isotherms of Co3O4 NAs in Fig. S2a (Supporting information) exhibit representative type IV curves suggesting the textural pores of NAs. All the Co3O4 NAs show almost identical BJH pore size distribution in Fig. S2b (Supporting information) with mean pore sizes around 8 nm. Accordingly, as summarized in Table S1 (Supporting information), the BET specific surface areas increase with increasing plasma treatment time. Only the BET surface of Co3O4@CC–12 sharply decreases due to the architecture collapse. Furthermore, cyclic voltammetry (CV) tests (Fig. S3 in Supporting information) under different scanning rates were performed in the double layer region to determine the ECSAs. The double layer current densities (calculated by dividing the geometric area) are plotted versus scanning rates in Fig. 2a. The slopes of these linear plots in Fig. 2a equal to the double-layer capacitances per unit area. By assuming that the capacitance of an ideal plate electrode is 60 μF/cm2, the roughness factors f and ECSAs of Co3O4 NAs could be calculated (listed in Table S1) [19,28]. Fig. 2b plots the calculated ECSAs versus the plasma treatment times. The ECSAs, also summarized in Table S1, gradually increase with increasing plasma treatment time. However, the ECSA of Co3O4@CC–12 sharply decreases because of the architecture collapse. All the changes of morphologies, BET surface areas and ECSAs demonstrate the etching effects of oxygen plasma treatment within 10 min and the calcination effects more than 10 min.

|
Download:
|
| Fig. 2. (a) The plots of current densities versus scan rates for the CV tests. (b) The histogram of the ECSAs versus plasma treatment time. (c) The voltage profiles of Co3O4 NAs at the current density of 0.05 mA/cm2. (d) The histogram of specific capacities versus plasma treatment time. | |
Previous studies have reported that the discharge capacities of oxygen electrodes in Li–O2 batteries are generally proportional to their surface areas. However, the present work shows a different trend compared with the proportional relation. The voltage profiles in Fig. 2c suggest that the oxygen plasma treatments do not alter the charge and discharge plateaus. However, the oxygen plasma treatment significantly changes the reversible capacities of Co3O4 NAs. As plotted in Fig. 2d, the reversible capacities of Co3O4@CC–Xs (X less than 10) are found to increase along with the increasing oxygen plasma treatment time. The enhanced ECSAs of Co3O4@CC–Xs actually contribute to the capacities increase. Specially, Co3O4@CC–12 shows a lower capacity than Co3O4@CC–10 because of the nanostructure collapse. However, ECSA is not the only factor that strongly influences the reversible capacity. In the comparison of Figs. 2b and d, Co3O4@CC–6 has sharply increased ECSA than pristine Co3O4@CC–0, but the capacity of Co3O4@CC–6 is only slightly higher than that of pristine Co3O4@CC–0. It can be seen that the capacities of Co3O4@CC–6, Co3O4@CC–8, and Co3O4@CC–10 increase quickly from 2.30 mAh/g to 3.45 mAh/g. Actually, there are only slow ECSA increase from Co3O4@CC–6 to Co3O4@CC–10. Therefore, more surface chemistry factors should be investigated to illuminate the intrinsic relation between discharge capacities and oxygen plasma treatment.
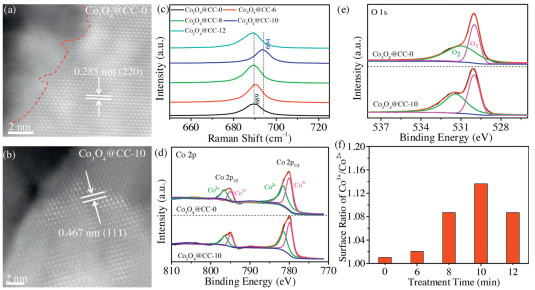
The surface chemistry natures of Co3O4@CC−Xs were further investigated by high-resolution scanning transmission electron microscopy (STEM), Raman spectrum, and X-ray photoelectron spectrum (XPS). The STEM-HAADF (high angle annular dark field) images of pristine Co3O4@CC−0 (Fig. 3a) and Co3O4@CC–10 (Fig. 3b) clearly exhibit well-defined lattice fringes of 0.285 and 0.467 nm, which corresponds to the (220) and (111) planes of spinel Co3O4, respectively. However, Fig. 3a shows amorphous phase at the edge of pristine Co3O4@CC–0 with no clear lattice fringes (left side of the red dash line). After plasma etching, the amorphous phase was cleared away and crystallized surface of Co3O4@CC–10 in Fig. 3b was obtained. Since there is no heteroatom doping during the preparation routes, the surface chemistry studies of Co3O4 NAs focus on the average valence of cobalt and oxygen vacancy concentration. The Raman spectra of Co3O4@CC–Xs were collected in Fig. S4 (Supporting information). All the samples show four characteristic peaks located at 485, 524, 621 and 690 cm–1 which can be indexed to Raman-active modes of the crystal Co3O4 corresponding to Eg, 1F2g, 2F2g and A1 g [29]. The Raman spectra around the 690 cm–1 are magnified in Fig. 3c. It can be seen that the Raman peaks in Fig. 3c gradually shift to the right with the increase of oxygen plasma treatment time. These results suggest the increase of crystallization degrees and the decrease of oxygen vacancy concentrations after the oxygen plasma treatment [30,31]. However, the Raman peak of Co3O4@CC–12 in Fig. 3c shifts back to the left suggesting that long-time plasma treatment might produce more defects or vacancies.

|
Download:
|
| Fig. 3. STEM-HAADF images of (a) Co3O4@CC–0 and (b) Co3O4@CC–10. (c) Raman spectra of Co3O4@CC–Xs (X = 0, 6, 8, 10, 12). (d) Co 2p and (e) O 1s XPS spectra of Co3O4@CC–0 and Co3O4@CC−10. (f) Surface ratio of Co3+/Co2+ versus oxygen plasma treatment time. | |
To get further insight into the surface chemical properties of Co3O4 NAs, XPS survey spectrum of pristine Co3O4@CC–0 and Co3O4@CC–10 are collected in Fig. S5 (Supporting information). Fig. S5 only shows the intrinsic elements of Co3O4 without other elements suggesting that the O2 plasma only etches the material surface without heteroatom doping. The fine-scanned Co 2p XPS spectra of pristine Co3O4@CC–0 and Co3O4@CC–10 are compared in Fig. 3d. For the two samples, the XPS peaks around 780 eV and 795 eV are attributed to Co 2p3/2 and Co 2p1/2, respectively [25,26]. Each peaks in Fig. 3d could be resolved to the combination of Co3+ and Co2+. The relative atomic ratio of Co3+/Co2+ could be acquired by comparing the area that the fitted curve covered, which presents the surface oxidation states of Co3O4 NAs. In addition, as displayed in the O 1s XPS spectra (Fig. 3e), the O 1s peaks are resolved to metal oxide (O1) at 530.0 eV and oxygen species on oxygen vacancies (O2) at 531.4 eV [25,26]. The lower intensity of O2 peak is related to a lower oxygen vacancy concentration. Through the investigation of Co 2p and O 1s XPS spectra of Co3O4@CC–Xs in Fig. S6 (Supporting information), surface ratios of Co3+/Co2+ for Co3O4 NAs are plotted versus treatment times in Fig. 3f. As the plasma processing time increases, the Co3+/Co2+ ratios gradually increase, indicating an increase of surface oxidation state and a decrease of surface oxygen vacancy. However, long-time oxygen plasma treatment might produce structure defects to lower the surface oxidation state. Thus, the Co3+/Co2+ ratio of Co3O4@CC–12 decrease back.
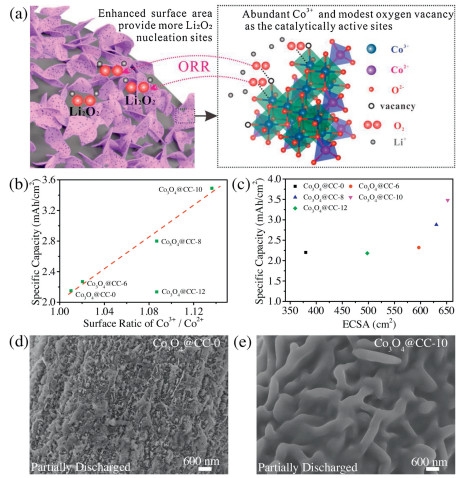
All the above characterizations demonstrate that oxygen plasma treatment not only etches the morphology of Co3O4 nanosheets but also tunes the average valence of cobalt and oxygen vacancy concentration on the surface. Firstly, oxygen plasma etches the nanosheets to produce more ECSAs. As illustrated in Fig. 4a, higher ECSA provides more nucleation sites for Li2O2 deposition. Secondly, pure oxygen atmosphere of plasma treatment lowers the oxygen vacancy concentration to enable a Co3+-rich surface. It has been widely reported that Co3+ facilitates the surface oxygen adsorption with an improved Co-O band strength, and therefore promote the ORR kinetics [32,33]. Although Raman and XPS characterizations prove the decrease of oxygen vacancies, the amount of residual oxygen vacancies is still modest. The residual oxygen vacancies are also beneficial for ORR kinetics and capacities as has been proved in previous reports [30]. Finally, the residual nanoarray architecture of Co3O4 NAs fully exposes the catalytically active sites. Therefore, using a facile plasma treatment, the synergistic effects (illustrated in Fig. 4a) of enhanced ECSA, modest oxygen vacancy and high surface Co3+ content achieve a significantly enhanced capacity (3.45 mAh/cm2) of Co3O4 NAs cathode for Li–O2 batteries. As summarized in Table S2 (Supporting information), the areal capacities of as-prepared Co3O4 NAs are higher than those of Co3O4 nanoarrays reported in literatures, which are usually limited to be around 2.0 mAh/cm2.

|
Download:
|
| Fig. 4. (a) Schematic diagram of the synergistic effects. (b) Specific capacities of Co3O4@CC-Xs versus Co3+/Co2+ ratios. (c) Specific capacities of Co3O4@CC-Xs versus ECSAs. SEM images of (d) Co3O4@CC−0 and (e) Co3O4@CC−10 partially discharged to 0.15 mAh/cm2. | |
The influences of surface Co3+/Co2+ ratios and ECSAs on the capacities of Co3O4 NAs are further plotted in Figs. 4b and c to illuminate the synergistic mechanism. In Fig. 4b, the specific capacities have a good linear relation with the Co3+/Co2+ ratios, conforming that the surface Co3+ is catalytically active site. The capacity deviation of Co3O4@CC–12 from the linear relation is attributed the collapsed architecture. Fig. 4c clearly show that ECSA is an important but not the only factor that influence the capacities. The Co3+ and oxygen vacancy active sites were also demonstrated by the SEM images of discharged Co3O4 NAs in Figs. 4d and e. Generally, in TEGDME solvent with a low donor number, LiO2 intermediator is adsorbed on the surface to generate Li2O2 with further reduction. Therefore, the active sites for LiO2 play a critical role for the initial Li2O2 deposition [18]. Partially discharged Co3O4@CC–0 in Fig. 4d shows scattered particles of discharge product due the limited adsorbed LiO2. By contrast, a conformal growth of discharge product on Co3O4@CC–10 is clearly observed in Fig. 4e because of facile LiO2 adsorption. All these results confirm that there are more catalytic active sites on Co3O4@CC–10 than on Co3O4@CC–0 for discharge product deposition. Furthermore, full charge/discharge, rate performance and cycling tests presented and discussed in Figs. S7–S9 (Supporting information) also support these results, respectively.
In summary, we have reported a facile oxygen plasma treatment to synergistically tune the surface chemistry and ECSA of Co3O4 nanosheet arrays. After appropriate oxygen plasma treatment, Co3O4 NAs demonstrates an extremely enhanced reversible capacity (from 2.19 mAh/cm2 to 3.45 mAh/cm2). The improved electrochemical performance can be attributed to the synergistic effects of enhanced ECSA, modest oxygen vacancy and high surface Co3+ concentration introduced via oxygen plasma etching. Our work not only develops a promising high-capacity cathode for Li–O2 batteries, but also may provide a facile physical method to simultaneously tune the nanostructure and surface chemistry of energy storage materials.
Declaration of competing interestThe authors report no declarations of interest.
AcknowledgmentsThis work was supported by grants from the National Natural Science Foundation of China (Nos. 22075219 and 51972257), the National Key Research Program of China (No. 2016YFA0202602), the Research Start-Up Fund from Wuhan University of Technology.
Appendix A. Supplementary dataSupplementary material related to this article can be found, in the online version, at doi:https://doi.org/10.1016/j.cclet.2021.03.066.
| [1] |
J. Lu, L. Li, J.B. Park, et al., Chem. Rev. 114 (2014) 5611-5640. DOI:10.1021/cr400573b |
| [2] |
S. Tian, B. Shao, Z. Wang, et al., Chin. Chem. Lett. 30 (2019) 1289-1292. DOI:10.1016/j.cclet.2019.02.027 |
| [3] |
X. Zhang, X. Mu, S. Yang, et al., Energy Environ. Mater. 1 (2018) 61-74. DOI:10.1002/eem2.12008 |
| [4] |
Z. Guo, C. Li, J. Liu, Y. Wang, Y. Xia, Angew. Chem. Int. Ed. 56 (2017) 7505-7509. DOI:10.1002/anie.201701290 |
| [5] |
D. Wang, F. Zhang, P. He, H. Zhou, Angew. Chem. Int. Ed. 58 (2019) 2355-2359. DOI:10.1002/anie.201813009 |
| [6] |
Z. Chang, J. Xu, X. Zhang, Adv. Energy Mater. 7 (2017) 1700875. DOI:10.1002/aenm.201700875 |
| [7] |
C. Wen, T. Zhu, X. Li, et al., Chin. Chem. Lett. 31 (2020) 1000-1003. DOI:10.1016/j.cclet.2019.09.028 |
| [8] |
P. Zhang, S. Zhang, M. He, et al., Adv. Sci. 4 (2017) 1700172. DOI:10.1002/advs.201700172 |
| [9] |
L. Xiao, J. Yi, W. Meng, S. Wang, B. Deng, J. Liu, Sci. China-Mater. 62 (2019) 633-644. DOI:10.1007/s40843-018-9367-3 |
| [10] |
Y. Cui, Z. Wen, Y. Liu, Energy Environ. Sci. 4 (2011) 4727-4734. DOI:10.1039/c1ee02365a |
| [11] |
X.Y. Yang, J.J. Xu, Z.W. Chang, et al., Adv. Energy Mater. 8 (2018) 1702242. DOI:10.1002/aenm.201702242 |
| [12] |
N. Li, D. Xu, D. Bao, J. Ma, X. Zhang, Chin. J. Catal. 37 (2016) 1172-1179. DOI:10.1016/S1872-2067(15)61089-0 |
| [13] |
L. Xiao, D. Wang, M. Li, B. Deng, J. Liu, J. Energy Chem. 46 (2020) 248-255. DOI:10.1016/j.jechem.2019.11.014 |
| [14] |
H. Cheng, J. Xie, G. Cao, et al., Energy Storage Mater. 23 (2019) 684-692. DOI:10.1016/j.ensm.2019.02.028 |
| [15] |
P. Chen, K. Xu, Z. Fang, et al., Angew. Chem. Int. Ed. 54 (2015) 14710-14714. DOI:10.1002/anie.201506480 |
| [16] |
S.M. Xu, Q.C. Zhu, M. Harris, et al., Nano Lett. 16 (2016) 5902-5908. DOI:10.1021/acs.nanolett.6b02805 |
| [17] |
G. Tan, L. Chong, R. Amine, et al., Nano Lett. 17 (2017) 2959-2966. DOI:10.1021/acs.nanolett.7b00207 |
| [18] |
L. Xiao, J. Yi, Z. Kou, et al., Small Method. 4 (2020) 1900619. DOI:10.1002/smtd.201900619 |
| [19] |
M. Li, L. Xiao, D. Wang, et al., Chin. Chem. Lett. 30 (2019) 2328-2332. DOI:10.1016/j.cclet.2019.07.011 |
| [20] |
M.B. Kizling, S.G. Järås, Appl. Catal. A: Gen. 147 (1996) 1-21. DOI:10.1016/S0926-860X(96)00215-3 |
| [21] |
Y. Zhang, B. Ouyang, J. Xu, et al., Angew. Chem. Int. Ed. 55 (2016) 8670-8674. DOI:10.1002/anie.201604372 |
| [22] |
L. Xu, Q. Jiang, Z. Xiao, et al., Angew. Chem. Int. Ed. 55 (2016) 5277-5281. DOI:10.1002/anie.201600687 |
| [23] |
L. Xiao, E.W. Li, J.Y. Yi, et al., Rare Met. 37 (2018) 527-535. DOI:10.1007/s12598-018-1033-y |
| [24] |
C. Shen, Z. Wen, F. Wang, et al., RSC Adv. 6 (2016) 16263-16267. DOI:10.1039/C6RA00290K |
| [25] |
C. Song, D. Zhang, B. Wang, et al., Nano Res. 9 (2016) 3322-3333. DOI:10.1007/s12274-016-1209-4 |
| [26] |
F. Wu, X. Zhang, T. Zhao, et al., J. Mater. Chem. A 3 (2015) 17620-17626. DOI:10.1039/C5TA04673D |
| [27] |
M. He, P. Zhang, S. Xu, X. Yan, ACS Appl. Mater. Interfaces 8 (2016) 23713-23720. DOI:10.1021/acsami.6b07092 |
| [28] |
W. Xu, Z. Lu, X. Lei, Y. Li, X. Sun, Phys. Chem. Chem. Phys. 16 (2014) 20402-20405. DOI:10.1039/C4CP02952F |
| [29] |
J. Zhang, P. Li, Z. Wang, et al., J. Mater. Chem. A 3 (2015) 1504-1510. DOI:10.1039/C4TA05573J |
| [30] |
J. Wang, R. Gao, D. Zhou, et al., ACS Catal. 7 (2017) 6533-6541. DOI:10.1021/acscatal.7b02313 |
| [31] |
R. Gao, Z. Li, X. Zhang, et al., ACS Catal. 6 (2016) 400-406. DOI:10.1021/acscatal.5b01903 |
| [32] |
Y. Hou, C. Hou, Y. Zhai, et al., Electrochim. Acta 324 (2019) 134884. DOI:10.1016/j.electacta.2019.134884 |
| [33] |
X. Lang, Y. Zhang, K. Cai, et al., Ionics 25 (2019) 35-40. DOI:10.1007/s11581-018-2588-1 |