 2021, Vol. 32


b Institute of Chemistry, National Institute of Measurement and Testing Technology, Chengdu 610021, China
Nowadays, due to the global energy crisis and atmospheric contamination, new types of energy sources are highly demanded [1-4], and H2 is now regarded as a new ideal alternative to fossil energy sources, which can be produced in a cyclic manner and will emit no green-house or contaminative byproducts [5-9]. By present, very effective efforts have been carried out to construct H2-based fuel cells as new energy device with high efficiency [10-12], providing renewable sources of H2 based on catalytic energy conversions. Recently, those using proton exchange membrane (PEM) have undergone remarkable progresses [13, 14] and are highly expected to be endowed with great promise in the future. However, diverse sulfur compounds (SCs) at trace level (i.e., ppb or nmol/mol) are usually involved in the construction of these fuel cells and H2 production, and cause irreversible degradation of the catalysts [15-18]. Moreover, in response to the worldwide construction of H2 refueling centers, several correlated organizations such as European Committee for Standardization and International Organization for Standardization (ISO), are currently working on according standards (e.g., ISO 14, 687 [19]) to stipulate the least allowable levels of the SCs (i.e., 4 nmol/mol for the total SCs) and other harmful impurities. Therefore, reliable methods with high sensitivity and selectivity for accurate analysis of the SCs in H2 are thereby highly demanded.
Despite the correlated methods reported previously, such as coulometric titration (CT) [20], X-ray fluorescence (XRF) spectrometry [21], or inductively coupled plasma optical emission spectrometry (ICP-OES) [22], the in-situ monitoring and accurate determination of SCs in complex matrices is still challenging due to their highly reactive features which would cause substantial variation in species and/or concentrations of SCs during the H2 production [23]. Nowadays, gas chromatography (GC) has become promising for the determination of SCs in H2 or even complex matrices (e.g., environmental or petrochemical samples) [24-27], and it has been revealed that the sulfur chemiluminescence detector (SCD) is comparable or even superior to other detectors of GC for the analysis of gaseous SCs [28-30]. Moreover, the SCD [31-34] and flame photometric detector (FPD) [35-38] are the most popular detectors for GC and also publicized as the only detectors in ISO 21087 [39] concerning the development of analytical methods for SCs to meet the requirement by ISO 14687 [19]. Notably, due to some defects of FPD such as matrix interference or unreliable signals for SCs [35, 36], SCD is often the detector of choice for determining the total SCs in H2 [31, 40-42], which has also been verified in many laboratory, for example, the National Physical Laboratory (NPL) in Great Britain [43].
Moreover, for the development and further evaluation of the analytical methods for SCs in H2, reliable standard samples are essential. However, for most laboratories the samples containing trace SCs down to nmol/mol level are still hard to be prepared, stored and transferred [44-51] in an accurate manner even via passivation [45, 52], and the sampling procedures for further analysis are very captious. Therefore, online rather than offline identification and determination of trace SCs in H2 with accurate sampling are highly preferred. As aforementioned, GC-SCD is the first choice proposed in ISO 21087 [39] for analysis of SCs, with two standard approaches publicized. One employed a cryogenic pre-concentrator for trapping SCs but the usage of liquid N2 is not convenient for online analysis, the other does not involve any pre-concentrators but the sensitivity was not high enough, and for both approaches the proportional correlation between the SCD response and number of S atoms still needs to be validated. Therefore, there is a great demand to upgrade the GC-SCD technique to achieve the online determination of SCs with further improved sensitivity.
In this context, herein we developed a new system which will be commercialized shortly based on the combination of the pre-concentration of SCs without liquid N2 and the following determination by GC-SCD, for the online determination of mixtures of SCs at nmol/mol levels in H2, which should be applicable to the online monitoring of various SCs at trace level involved in H2 production. This work would further explore the potential of GC-SCD in the analysis of gaseous SCs, and the analytical performance of this developed system should be superior or at least comparable to most previously reported ones [28-30] for the same analytical purpose. Moreover, for accuracy validation of the proposed system, primary reference gas mixtures (PRGM) containing nine different SCs in H2 were gravimetrically prepared and further diluted according to the proposed procedures in ISO 6142 [53], which should be the ideal candidates for testing its performance due to their high stability [45, 54]. Another attractive virtue lies in that samples with target concentration of SCs at trace level could be accurately prepared online by integrating an online dilution module into the proposed system, which could be instantly analyzed by GC-SCD after the online cryogenic trapping. This could provide ease of operation by accomplishing facile online preparation of gaseous samples besides SCs, and further endow this system with a great potential for on-site analysis.
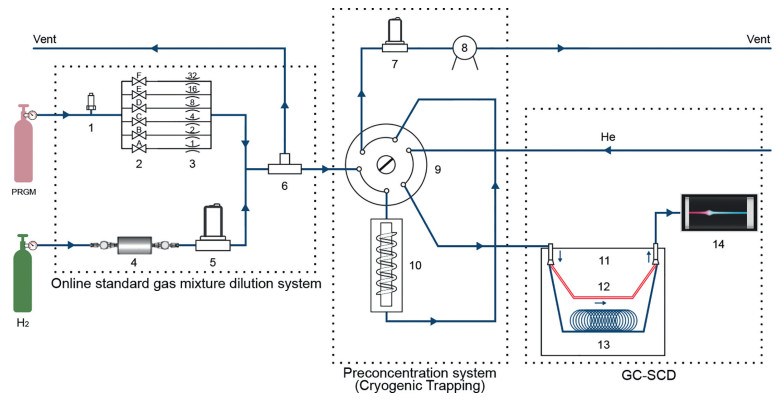
H2S, COS (carbonyl sulfide), CH3SH, C2H5SH, CH3SCH3, CS2, CH3SC2H5, C4H4S and C2H5SC2H5, were employed as the model SCs in this work. The PRGMs of them in H2 were prepared according to the proposed procedures in ISO 6142 [53] and ISO 17025 [55] in order to meet the requirements of ISO 14687 [19]. The detailed information about the preparation of PRGMs were provided in Supporting information. For further dilution, the gas dilutors capable of blending flow of gases in different ratios are widely used to prepare gas mixtures with variable and reliable fractions dynamically [56-60]. However, the gas dilution using simple mass-flow controllers (MFCs) is now still lacking stability and accuracy mostly due to infeasibility for passivation to avoid the internal adsorption or reactions of gas molecules including SCs [61]. Therefore, in this work, a dilution system of state-of-art by combining passivated critical flow orifices [60] to MFCs was designed against any possible loss of SCs and downstream pressure change. As shown in Fig. 1, the flow rate of PRGM was controlled by six groups of critical flow orifice and switch valve, ranging from 0.2 to 1000 mg/s, with specific dilution accomplished by opening the according orifice but shutting down the others, and a high-precision pressure transducer was inserted before the orifices to accurately monitor the input pressure. The H2 as the diluent was regulated by a full-scale thermal MFC (MFC1, 0–1000 mg/s, obtained from Brooks, U. S. A.). The pressure of PRGM and H2 was reduced by a SulfinertⓇ passivated regulator (minimum dead volume, Swagelok, U. S. A.) to 4 and 2–5 bar, respectively, and the temperature (constant as 60 ℃) and pressure of the gas flow through the orifices and MFC1 were calibrated by a high-precision primary flow standard (ML 500, BIOS, U. S. A.) for exceptionally low uncertainties (< 0.3%). All gas lines were SulfinertⓇ treated 1/16 inch external diameter stainless steel tubing in order to reduce the adsorption of target gas. In detail, if the downstream pressure after the orifice was less than 50% of the upstream pressure before the orifice, the gas flow was immune to the former but proportional to the latter [62, 63]. The whole system was internally passivated again any possible adsorption of SCs, and automatically operated by a PC using our laboratory-developed software, with the exit of the gas-line vented to the atmosphere to enable continuous flow. Moreover, besides SCs in H2, the PRGMs or diluted ones of other gas molecules (e.g., HCHO) in other matrix (e.g., N2 or air) with concentrations down to the nmol/mol level could also be obtained by using this system, although not involved in the present work herein.

|
Download:
|
| Fig. 1. Diagram of the developed online determination system for SCs composed of three primary parts for PRGM dilution, pre-concentration of SCs via cryogenic trapping, and GC-SCD determination, respectively, with the modules numbered from 1 to 14 standing for, 1: pressure transducer, 2: switch valve, 3: critical orifice, 4: H2 purifier, 5: MFC1, 6: three-way pipe, 7: MFC2, 8: pump, 9: six-way valve, 10: cryogenic trap, 11: GC, 12: non-retaining column for total analysis, 13: capillary column for speciation analysis and 14: SCD. | |
A cryogenic trapping system with a 1-stage concentrator produced by Sichuan Shengruiheng Instruments Co., Ltd., Chengdu, China, was used in this work, and a thermal MFC (0–100 mg/s, Brooks, U. S. A.; MFC2 in Fig. 1) volumetric meter was used for measuring the sampling volume. A commercially available absorbent (301 Trap column, developed by Sichuan Shengshi Tech. Co., Ltd., Chengdu, China) particularly for the preconcentration of SCs was assembled into this trapping system as the adsorption material. Other three commercially available materials widely regarded as common absorbents for volatile compounds, including Carboxen 1000 (carbon molecular sieve), Carbopack B (graphitized carbon black) and Tenax TA (a common organic polymer), were also tested for comparison in terms of the trapping performance for the SCs. Every absorbent was packed in a homemade silanized cryogenic trap (quartz tube, O.D. 5 mm, length 10 cm) and sealed with silanized glass wool, which was assembled into the 1-stage concentrator. The trapping system was initially heated to 120 ℃ for 2 min and purged with purified N2 (> 99.99999%, Sichuan Winntec Specialty gases Co., Ltd., Chengdu, China) at the flow rate of 60 mL/min, and then kept at −30 ℃ with the target SCs samples (100 mL) passing through and trapped. Subsequently, the SCs were released out by rapidly heating, and further introduced into the capillary column in the split mode through a transfer line (silica tube, 1 m in length) kept at the temperature higher than 80 ℃. As shown in Fig. 1, these manipulations in sequence were carried out by switching a six-way valve connecting with the aforementioned dilution system.
For online determination, a Nexis SCD-2030 (Shimadzu, Kyoto, Japan) was used for the analysis of SCs samples which were introduced through the transfer line, with He (> 99.99999%, Sichuan Winntec Specialty gases Co., Ltd., Chengdu, China) as the carrier gas (2 mL/min) and stabilization for 15 min. Total or speciation sulfur analysis were performed using a non-retaining column (fused silica deactivated, 10 m × 0.32 mm i.d.) or a capillary column (DB-Sulfur, 60 m × 0.32 mm i.d. × 4.2 µm), respectively. The MFC2 (Fig. 1) with super-high accuracy was used for measuring the sampling volume. The adsorption efficiency of the absorbent and the determination accuracy of GC-SCD were highly dependent on the flow rate and sampling volume, which should be optimized while the other parameters were kept constant, with the temperature for internal flow, transmission line, module connector, focusing, desorption, and roast as 80 ℃, 120 ℃, 40 ℃, −30 ℃, 120 ℃ and 120 ℃, respectively, the roast flow rate and time as 60 mL/min and 2 min, respectively, the flow rate through the GC column as 2 mL/min, the temperature at the injection port as 150 ℃, the oven temperature as 40 ℃ and maintained for 5 min, then ramped up with a rate of 10 ℃/min until 140 ℃ and kept for another 2 min, with a split ratio of 4:1 the interfacing temperature between GC and SCD as 200 ℃, the combustor temperature as 850 ℃, with the flow rate of H2 as 80 mL/min, N2 as 40 mL/min, O2 as 10 mL/min, and O3 as 25 mL/min. After the flow rate and sampling volume were optimized, the samples with the SC concentration ranged from 0.1 nmol/mol to 40 nmol/mol were analyzed.
The heretofore provided information has shown the preliminary construction and integration of the proposed new system in this work. Before further application to the analysis of the PRGMs or the diluted ones with SCs in H2, the purity of the H2 should be evaluated first to make sure no sulfur-based interference derived from the PRGMs preparation or dilution, although the H2 was purified in advance (see details in Supporting information). The collected H2 after the purification, and the PRGMs containing the nine SCs (diluted to 1 nmol/mol for each SC) were all analyzed by GC-SCD for comparison. It turned out that no signals were detected by the SCD from any of the purified H2, illustrating that no detectable background SCs and interferents were contained in the H2 after purification. Furthermore, in order to validate the absorption or desorption performance by the sorbents without the interference from any possible penetration or residue of the target molecules, the sample containing the nine SCs with a concentration of 40 nmol/mol was driven through the sorbents, with the eluent analyzed by GC-SCD. At the same time, the sample containing the nine SCs with a concentration of 1 nmol/mol was also analyzed by GC-SCD for comparison. It turned out that no signals were detected by the SCD, illustrating that the 40 nmol/mol of the SCs were completely retained by the pre-concentrator without any penetration. Moreover, after the desorption of the retained SCs, the eluent out of the sorbents was analyzed by GC-SCD, without any signals for SCs detected, illustrating that there was no residue left in the pre-concentrator.
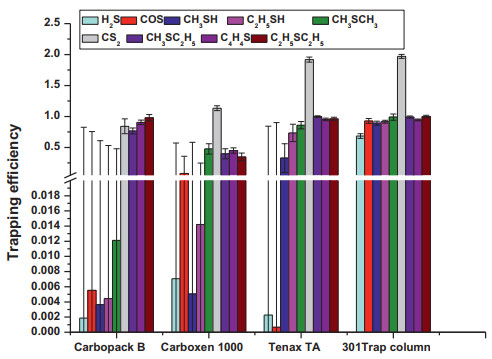
We first compared the trapping efficiency of 301 Trap column for the SCs with that of Carboxen 1000, Carbopack B or Tenax TA. In general, Tenax TA is the mostly employed absorbent for VOCs and the absorption efficiency turned out to be increased with the molecular weight of the target SCs, but the low surface area of Tenax TA (35 m2/g) usually impedes satisfactory retention. For Carbopack B and Carboxen 1000, the former is a common graphene-based absorbent but has been validated to be not applicable for a wider range of SCs, while the latter shows overly strong interaction to some SCs, which might cause less efficient desorption of them for further analysis. As a result of these merits and demerits, and as shown in Fig. 2, the 301Trap column showed satisfactory trapping performance for all the SCs, while the other three absorbents showed relatively poor trapping performance for some of the target SCs with much worse reproducibility.

|
Download:
|
| Fig. 2. Comparison of the trapping efficiency of different sorbent materials in terms of the peak area of GC-SCD signals of 4 nmol/mol of the nine SCs in H2 with a sample volume 100 mL. The error bar was obtained from 7 replicated measurements. | |
The temperature for both adsorption and desorption of the SCs to and from the 301 Trap column were also optimized, with each of the remaining or released SCs determined by GC-SCD, respectively. The temperature ranges were chosen based on the previously correlated works [64, 65] about cryogenic trapping and subsequent release of gaseous analytes for the determination by GC with the routine procedures. As shown in Fig. S1 (Supporting information), as the temperature decreased to −30 ℃ or increased to 120 ℃, the detected intensity of the signal for all the SCs reached the maximum, so −30 ℃ and 120 ℃ were chosen as the optimal temperature for the adsorption and desorption of the SCs out of the cryogenic trapping system, respectively.
For the cryogenic trapping of the SCs at −30 ℃, the sampling flow rate was further optimized. 1 nmol/mol of each SC was used with a volume of 100 mL for 7 replicated sampling, with the flow rate ranging from 5 mL/min to 60 mL/min investigated, and the released SCs at the optimal desorption temperature of 120 ℃ were further analyzed by GC-SCD. As shown in Fig. S2 (Supporting information), with the sampling flow rate increased, the SCD signal increased first, and then decreased to a plateau after the flow rate was higher than 15 mL/min. This was mostly ascribed to that the physio-chemical interaction between the SCs and the sorbents was modulated by the molecular diffusion. The higher flow rate, the shorter sampling time and the slower molecular diffusion, so the better retention of the SC by the sorbent. On the other hand, if the flow rate was over-high (> 15 mL/min), the retention would be impaired probably due to the high sweeping effect. Therefore, the equilibrium between the molecular diffusion and the SCs-sorbent physio-chemical interaction would be achieved at a moderate and critical point of flow rate at 15 mL/min which should be the optimal to attain the best SCD signals.
With the sampling flow rate set as 15 mL/min for 7 replicated sampling of each SC with a concentration of 1 nmol/mol, the sampling volume ranged from 0 to 400 mL was further investigated. As shown in Table S1 and Fig. S3 (Supporting information), H2S and COS of the obtained SCD signals increased linearly with the sampling volume from 0 to 100 mL, while for the other 7 SCs, this linearity covered the range from 0 to 400 mL. For H2S and COS, the increasing speed of the detected SCD signal intensity became much lower until to almost undetectable if the sampling volume increased beyond 100 mL, this was mostly ascribed to the smaller molecular size of these two SCs, which could lead to faster molecular diffusion. Moreover, the absorption of the sorbents for these two SCs was much weaker than the other seven, so it was much easier to reach the absorption equilibrium for them. In order to obtain the best detection performance for all the nine SCs, 100 mL was selected as the optimal sampling volume.
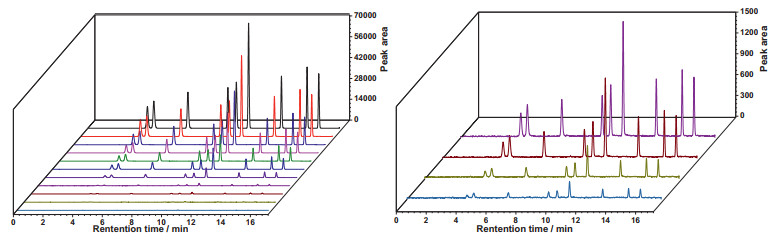
Under the optimized experimental conditions, with the sampling flow rate of 15 mL/min and the sampling volume of 100 mL, the mixture of nine SCs were analyzed based on 7 replicated analysis by GC-SCD, with the concentration ranged from 0.1 nmol/mol to 40 nmol/mol. As shown in Fig. 3 and Fig. S4 (Supporting information) and Tables S2 and S3 (Supporting information), good linearity with correlation coefficients higher than 0.999 was obtained, and the analysis was satisfactory in terms of the precision, with the relative standard deviation (RSD) lower than 5%.

|
Download:
|
| Fig. 3. GC-SCD chromatogram of the diluted PRGMs containing the SCs (as the elution sequence: H2S, COS, CH3SH, C2H5SH, CH3SCH3, CS2, CH3SC2H5, C4H4S and C2H5SC2H5) with a concentration of 0.1, 0.2, 0.5, 1, 4, 8, 10, 15, 20, 30 and 40 nmol/mol (from outside to inside) (left) and the magnified for 0.1, 0.2, 0.5 and 1 nmol/mol (right). | |
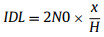
Although the common methods such as Hubaux-Vos [66] can be employed for obtaining a calibration curve to yield a limit of detection (LOD), it would require the usage of gas standards at very low amount of fractions. Therefore, it would be more appropriate in this study to use a common calculation approach to ensure the absolute instrumental sensitivity, based on the ratio of the height of the signal peak of the target analyte of known amount of fraction and the height of the signal of instrumental noise. The LOD was thereby calculated based on calculated based on :
|
(1) |
with IDL (instrumental detection limit, IDL) as the LOD, H as the averaged GC peak heights, N0 as the baseline noise intensity, and x as the concentration of the SCs. As shown in Table S3 (Supporting information), the LOD for the nine SCs ranged from 0.010 nmol/mol to 0.050 nmol/mol, indicating the high sensitivity and precision of the proposed method for the analysis of SCs.
To further evaluate the accuracy of the proposed method by the developed system, for exemplar, the obtained calibration plots in Fig. S4 were employed to determine the concentration of each SC in the standard PRGMs prepared with the aforementioned standard procedure, which was further compared with the target concentration of 1, 4, 8 and 15 nmol/mol. As shown in Table S4 (Supporting information), the relative deviation (RD) for all these SCs was less than 15%, which demonstrated satisfactory accuracy.
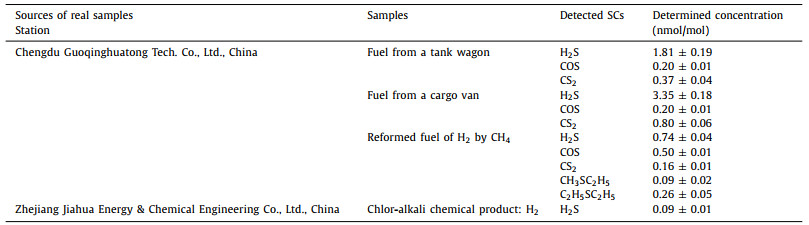
The so far demonstrated results revealed the great potential of the developed system in determining SCs mixture in H2 with super high sensitivity, precision and accuracy. It should also be mentioned that the analytical time for one sample is less than 30 min, which is fast and highly efficient. Furthermore, the developed method was applied to the analysis of local H2 fuel samples. As shown in Table 1, some of the nine aforementioned SCs were determined, with the analytical results down to 0.09 nmol/mol, and this demonstrated the practical utility of this method, especially for the determination of trace SCs in real H2 samples.
|
|
Table 1 The analysis of SCs in real H2 samples. |
In summary, we developed a new system by combining online cryogenic trapping of trace SCs and subsequent GC-SCD determination, which greatly increased the sensitivity for the determination of SCs in H2. The corresponding online analytical procedure greatly improved the accuracy, efficiency and precision for the analysis, much better in performance than the previously reported works. This accomplishment was also benefited from the incorporated dilution system for accurately preparing PRGM online with delicate compositions, which would make the analysis more reliable by avoiding any possible loss of the target SCs due to their highly reactive features. The LOD obtained from this method was much lower than the minimum concentration level of total SCs by ISO 14687, and the application in the real sample analysis was also successful, showing its great promise for practical applications in the future.
Declaration of competing interestWe declare there is no conflict of interest.
AcknowledgmentsWe greatly appreciate the financial support to this work by Sichuan Science and Technology, China (Nos. 2019ZDZX0035 & 2018TZDZX0008), and the Ministry of Education through the 111 Project (No. B17030).
Supplementary materialsSupplementary material associated with this article can be found, in the online version, at doi:10.1016/j.cclet.2021.05.067.
| [1] |
H.S. Boudet, Nat. Energy 4 (2019) 446-455. DOI:10.1038/s41560-019-0399-x |
| [2] |
L. Jin, B.B. Zhang, L. Zhang, W.Q. Yang, Nano Energy 66 (2019) 104086. DOI:10.1016/j.nanoen.2019.104086 |
| [3] |
Z.L. Wang, ACS Nano 7 (2013) 9533-9557. DOI:10.1021/nn404614z |
| [4] |
M. Zeng, S. Xue, M.J. Ma, X.L. Zhu, Renew. Sustain. Energy Rev. 20 (2013) 169-185. DOI:10.1016/j.rser.2012.11.067 |
| [5] |
T. Sinigaglia, F. Lewiski, M.E.S. Martins, J.C.M. Siluk, Int. J. Hydrog. Energy 42 (2017) 24597-24611. DOI:10.1016/j.ijhydene.2017.08.063 |
| [6] |
C. Wei, R.R. Rao, J.Y. Peng, et al., Adv. Mater. 31 (2019) 1806296. DOI:10.1002/adma.201806296 |
| [7] |
Z.J. Han, R. Eisenberg, Acc. Chem. Res. 47 (2014) 2537-2544. DOI:10.1021/ar5001605 |
| [8] |
R.M. Navarro, M.A. Pena, J.L.G. Fierro, Chem. Rev. 107 (2007) 3952-3991. DOI:10.1021/cr0501994 |
| [9] |
C.M. White, R.R. Steeper, A.E. Lutz, Int. J. Hydrog. Energy 31 (2006) 1292-1305. DOI:10.1016/j.ijhydene.2005.12.001 |
| [10] |
H. Fayaz, R. Saidur, N. Razali, et al., Renew. Sustain. Energy Rev. 16 (2012) 5511-5528. DOI:10.1016/j.rser.2012.06.012 |
| [11] |
J.J. Hwang, Renew. Sustain. Energy Rev. 19 (2013) 220-229. DOI:10.1016/j.rser.2012.11.033 |
| [12] |
J.B. Zhou, Y.J. Guo, Z.W. Huang, C. Wang, Int. J. Hydrog. Energy 44 (2019) 29776-29784. DOI:10.1016/j.ijhydene.2019.05.244 |
| [13] |
X. Cheng, Z. Shi, N. Glass, et al., J. Power Sour. 165 (2007) 739-756. DOI:10.1016/j.jpowsour.2006.12.012 |
| [14] |
B. Paul, J. Andrews, Renew. Sustain. Energy Rev. 79 (2017) 585-599. DOI:10.1016/j.rser.2017.05.112 |
| [15] |
R. Farrauto, S. Hwang, L. Shore, et al., Ann. Rev. Mater. Res. 33 (2003) 1-27. DOI:10.1146/annurev.matsci.33.022802.091348 |
| [16] |
C. Hulteberg, Int. J. Hydrog. Energy 37 (2012) 3978-3992. DOI:10.1016/j.ijhydene.2011.12.001 |
| [17] |
N. Sanchez, R. Ruiz, V. Hacker, M. Cobo, Int. J. Hydrog. Energy 45 (2020) 11923-11942. DOI:10.1016/j.ijhydene.2020.02.159 |
| [18] |
Y.S. Shen, P.W. Li, X.H. Xu, H. Liu, RSC Adv. 2 (2012) 1700-1711. DOI:10.1039/C1RA00944C |
| [19] |
International Standard, in: Hydrogen Fuel Quality-Product Specification, ISO, 2019, p. 14687.
|
| [20] |
E. Barendrecht, W. Martens, Anal. Chem. 34 (1962) 138-142. DOI:10.1021/ac60181a042 |
| [21] |
V. Sprta, B. Knob, P. Janos, Fres. J. Anal. Chem. 364 (1999) 705-708. DOI:10.1007/s002160051418 |
| [22] |
R.E. Santelli, E.P. Oliveira, M.d.F.B Carvalho, M.A. Bezerra, A.S. Freire, Spectrochim. Acta Part B Atom. Spectr. 63 (2008) 800-804. DOI:10.1016/j.sab.2008.04.020 |
| [23] |
A. Murugan, A.S. Brown, Int. J. Hydrog. Energy 40 (2015) 4219-4233. DOI:10.1016/j.ijhydene.2015.01.041 |
| [24] |
Y. Han, Y. Zhang, C. Xu, C.S. Hsu, Fuel 221 (2018) 144-158. DOI:10.1016/j.fuel.2018.02.110 |
| [25] |
B.J. Pollo, G.L. Alexandrino, F. Augusto, L.W. Hantao, Trac Trends Anal.Chem 105 (2018) 202-217. DOI:10.1016/j.trac.2018.05.007 |
| [26] |
I.A. Revel'skii, M.E. Chivarzin, A.I. Revel'skii, A.K. Buryak, J. Anal. Chem. 74 (2019) 176-181. DOI:10.1134/S1061934819010088 |
| [27] |
S.G. Sama, C. Barrere-Mangote, B. Bouyssiere, P. Giusti, R. Lobinski, Trac Trends Anal. Chem. 104 (2018) 69-76. DOI:10.1016/j.trac.2017.10.014 |
| [28] |
Y. Pan, Z.A. Li, X. Zhou, et al., Chin. Chem. Lett. 28 (2017) 1670-1674. DOI:10.1016/j.cclet.2017.04.014 |
| [29] |
W. Wardencki, B. Zygmunt, Anal. Chim. Acta 255 (1991) 1-13. DOI:10.1016/0003-2670(91)85080-C |
| [30] |
W. Wardencki, J. Chromatogr. A 793 (1998) 1-19. DOI:10.1016/S0021-9673(97)00997-7 |
| [31] |
J. Luong, R. Gras, M. Hawryluk, R. Shearer, Anal. Methods 8 (2016) 7014-7024. DOI:10.1039/C6AY01887D |
| [32] |
B. Chawla, F. Disanzo, J. Chromatogr. 589 (1992) 271-279. DOI:10.1016/0021-9673(92)80032-P |
| [33] |
C.L. Garcia, M. Becchi, M.F. Grenier-Loustalot, O. Paisse, R. Szymanski, Anal. Chem. 74 (2002) 3849-3857. DOI:10.1021/ac011190e |
| [34] |
R.L. Shearer, Anal. Chem. 64 (1992) 2192-2196. DOI:10.1021/ac00042a030 |
| [35] |
W.A. Aue, X.Y. Sun, J. Chromatogr. 641 (1993) 291-299. DOI:10.1016/0021-9673(93)80145-X |
| [36] |
A.G. Clark, K.B. Thurbide, J. Chromatogr. A 1421 (2015) 154-161. DOI:10.1016/j.chroma.2015.04.007 |
| [37] |
X.L. Ma, S. Velu, J.H. Kim, C.S. Song, Appl. Catal. B: Environ. 56 (2005) 137-147. DOI:10.1016/j.apcatb.2004.08.013 |
| [38] |
B. Millier, X.Y. Sun, W.A. Aue, J. Chromatogr. A 675 (1994) 155-175. DOI:10.1016/0021-9673(94)85270-7 |
| [39] |
International Standard, in: Gas Analysis-Analytical Methods For Hydrogen Fuel-Proton Exchange Membrane (PEM) Fuel Cell Applications For Road Vehicles, ISO, 2019, p. 21087.
|
| [40] |
I. Al-Zahrani, C. Basheer, T. Htun, J. Chromatogr. A 1330 (2014) 97-102. DOI:10.1016/j.chroma.2014.01.015 |
| [41] |
T.B. Ryerson, R.M. Barkley, R.E. Sievers, J. Chromatogr. A 670 (1994) 117-126. DOI:10.1016/0021-9673(94)80286-6 |
| [42] |
K. Toda, P.K. Dasgupta, Chem. Eng. Commun. 195 (2008) 82-97. DOI:10.1080/00986440701569150 |
| [43] |
M.L. Downey, A. Murugan, S. Bartlett, A.S. Brown, J. Chromatogr. A 1375 (2015) 140-145. DOI:10.1016/j.chroma.2014.11.076 |
| [44] |
S. Marine, M. Pedrouzo, R.M. Marce, I. Fonseca, F. Borrull, Talanta 100 (2012) 145-152. DOI:10.1016/j.talanta.2012.07.074 |
| [45] |
A.S. Brown, A.M.H. van der Veen, K. Arrhenius, et al., Trac Trends Anal. Chem. 64 (2015) 42-52. DOI:10.1016/j.trac.2014.08.012 |
| [46] |
E. Gallego, F.J. Roca, J.F. Perales, X. Guardino, E. Gadea, Int. J. Environ. Anal. Chem. 95 (2015) 291-311. DOI:10.1080/03067319.2015.1016012 |
| [47] |
M. Schweigkofler, R. Niessner, Environ. Sci. Technol. 33 (1999) 3680-3685. DOI:10.1021/es9902569 |
| [48] |
A.L. Sunesson, C.A. Nilsson, B. Andersson, J. Chromatogr. A 699 (1995) 203-214. DOI:10.1016/0021-9673(95)00025-I |
| [49] |
P. Mochalski, B. Wzorek, I. Sliwka, A. Amann, J. Chromatogr. B Anal. Technol. Biomed. Life Sci. 877 (2009) 1856-1866. DOI:10.1016/j.jchromb.2009.05.010 |
| [50] |
C. Merlen, M. Verriele, S. Crunaire, et al., Microchem. J. 132 (2017) 143-153. DOI:10.1016/j.microc.2017.01.014 |
| [51] |
C. Merlen, M. Verriele, S. Crunaire, et al., Microchem. J. 143 (2018) 47-54. DOI:10.1016/j.microc.2018.07.020 |
| [52] |
K.H. Kim, J.W. Ahn, Y.J. Choi, H.T. Nguyen, J. Chromatogr. A 1132 (2006) 228-233. DOI:10.1016/j.chroma.2006.07.015 |
| [53] |
International Standard, in: Gas Analysis-Preparation of Calibration Gas Mixtures-Part 1: Gravimetric method For Class I mixtures, ISO, 2015, p. 6142. -1.
|
| [54] |
M.J.T. Milton, G.M. Vargha, A.S. Brown, Metrologia 48 (2011) R1-R9. DOI:10.1088/0026-1394/48/5/R01 |
| [55] |
International Standard, in: General Requirements For the Competence of Testing and Calibration Laboratories, ISO/IEC, 2017, p. 17025.
|
| [56] |
G.H.P. Mohamad, G.S.V. Coles, J. Watson, T. I. Meas. Control 18 (1996) 62-68. DOI:10.1177/014233129601800201 |
| [57] |
R.S. Wright, R.W. Murdoch, J. Air Waste Manag. Assoc. 44 (1994) 428-430. DOI:10.1080/1073161X.1994.10467265 |
| [58] |
J. Barbe, F. Dijoux, C. Yardin, T. Mace, S. Vaslin-Reimann, Meas. Sci. Technol. 21 (2010) 074002. DOI:10.1088/0957-0233/21/7/074002 |
| [59] |
P.J. Brewer, B.A. Goody, T. Gillam, R.J.C. Brown, M.J.T. Milton, Meas. Sci. Technol. 21 (2010) 115902. DOI:10.1088/0957-0233/21/11/115902 |
| [60] |
C.A. Michal, Meas. Sci. Technol. 21 (2010) 105902. DOI:10.1088/0957-0233/21/10/105902 |
| [61] |
International Standard, in: Gas Analysis-Preparation of Calibration Gas Mixtures Using Dynamic Methods-Part 7: Thermal mass-Flow Controllers, ISO, 2018, pp. 6145-6147.
|
| [62] |
International Standard, in: Measurement of Fluid Flow in Closed Conduits-Vocabulary and Symbols, ISO, 1991, p. 4006.
|
| [63] |
International Standard, in: Gas Analysis-Preparation of Calibration Gas Mixtures-Part 6: Critical orifices, ISO, 2003, p. 6145.
|
| [64] |
R. Simo, J.O. Grimalt, J. Albaiges, J. Chromatogr. A 655 (1993) 301-307. DOI:10.1016/0021-9673(93)83236-L |
| [65] |
B. Wang, E.C. Sivret, G. Parcsi, R.M. Stuetz, Talanta 137 (2015) 71-79. DOI:10.1016/j.talanta.2014.11.072 |
| [66] |
L.J.J. Catalan, V. Liang, C.Q. Jia, J. Chromatogr. A 1136 (2006) 89-98. DOI:10.1016/j.chroma.2006.09.056 |