 2021, Vol. 32


b School of Health Sciences, Wuhan University, Wuhan 430071, China
5-Methylcytosine (5mC) is the most important epigenetic modification in mammals [1, 2]. It has been widely recognized that 5mC is a reversible modification in mammalian genomic DNA [3, 4]. Previous studies established that the active DNA demethylation could be achieved through the ten-eleven translocation (TET) protein-mediated oxidization of 5mC with the generation of intermediates of 5-hydroxymethylcytosine (5hmC), 5-formylcytosine (5fC), and 5-carboxylcytosine (5caC) [5]. The 5fC and 5caC can be recognized and cleaved by thymine-DNA glycosylase (TDG) to restore unmodified cytosines at original 5mC sites through base excision repair (BER) pathway [5, 6].
It has been known that 5mC and 5hmC play critical roles in modulating gene expression [7, 8]. The identification of distinct reader proteins specific for 5hmC, 5fC and 5caC indicated they should have individual functions besides serving as the intermediates in the active DNA demethylation pathway [9, 10]. However, unlike the 5mC and 5hmC, the functions of 5caC are still underexplored. Profiling of 5caC in mouse embryonic stem cells (mESCs) demonstrated that 5caC was preferentially occurred at active enhancers [11]. In addition, it has been reported that 5caC-dependent transcriptional regulation was involved in malignant transformation [12, 13]. These studies suggested that 5caC also participated in the regulation of biological processing.
The quantitative analysis of low abundant modifications from nucleic acids mainly relies on mass spectrometry-based detection [14-21]. Mass spectrometry-based methods are straightforward and sensitive, but they only provide quantification data of 5caC [22, 23]. As for the localization analysis of 5caC in genomic DNA, chemical modification-assisted bisulfite sequencing (CAB-Seq) was developed for the base-resolution mapping of 5caC, which was successfully applied in the synthesized 5caC-containing DNA [24]. In addition, the pre-enrichment of 5caC combined with bisulfite sequencing strategy, DNA immunoprecipitation-coupled CAB-seq (DIP-CAB-seq), was also developed to map 5caC in the genomic DNA of mESCs [11]. Although the high-throughput sequencing strategy could localize 5caC in genomic DNA, they are complicated, costly and time-consuming. Meanwhile, the harsh reaction condition of bisulfite treatment will lead to the significant degradation of DNA [25].
The existence of modifications in DNA or RNA may affect the formation of hydrogen bond between the modified nucleobases with complementary nucleobases [26-28]. For example, the methyl group in N6-methyladenosine affects the base paring with thymine or uracil base [29, 30]; the methyl group in N1-methyladenosine significantly compromises the hydrogen bond between N1-methyladenosine and uridine [31]. The idea that modifications in nucleobases may compromise base paring provides us the chance to differentiate 5caC from dC in DNA. However, the 5-carboxylation of cytosine will not affect the hydrogen bond between 5caC and guanine. In this respect, we started with the selective chemical conversion of 5caC to form new base that might affect the canonical Watson-Crick base pairing with guanine.
In the current study, we proposed a chemical conversion in conjugation with ligation-based real-time quantitative PCR (qPCR) method for the site-specific quantification of 5caC in DNA. In this method, 5caC is first reduced to dihydrouracil (DHU) by pyridine borane (Fig. 1A). DHU behaves like thymine and will therefore pair with adenine (DHU-A) (Fig. 1B). However, the normal cytosine will not react with pyridine borane and still pairs with guanine (C-G) (Figs. 1A and B). By utilizing the induced differential base paring, we designed two DNA probes (DNA1 and DNA2) that are complementary to 5caC-DNA downstream and upstream of the 5caC site, respectively. DNA ligase can ligate DNA1 and DNA2 using the 5caC-DNA as template. An adenine that can form the base paring with DHU is put at the 3′-end of DNA1. The specificity for detecting 5caC site is achieved by hybridizing specific oligonucleotides to the flanking regions of 5caC in DNA template. The ligation products were evaluated by real-time qPCR. 5caC in DNA template will be converted to DHU upon pyridine borane treatment, which favors the base paring with the adenine in DNA1 and the nick ligation reaction between DNA1 and DNA2. Thus, the chemical conversion of 5caC to DHU will lead to the generation of a larger amount of ligation products compared to the DNA template without 5caC modification (Fig. 1C). The level of 5caC modification then can be quantitatively characterized by the efficiency of the ligation reaction through subsequent real-time qPCR. The sequences of these DNA are listed in Table S1 (Supporting information).

|
Download:
|
| Fig. 1. The general outline for site-specific quantification of 5caC in DNA by chemical conversion coupled with ligation-based real-time qPCR. (A) 5caC, but not dC, is reduced to DHU by pyridine borane. (B) 5caC pairs with guanine (5caC-G); DHU pairs with adenine (DHU-A); dC pairs with guanine (C-G). (C) 5caC in DNA strand is chemically converted to DHU that pairs with adenine (DHU-A). This chemical conversion favors the ligation reaction with DHU-A base paring. The unconverted dC in DNA doesn't pair with adenine, which hinders the ligation reaction. Subsequent PCR analyses were used to quantitatively detect the level of 5caC modification. | |
It was reported that pyridine borane could reduce 5fC and 5caC to DHU [32]. We first evaluated the reaction of pyridine borane with the nucleosides of cytidine and modified cytidines, including dC, 5mC, 5hmC, 5fC and 5caC by LC-MS/MS analysis. The mass spectrometric parameters are listed in Tables S2 and S3 (Supporting Information). The reaction was carried out at 37 ℃ for 16 h with 1 mol/L pyridine borane. The results showed that both the substrates of 5fC and 5caC disappeared after the reaction, accompanying with the production of DHU (Figs. S1 and S2 in Supporting information). However, neither 5mC nor 5hmC reacted with pyridine borane since the signal intensities of 5mC and 5hmC kept the similar levels before and after the reaction, and no DHU was observed (Figs. S3 and S4 in Supporting information). But we observed a slight decrease (~20%) of dC after the reaction, indicating that dC might partially react with pyridine borane under 16 h incubation (Fig. S5 in Supporting information).
To avoid the reduction of dC to DHU by pyridine borane, we further optimized the reaction time (0 h, 2 h, 4 h, 6 h and 8 h) using the synthesized 5caC-DNA. The resulting 5caC-DNA was enzymatically digested to nucleosides followed by LC-MS/MS analysis. The results showed that 5caC completely disappeared and the expected DHU occurred at 2 h (Figs. 2A-C). As for dC, the signal intensities were almost the same ranging from 0 to 8 h, and no DHU was observed (Figs. S6 and S7 in Supporting information). The results demonstrated that shorter reaction time (< 8 h) will avoid the conversion of dC to DHU. Therefore, the optimized chemical reaction conditions were conducted at 37 ℃ for 6 h with using 1 mol/L of pyridine borane. Under the optimized reaction conditions, 5caC in DNA can be completely reduced to DHU, while dC was not affected (Figs. 2A-C and Fig. S7).

|
Download:
|
| Fig. 2. Examination of the pyridine borane reduction reaction and 5fC blocking reaction using 5caC-DNA and 5fC-DNA strands. Extracted-ion chromatograms of 5caC without (A) and after (B) pyridine borane reduction, and the product of DHU (C). Extracted-ion chromatograms of 5fC without (D) and after (E) blocking reaction by NaBH4, and the product of 5hmC (F). | |
Since 5fC could also be reduced by pyridine borane to generate DHU, which could potentially lead to the interference on the site-specific quantification of 5caC in real sample. Thus, it is essential to block the reaction between 5fC and pyridine borane. Previous report demonstrated that NaBH4 could convert 5fC to 5hmC [33]. In this respect, we utilized NaBH4 to convert 5fC to 5hmC that could not be reduced by pyridine borane as we confirmed. The results showed that 5fC was completely converted to 5hmC; but 5caC didn't react with NaBH4 (Fig. S8 in Supporting information). In addition to the nucleosides, we also examined the reaction using 5fC-DNA. The similar result was observed that 5fC in DNA also could be completely converted to 5hmC (Figs. 2D-F). Collectively, the results demonstrated that the reduction of 5fC to 5hmC using NaBH4 could prevent 5fC from being converted to DHU by pyridine borane.
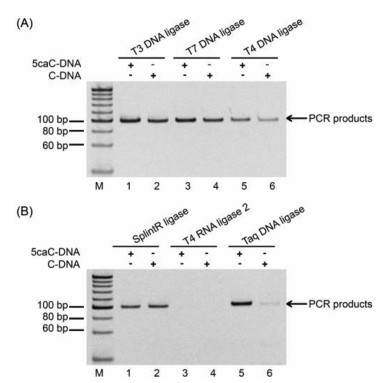
The selectivity of the ligases for distinguishing DHU (originated from 5caC upon pyridine borane reduction) and dC is critical to the ligation-based qPCR assay for site-specific detection of 5caC in DNA. To screen the ligases that can effectively distinguish DHU and dC in DNA, we evaluated the performance of six kinds of commercial ligases, including T3 DNA ligase, T7 DNA ligase, T4 DNA ligase, SplintR ligase, T4 RNA ligase 2 and Taq DNA ligase on DNA ligation efficiencies toward DNA1 and DNA2 with 5caC-DNA or C-DNA as the template (upon pyridine borane treatment). The selection of these ligases is mainly based on their commercial availability and their capability on ligating oligo DNA. The ligation products were amplified by PCR and examined by 10% native polyacrylamide gel electrophoresis (PAGE).
The results showed that the bands had almost the same intensities between 5caC-DNA and C-DNA using T3 DNA ligase (Fig. 3A, lines 1 and 2), T7 DNA ligase (Fig. 3A, lines 3 and 4), and SplintR ligase (Fig. 3B, lines 1 and 2), suggesting that these ligases could not effectively differentiate the mismatch of C-A and the base pair of DHU-A. Thus, these ligases cannot be utilized to distinguish 5caC from dC in DNA. We observed the slightly stronger intensity of band using 5caC-DNA template produced by T4 DNA ligase compared with that of C-DNA (Fig. 3A, lines 5 and 6). As for the T4 RNA ligase 2, no band was observed for either using 5caC-DNA or C-DNA as the template (Fig. 3B, lines 3 and 4). However, the use of Taq DNA ligase showed obvious difference towards 5caC-DNA and C-DNA (Fig. 3B, lines 5 and 6). A much stronger intensity of band was observed using 5caC-DNA than that of C-DNA by Taq DNA ligase (Fig. 3B, lines 5 and 6), indicating that the mismatch of C-A will jeopardize the ligation reaction by Taq DNA ligase. Taq DNA ligase favors the ligation with DHU-A, but not the mismatch of C-A, which offered the possibility for the site-specific quantification of 5caC in DNA by chemical conversion coupled with ligation-based qPCR.

|
Download:
|
| Fig. 3. Screening of ligases to distinguish 5caC and dC in DNA. (A) Screening of T3 DNA ligase, T7 DNA ligase, and T4 DNA ligase to distinguish 5caC and dC in DNA. (B) Screening of SplintR ligase, T4 RNA ligase 2 and Taq DNA ligase to distinguish 5caC and dC in DNA. M is DNA marker | |
To achieve the best discrimination between 5caC and dC in DNA, the ligation temperature, time, and the amount of Taq DNA ligase were optimized. The results showed that the ligation conducted under 45 ℃ had the largest difference of Ct values (average ΔCt 5.0) between 5caC-DNA and C-DNA (Fig. S9A in Supporting information). Thus, 45 ℃ was chosen as the ligation temperature. Similarly, the reaction time was optimized, and the ligation for 15 min offered the largest difference of Ct values (average ΔCt 3.9) between 5caC-DNA and C-DNA (Fig. S9B in Supporting information). Thus, 15 min was utilized as the ligation time. Moreover, we conducted the ligation reaction by using different amounts of Taq DNA ligase. The △Ct reached its maximum when the ligase amount was 0.5 unit (average ΔCt 5.8) (Fig. S9C in Supporting information). Therefore, 0.5 unit Taq DNA ligase was chosen for the ligation reaction. Collectively, the optimized ligation reaction was performed under 45 ℃ for 15 min with 0.5 unit of Taq DNA ligase in a 25-µL system, which provided the largest discrimination between 5caC and dC in DNA.
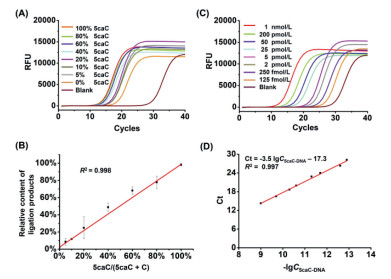
To evaluate the quantitative performance of the ligation-based qPCR strategy for site-specific detection of the 5caC level in DNA, different ratios of 5caC-DNA and C-DNA were mixed with the percentage of 5caC-DNA ranging from 0% to 100% as the templates. The results showed that the Ct values were decreased with the increasing amount of 5caC-DNA (Fig. 4A and Table S4 in Supporting information). The relative ligation products using 5caC-DNA and C-DNA mixture were calculated using the equations of 5caC-DNAcalculated = 2Ct(100% 5caC) − Ct(each percentage of 5caC) × 100%. The results demonstrated that the relative ligation products exhibited a linear correlation to the percentage of 5caC in the mixture of 5caC-DNA and C-DNA with the coefficient of determination (R2) being 0.998 (Fig. 4B), indicating the proposed method is capable of quantitatively measuring 5caC at given site of DNA.

|
Download:
|
| Fig. 4. Quantitative analysis of the level of 5caC in DNA. (A) Real-time fluorescence amplification curves using the mixture of 5caC-DNA and C-DNA templates. Different ratios of 5caC-DNA/C-DNA with the percentages of 5caC-DNA ranging from 0% to 100% were used. (B) The relative ligation products were plotted against to the theoretical percentages of 5caC-DNA in the mixture. (C) Real-time fluorescence amplification curves obtained using different concentrations of 5caC-DNA templates. (D) The generated calibration curve according to (C). | |
We next applied the developed method to quantify 5caC in DNA from more complex system. To this end, we first generated the calibration curve using 5caC-DNA with different concentrations ranging from 125 fmol/L to 1 nmol/L (Fig. 4C). The obtained Ct values were then plotted against the logarithm (lg) of the concentrations of 5caC-DNA templates. The resulting equation of Ct = −3.5 lgC5caC-DNA − 17.3 showed good linearity with the R2 being 0.997 (Fig. 4D).
We then prepared the fragmented genomic DNA isolated from HEK293T cells (Fig. S10 in Supporting information). Different amounts of 5caC-DNA (500 pmol/L, 50 pmol/L and 5 pmol/L) were added into 7.5 µg of fragmented genomic DNA. The samples were then processed with the whole analytical procedure, including NaBH4 reduction, pyridine borane conversion, and ligation-based qPCR analysis. The measured amounts of 5caC-DNA were 455.5 pmol/L, 44.8 pmol/L, and 4.4 pmol/L, respectively (Table S5 in Supporting information). The results showed the relative errors were lower than 12.1%, indicating that the proposed method is of good accuracy and could be used for site-specific quantification of 5caC in DNA from complex biological samples.
In summary, we developed a method for site-specific quantification of 5caC modification in DNA by chemical conversion coupled with ligation-based qPCR. 5caC was selectively converted to DHU by pyridine borane. To avoid the potential interference from 5fC, 5fC was firstly blocked by NaBH4 reduction to form 5hmC. The formed DHU from 5caC favors the base pairing with adenine, which was then employed in the subsequent ligation-based real-time qPCR. We screened six kinds of commercial ligases and found Taq DNA ligase had the best performance to distinguish 5caC from dC in DNA templates. Under optimized ligation conditions, we were able to quantitatively detect 5caC in complex DNA mixture with high accuracy. This developed method is relatively simple and cost-effective. As the proof-of-concept, this developed method was successfully applied in the site-specific quantification of 5caC in synthesized 5caC-containg DNA spiked in complex biological samples. It should be noted that future endeavor should be taken to detect 5caC site in real genomic DNA.
Declaration of competing interestThe authors declare no conflict of interest.
AcknowledgementsThe work is supported by the National Natural Science Foundation of China (Nos. 22074110, 21635006, 21721005), and the Fundamental Research Funds for the Central Universities (2042021kf0212).
Supplementary materialsSupplementary material associated with this article can be found, in the online version, at doi:10.1016/j.cclet.2021.05.020.
| [1] |
C. Luo, P. Hajkova, J.R. Ecker, Science 361 (2018) 1336-1340. DOI:10.1126/science.aat6806 |
| [2] |
T. Liu, C.J. Ma, B.F. Yuan, Y.Q. Feng, Sci. China Chem. 61 (2018) 381-392. DOI:10.1007/s11426-017-9186-y |
| [3] |
F. Spada, S. Schiffers, A. Kirchner, et al., Nat. Chem. Biol. 16 (2020) 1411-1419. DOI:10.1038/s41589-020-0621-y |
| [4] |
B.F. Yuan, Chem. Res. Toxicol. 33 (2020) 695-708. DOI:10.1021/acs.chemrestox.9b00372 |
| [5] |
X. Wu, Y. Zhang, Nat. Rev. Genet. 18 (2017) 517-534. |
| [6] |
Y. Feng, N.B. Xie, W.B. Tao, et al., CCS Chem 2 (2020) 994-1008. |
| [7] |
T. Carell, M.Q. Kurz, M. Muller, M. Rossa, F. Spada, Angew. Chem. Int. Ed. 57 (2018) 4296-4312. DOI:10.1002/anie.201708228 |
| [8] |
Q.Y. Li, N.B. Xie, J. Xiong, B.F. Yuan, Y.Q. Feng, Anal. Chem. 90 (2018) 14622-14628. DOI:10.1021/acs.analchem.8b04833 |
| [9] |
C.G. Spruijt, F. Gnerlich, A.H. Smits, et al., Cell 152 (2013) 1146-1159. DOI:10.1016/j.cell.2013.02.004 |
| [10] |
J. Xiong, B.F. Yuan, Y.Q. Feng, Chem. Res. Toxicol. 32 (2019) 808-819. DOI:10.1021/acs.chemrestox.9b00042 |
| [11] |
X. Lu, D. Han, B.S. Zhao, et al., Cell Res 25 (2015) 386-389. DOI:10.1038/cr.2015.5 |
| [12] |
D. Zhou, B.M. Alver, S. Li, et al., Genome Biol 19 (2018) 43. DOI:10.1186/s13059-018-1420-6 |
| [13] |
T.M. Storebjerg, S.H. Strand, S. Hoyer, et al., Clin. Epigenetics 10 (2018) 105. DOI:10.1186/s13148-018-0540-x |
| [14] |
Q.Y. Cheng, J. Xiong, C.J. Ma, et al., Chem. Sci. 11 (2020) 1878-1891. DOI:10.1039/C9SC05094A |
| [15] |
M.D. Lan, B.F. Yuan, Y.Q. Feng, Chin. Chem. Lett. 30 (2019) 1-6. DOI:10.1016/j.cclet.2018.04.021 |
| [16] |
C.B. Qi, J.H. Ding, B.F. Yuan, Y.Q. Feng, Chin. Chem. Lett. 30 (2019) 1618-1626. DOI:10.1016/j.cclet.2019.02.005 |
| [17] |
C.B. Qi, H.P. Jiang, J. Xiong, B.F. Yuan, Y.Q. Feng, Chin. Chem. Lett. 30 (2019) 553-557. DOI:10.1016/j.cclet.2018.11.029 |
| [18] |
X.J. You, T. Liu, C.J. Ma, et al., Anal. Chem. 91 (2019) 10477-10483. DOI:10.1021/acs.analchem.9b01318 |
| [19] |
J. Xiong, T.T. Ye, C.J. Ma, et al., Nucleic Acids Res 47 (2019) 1268-1277. DOI:10.1093/nar/gky1218 |
| [20] |
B. Chen, J. Xiong, J.H. Ding, B.F. Yuan, Y.Q. Feng, Chem. Res. Toxicol. 32 (2019) 2078-2085. DOI:10.1021/acs.chemrestox.9b00249 |
| [21] |
Q.Y. Cheng, J. Xiong, F. Wang, B.F. Yuan, Y.Q. Feng, Chin. Chem. Lett. 29 (2018) 115-118. DOI:10.1016/j.cclet.2017.06.009 |
| [22] |
Y. Tang, S.J. Zheng, C.B. Qi, Y.Q. Feng, B.F. Yuan, Anal. Chem. 87 (2015) 3445-3452. DOI:10.1021/ac504786r |
| [23] |
Y. Tang, J. Xiong, H.P. Jiang, et al., Ana.l Chem 86 (2014) 7764-7772. DOI:10.1021/ac5016886 |
| [24] |
X. Lu, C.X. Song, K. Szulwach, et al., J. Am. Chem. Soc. 135 (2013) 9315-9317. DOI:10.1021/ja4044856 |
| [25] |
K. Tanaka, A. Okamoto, Bioorg. Med. Chem. Lett. 17 (2007) 1912-1915. DOI:10.1016/j.bmcl.2007.01.040 |
| [26] |
M. Saikia, Q. Dai, W.A. Decatur, et al., RNA 12 (2006) 2025-2033. DOI:10.1261/rna.208906 |
| [27] |
F. Tang, S. Liu, Q.Y. Li, et al., Chem. Sci. 10 (2019) 4272-4281. DOI:10.1039/C8SC04946G |
| [28] |
B. Chen, B.F. Yuan, Y.Q. Feng, Anal. Chem. 91 (2019) 743-756. DOI:10.1021/acs.analchem.8b04078 |
| [29] |
Y. Xiao, Y. Wang, Q. Tang, et al., Angew. Chem. Int. Ed. 57 (2018) 15995-16000. DOI:10.1002/anie.201807942 |
| [30] |
W. Liu, J. Yan, Z. Zhang, et al., Chem. Sci. 9 (2018) 3354-3359. DOI:10.1039/C7SC05233B |
| [31] |
J.H. Ding, C.J. Ma, M.Y. Chen, et al., Anal. Chem. 92 (2020) 2612-2619. DOI:10.1021/acs.analchem.9b04454 |
| [32] |
Y. Liu, P. Siejka-Zielinska, G. Velikova, et al., Nat. Biotechnol. 37 (2019) 424-429. DOI:10.1038/s41587-019-0041-2 |
| [33] |
C.X. Song, K.E. Szulwach, Q. Dai, et al., Cell 153 (2013) 678-691. DOI:10.1016/j.cell.2013.04.001 |