 2021, Vol. 32


b Laboratory on Pollution Monitoring and Control, College of Chemistry and Chemical Engineering, Xinjiang Normal University, Urumqi 830054, China;
c School of Chemistry and Chemical Engineering, Gannan Normal University, Ganzhou 341000, China;
d Department of Chemistry and Chemical Engineering, Education and Research Center for Smart Energy and Materials, Inha University, Incheon 402-701, Republic of Korea;
e College of Chemistry, Zhengzhou University, Zhengzhou 450001, China
High performance liquid chromatography (HPLC) is one of the most broadly used separation tools, and has picked up extensive attention in various fields such as food, medicine, chemical engineering, as well as environment science [1-4]. The separation medium filled in the chromatographic column, as a key part of HPLC system, cannot only determine the separation mode of liquid chromatography, but also influence the elution behavior of the analyte [4]. Therefore, the design, synthesis, application of new type chromatographic medium and the separation mechanism is still important for HPLC.
With the rapid development of nanoscience and technology, many advanced nanomaterials, such as fullerene [5-7], carbon nanotube (CNT) [5-7], graphene (G) [5, 7-9], graphene oxide (GO) [5, 7-9], nanodiamond [6, 10, 11], metal-organic frameworks (MOFs) [12-14], covalent organic frameworks (COFs) [15-19], have been demonstrated to be promising nanomaterials for chromatographic separation due to their outstanding physical and chemical characteristics [5-8]. For example, their large specific surface area can enhance the retention capacity or sorption performance of the analyte. Some unique surface chemical properties, including coordination, hydrogen-bonding, hydrophilic/hydrophobic and π-π interactions etc., can provide distinct selectivity towards the separation of various analytes. Although these nanomaterials possess the above-mentioned advantages and achieve significant progress, there are still some inherent problems that cannot be avoided, such as a tedious and time-consuming preparation procedure. The over strong adsorption capacity of nanomaterials hinders rapid elution of analytes from the stationary phase, which may lead to the chromatographic peak asymmetry. In addition, the irregular morphology and easy agglomeration of nanomaterial usually affect the homogeneity of the packings and result in low column efficiency [5]. It is still a challenge to look for a new kind of material with high separation efficiency and excellent selectivity as chromatographic separation medium.
Carbon dots (CDs), as a new class of "zero-dimensional" quasi-spherical carbon-based nanomaterials, have many outstanding characteristics including small size, excellent chemical stability and water solubility, moderate adsorption performance, high surface-to-volume ratio, and facile functionalization, making them promising alternatives in a variety of applications [20-24]. Our research group first proposed the idea of using carbon dots (CDs)-modified silica stationary phases for hydrophilic interaction chromatography (HILIC), which not only maintain spherical morphology, but also have a variety of hydrophilic types [25-31]. In addition, compared with traditional carbon-based nanomaterials, the biggest advantage of CDs is that it can avoid the terrible aggregation that other carbon-based nanomaterials usually encounter.
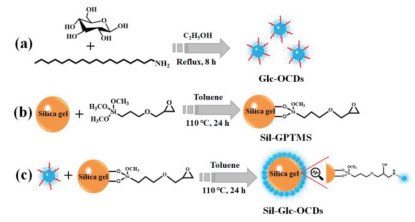
However, as far as we know, the reversed-phase liquid chromatography (RPLC) stationary phase based on CDs-bonded silica has not been reported so far. Thus, in this work, glucose and octadecylamine were selected as carbon sources to produce hydrophobic carbon dots (Glc-OCDs) by solvothermal method. Subsequently, Glc-OCDs were supported on the spherical porous silica surface by the "Nano-on-Micro" strategy to obtain a silica-bonded Glc-OCDs (Sil-Glc-OCDs) stationary phase (Fig. 1). The detail of the synthesis can be found in the Supporting information.

|
Download:
|
| Fig. 1. Schematic illustration diagram for the fabrication of the Sil-Glc-OCDs stationary phase. | |
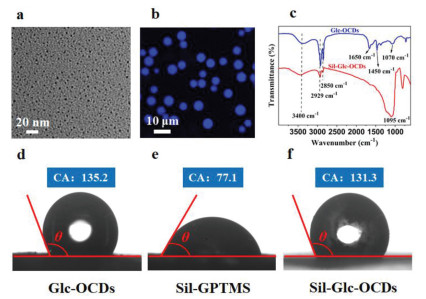
A series of characterizations were applied to verify the successful preparation of Glc-OCDs and Sil-Glc-OCDs. Transmission electron microscopy (TEM) was used to obtain the morphology and size of material. As displayed in Fig. 2a, the Glc-OCDs with quasi-spherical structure, and the average diameter is around 5.4 nm (Fig. S1 in Supporting information). In addition, the fluorescence properties of Glc-OCDs permit the coverage of Glc-OCDs on silica to be characterized by means of laser scanning confocal microscope (LSCM). From the dark-field images of Sil-Glc-OCDs (Fig. 2b), it can be seen that each silica sphere is covered with uniform blue fluorescence, which indicates that the bonding reaction between Glc-OCDs and silica is successful.

|
Download:
|
| Fig. 2. Characterizations of Glc-OCDs and Sil-Glc-OCDs. TEM image of Glc-OCDs (a); LSCM image of Sil-Glc-OCDs (b); FT-IR spectra (c) of Glc-OCDs (blue) and Sil-Glc-OCDs (red). Contact angle analysis results of Glc-OCDs (d), Sil-GPTMS (e), and Sil-Glc-OCDs (f). | |
FT-IR spectroscopy was performed to further confirm the bonding of Glc-OCDs on the spherical silica surface, as shown in Fig. 2c. The typical absorption peak located at ~1650 cm-1 in Glc-OCDs are ascribed to the stretching vibration of carbonyl and the bending vibration of N-H. The absorption peaks at ~1580 cm-1, ~1450 cm-1 and ~1070 cm-1 are attributed to the bending vibration peaks of primary amine and methylene, and C-O stretching vibrations of ether, respectively. In addition, the large broad peak at ~3400 cm-1 of the secondary N-H/O-H stretching vibration peaks brought by Glc-OCDs can also be observed in the Sil-Glc-OCDs spectrum, peaks at ~2929 cm-1 as well as 2850 cm-1 of C-H indicate the presence of abundant aliphatic hydrocarbon (methylene) in Glc-OCDs and Sil-Glc-OCDs. 1095 cm-1 is indexed to the stretching vibration peak of Si-O on the silane reagent or silica. The above results clearly confirmed the Glc-OCDs were successfully stabilized on the spherical silica surface.
Elemental analysis (EA) results were listed in Table S1 (Supporting information). Compared with the C and N percentages of Sil-GTPMS (5.62% and 0%), the C and N content of Sil-Glc-OCDs are 9.01% and 0.78%, respectively. The significant increase of the C and N content confirmed the successful synthesis of the stationary phase. The bonding density of the Glc-OCDs was approximately 1.82 µmol/m2. The calculation formula of the bonding density of the Glc-OCDs is described as: µmol/m2 = (N% × 106)/(MN × S). Where MN represents the molar mass of nitrogen, and S denotes the surface area of silica (306 m2/g), N% stands for the percentage of the increased nitrogen content [32, 33]. The characterizations of Sil-Glc-OCDs including TG, XPS and BET are shown in Figs. S2-S4 (Supporting information).
In addition, the wettability of the prepared materials to water was measured by contact angle (CA) test. The support was immobilized on a flat substrate, upon which 10 µL water droplet was dispensed. According to the general definition, solid surface that has CA θ > 90° is deemed to be hydrophobic, and those that has CA beyond 150° is superhydrophobic [34]. The test results (Figs. 2d-f) showed that CAs for Glc-OCDs, Sil-GTPMS and Sil-Glc-OCDs were 135.2°, 77.1°, 131.3°, indicating the hydrophobic property Sil-Glc-OCDs, which would be intuitively verified in the subsequent chromatographic evaluation.
The performance of Sil-Glc-OCDs stationary phase was first evaluated by the Tanaka standard test mixture, which is a test commonly applied to investigate the hydrophobic selectivity, shape selectivity, and hydrogen bonding capacity [35-37]. Firstly, the hydrophobic selectivity was evaluated by the retention factor ratio (αCH > 1) of pentylbenzene and butylbenzene. As given in Table S2 (Supporting information), αCH is 1.64 (αCH > 1), compared with C 18 column (αCH = 1.44), our stationary phase has better hydrophobic selectivity. The hydrogen-bonding interaction was studied by the ratio of retention factor (αC/P) of caffeine to phenol. As listed in Table S2, αC/P is 0.63, which demonstrated that there may exist weak hydrogen-bonding interaction similar to that of C18 column (αC/P = 0.62), and only a few silanol groups residues on the stationary phase surface. As an indicator of molecular-shape selectivity of the stationary phase, the retention factor ratio between triphenylene (planar) and o-terphenyl (highly twisted) (αT/O = KT/KO) was calculated to explain the capability of the stationary phase to differentially separate nonplanar and planar analytes with similar molecular sizes and weights. Value ofαT/O < 2 that represents phase has a low molecular-recognition characteristic, whereas value of αT/O > 3 suggests phase with increased shape selectivity. As illustrated in Table S2, αT/O is 3.28, indicating our prepared stationary phase displays better shape selectivity to differentiate compounds based on similar spatial configurations.
To investigate the hydrophobic selectivity of Sil-Glc-OCDs stationary phase, alkylbenzenes were selected as the analytes. As shown in Fig. 3a, eight alkylbenzene was efficiently separated using methanol/water as the mobile phase. It is worth mentioning that this stationary phase can also separate the isomers of tert-butylbenzene, sec-butylbenzene, isobutylbenzene and n-butylbenzene, which may be due to the strong hydrophobic interaction.

|
Download:
|
| Fig. 3. (a) Chromatogram for the separation of alkylbenzenes on Sil-Glc-OCDs stationary phase. Analytes: (1) ethylbenzene, (2) isopropylbenzene, (3) propylbenzene, (4) tert-butylbenzene, (5) sec-butylbenzene, (6) isobutylbenzene, (7) n-butylbenzene, (8) n-pentylbenzene. Conditions: flow rate = 1.0 mL/min, UV detection: 254 nm, T = 30 ℃; mobile phase: methanol/H2O (55%/45%, v/v); (b) Plot of log k values versus the numbers of methylene groups of alkylbenzenes at different mobile phase compositions. | |
In RPLC mode, it has often been observed that retention factor values (k) for the members of a homologous series increase exponentially with the number of homologous units [38, 39]. Plots of the number of methylene groups of alkylbenzenes versus the log k are shown in Fig. 3b. The linear relationships between the numbers of methylene groups versus the log k values were still good under different proportion of mobile phase, and the correlation coefficients were calculated within 0.990-0.997. The results further show that the Sil-Glc-OCDs stationary phase has good hydrophobic selectivity, which is ascribed to the C18 chain on the surface of the Glc-OCDs.
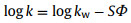
In typical RPLC system, with the increasing of the proportion of organic solvent in the mobile phase, the k values of non-polar samples are usually found to decreases exponentially. The log k versus the weight fraction or volume of organic solvent satisfies the equation:
|
(1) |
[40], where k represents the extrapolated k value in pure water, S is the slope of log k versus ϕ when fitted to a linear regression model, ϕ stands for the volume fraction of organic solvent. Fig. S5 (Supporting information) displayed the relationship between log k and methanol volume fraction, which fitted well with at a range of 55%−75% methanol content, and the correlation coefficients are 0.990-0.996. Meanwhile, with the increase of the volume fraction of methanol in the mobile phase, the retention of all model analytes decreased, indicating that the Sil-Glc-OCDs column has typical RPLC characteristics.
Fig. S6 (Supporting information) showed the chromatograms of separating polycyclic aromatic hydrocarbons (PAHs), phenols, and sulfonamides by commercial C18 column and Sil-Glc-OCDs column. From the contrasting chromatograms we noticed that eight phenols could be separated in a shorter time on C18 column. The o-terphenyl and benzanthracene of seven PAHs could not be well separated on C18 column. Even at a flow rate of 0.8 mL/min, seven sulfonamides were unable to achieve baseline separation on C18 column. By contrast, PAHs and corresponding sulfonamides were better separated on Sil-Glc-OCDs column. The results are attributed to the fact that Sil-Glc-OCDs chromatographic column contains more functional groups than commercial C18 column.
The longevity of the stationary phase is also a key factor worthy of attention. To investigate the stability of our prepared stationary phase, the retention of Tanaka standard test mixture including caffeine, uracil, n-butylbenzene, phenol, n-pentylbenzene, triphenylene and o-terphenyl were investigated for 24 h of continuous elution. As depicted in Fig. S7 (Supporting information), the RSD values (n = 12) of the retention times were between 0.59% and 0.99%. The results show that the stationary phase has good stability.
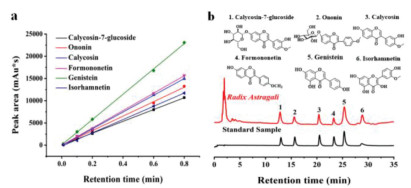
Radix Astragali is one of the famous traditional Chinese medicines. Its main active ingredient, flavonoids, has extensive pharmacological effects such as anti-oxidation, anti-inflammatory, anti-aging, anti-tumor, protecting myocardium, and immune regulation. Therefore, the detection and separation of flavonoids in Radix Astragali is of great significance. The Sil-Glc-OCDs stationary phase was employed to separate and quantify flavonoids from Radix Astragali extract sample. Fig. 4a displayed the standard curves of calycosin-7-glucoside, ononin, calycosin, formononetin, genistein and isorhamnetin. The linear equations are y = 13, 283.14x + 42.2089, y = 16, 274.91x + 15.8701, y = 18, 832.53x - 83.7157, y = 19, 579.63x - 50.58, y = 28, 461.17x + 67.95, y = 14, 930.71x - 216.22, respectively. And the correlation coefficients (R2) are 0.9996, 0.9985, 0.9998, 0.9996, 0.9993 and 0.9991. Fig. 4b showed chromatograms for the Radix Astragali extract sample and the six flavonoids standards. It can be seen from this figure that the sample matrix has no obvious interference effect on the detection of calycosin-7-glucoside, ononin, calycosin, formononetin, genistein and isorhamnetin. The concentration of calycosin-7-glucoside, ononin, calycosin, formononetin, genistein and isorhamnetin in Radix Astragali extract were calculated to be 0.15 g/L, 0.088 g/L, 0.14 g/L, 0.086 g/L, 0.18 g/L and 0.29 g/L, respectively. The above results further indicate the promising potential of the Sil-Glc-OCDs column for pharmaceutical separation.

|
Download:
|
| Fig. 4. (a) The standard curves of calycosin-7-glucoside, ononin, calycosin, formononetin, genistein and isorhamnetin; (b) Chromatograms of the separation of calycosin-7-glucoside, ononin, calycosin, formononetin, genistein and isorhamnetin standards and actual samples. Conditions: mobile phase: methanol-0.3% formic acid solution (0-30 min, 10%→60% methanol, 90%→40% 0.3% formic acid solution); flow rate = 1.0 mL/min, UV detection wavelength: 254 nm, T = 30 ℃. | |
In summary, a new kind of Sil-Glc-OCDs reversed-phase chromatographic stationary phase was synthesized and characterized carefully. By calculating the ratio of the retention factor on the stationary phase of the Tanaka test mixture, it was found that the stationary phase had good hydrophobicity, shape selectivity and week hydrogen-bonding interaction. Several types of analytes including PAHs, alkylbenzene, phenols and sulfonamides were used to evaluate the separation performance of this stationary phase under RPLC mode. The stationary phase exhibited satisfactory separation performance for all the tested analytes. Better separation performance for some analytes over commercial C18 column was obtained. By investigating the relationship between log k and the number of methylene groups or the proportion of methanol in the mobile phase, it was found that the stationary phase exhibited typical hydrophobic chromatographic characteristics. Moreover, this work provides a new approach to separate the isomers of tert-butyl benzene, sec-butyl benzene, isobutylbenzene and n-butylbenzene. Therefore, it is reasonable to believe that the development of CDs-based stationary phase with better separation performance will be helpful to further understand the chromatographic behavior of CDs. For another, more types of CDs can be coated on different substrates lead to a wide range of applications in sample preparation, biosensor, and so on.
Declaration of competing interestThe authors declare that they have no known competing financial interests or personal relationships that could have appeared to influence the work reported in this paper.
AcknowledgmentsThis work has received financial support from Science and Technology Project of Science and Technology Bureau of Chengguan District in Lanzhou City (No. 2020JSCX0033), National Natural Science Foundation of China (No. 21822407), Youth Innovation Promotion Association CAS, and the National Research Foundation of Korea (NRF) grant funded by the Korean government (MSIT: Ministry of Science and ICT) (No. NRF-2019R1A2C1010032).
Supplementary materialsSupplementary material associated with this article can be found, in the online version, at doi:10.1016/j.cclet.2021.04.052.
| [1] |
N. Hamada, Y. Hashi, S. Yamaki, et al., Chin. Chem. Lett. 30 (2019) 99-102. DOI:10.1016/j.cclet.2018.10.029 |
| [2] |
C. Qi, H. Jiang, J. Xiong, B. Yuan, Y. Feng, Chin. Chem. Lett. 30 (2019) 553-557. DOI:10.1016/j.cclet.2018.11.029 |
| [3] |
J. Chen, Z. Gong, W. Tang, K.H. Row, H. Qiu, TrAC Trends Anal. Chem. 134 (2021) 116135. DOI:10.1016/j.trac.2020.116135 |
| [4] |
A.H. Duan, S.M. Xie, L.M. Yuan, TrAC Trends Anal. Chem. 30 (2011) 484-491. DOI:10.1016/j.trac.2011.01.007 |
| [5] |
M. Zhang, H. Qiu, TrAC Trends Anal. Chem. 65 (2015) 107-121. DOI:10.1016/j.trac.2014.10.008 |
| [6] |
A. Speltini, D. Merli, A. Merli, Anal. Chim. Acta 783 (2013) 1-16. DOI:10.1016/j.aca.2013.03.041 |
| [7] |
Q. Wu, H. Lv, L. Zhao, TrAC Trends Anal. Chem. 129 (2020) 115941. DOI:10.1016/j.trac.2020.115941 |
| [8] |
L. Song, H. Zhang, T. Cai, J. Chen, H. Qiu, Chin. Chem. Lett. 30 (2019) 863-866. DOI:10.1016/j.cclet.2018.10.040 |
| [9] |
X. Zhang, S. Chen, Q. Han, M. Ding, J. Chromatogr. A 1307 (2013) 135-143. DOI:10.1016/j.chroma.2013.07.106 |
| [10] |
Z. Xue, J.C. Vinci, L.A. Colón, ACS Appl. Mater. Inter. 8 (2016) 4149-4157. DOI:10.1021/acsami.5b11871 |
| [11] |
T. Cai, H. Zhang, Z. Li, A.F.M.M. Rahman, H. Qiu, RSC Adv. 6 (2016) 32757-32760. DOI:10.1039/C6RA04824B |
| [12] |
C.X. Yang, X.P. Yan, Anal. Chem. 83 (2011) 7144-7150. DOI:10.1021/ac201517c |
| [13] |
X. Li, B. Li, M. Liu, et al., ACS Appl. Mater. Interfaces 11 (2019) 10320-10327. DOI:10.1021/acsami.9b00285 |
| [14] |
T. Si, J. Ma, X. Lu, et al., ACS Appl. Nano Mater. 3 (2020) 351-356. DOI:10.1021/acsanm.9b01987 |
| [15] |
J. Huang, X. Han, S. Yang, et al., J. Am. Chem. Soc. 141 (2019) 8996-9003. DOI:10.1021/jacs.9b03075 |
| [16] |
H.L. Qian, C.X. Yang, W.L. Wang, C. Yang, X.P. Yan, J. Chromatogr. A 1542 (2018) 1-18. DOI:10.1016/j.chroma.2018.02.023 |
| [17] |
L. Chen, Q. Wu, J. Gao, et al., TrAC Trends Anal. Chem. 113 (2019) 182-193. DOI:10.1016/j.trac.2019.01.016 |
| [18] |
J. Chen, Y. Huang, X. Wei, et al., Chem. Commun. 55 (2019) 10908-10911. DOI:10.1039/C9CC05307G |
| [19] |
Q. Luo, X. Ren, S. Wei, et al., Anal. Bioanal. Chem. 412 (2020) 1365-1374. DOI:10.1007/s00216-019-02363-3 |
| [20] |
Y. Liu, H. Huang, W. Cao, et al., Mater. Chem. Front. 4 (2020) 1586-1613. DOI:10.1039/D0QM00090F |
| [21] |
G. Han, J. Zhao, R. Zhang, et al., Angew. Chem. Int. Ed. 58 (2019) 7087-7091. DOI:10.1002/anie.201903005 |
| [22] |
Z. Kang, T. S.-.Lee, Nanoscale 11 (2019) 19214-1924. DOI:10.1039/C9NR05647E |
| [23] |
C. Hu, M. Li, J. Qiu, Y.P. Sun, Chem. Soc. Rev. 48 (2019) 2315-2337. DOI:10.1039/C8CS00750K |
| [24] |
M.L. Liu, B.B. Chen, C.M. Li, C.Z. Huang, Green Chem. 21 (2019) 449-471. DOI:10.1039/C8GC02736F |
| [25] |
H. Zhang, X. Qiao, T. Cai, et al., Anal. Bioanal. Chem. 409 (2017) 2401-2410. DOI:10.1007/s00216-017-0187-z |
| [26] |
T. Cai, H. Zhang, A.F.M.M. Rahman, Y.P. Shi, H. Qiu, Microchim. Acta 184 (2017) 2629-2636. DOI:10.1007/s00604-017-2277-1 |
| [27] |
Y. Yang, H. Zhang, J. Chen, et al., Analyst 145 (2020) 1056-1061. DOI:10.1039/C9AN02246E |
| [28] |
L. Song, H. Zhang, J. Chen, et al., Talanta 209 (2020) 120518. DOI:10.1016/j.talanta.2019.120518 |
| [29] |
T. Cai, H. Zhang, J. Chen, Z. Li, H. Qiu, J. Chromatogr. A 1597 (2019) 142-148. DOI:10.1016/j.chroma.2019.03.026 |
| [30] |
N. Yuan, J. Chen, T. Cai, et al., J. Chromatogr. A 1619 (2020) 460930. DOI:10.1016/j.chroma.2020.460930 |
| [31] |
N. Yuan, J. Chen, H. Zhou, et al., Talanta 218 (2020) 121140. DOI:10.1016/j.talanta.2020.121140 |
| [32] |
H. Liu, Y. Guo, X. Wang, et al., RSC Adv. 4 (2014) 17541-17548. DOI:10.1039/C4RA01408A |
| [33] |
B. Yang, H. Liu, J. Chen, M. Guan, H. Qiu, J. Chromatogr. A 1468 (2016) 79-85. DOI:10.1016/j.chroma.2016.09.021 |
| [34] |
M. Zhang, J. Chen, T. Gu, H. Qiu, S. Jiang, Talanta 126 (2014) 177-184. DOI:10.1016/j.talanta.2014.03.057 |
| [35] |
N. Tanaka, Y. Tokuda, K. lwaguchi, M. Araki, J. Chromatogr. A 239 (1982) 761-772. DOI:10.1016/S0021-9673(00)82036-1 |
| [36] |
W. Zhao, J. Chu, F. Xie, et al., J. Chromatogr. A 1485 (2017) 44-51. DOI:10.1016/j.chroma.2016.12.019 |
| [37] |
E. Lesellier, C. West, J. Chromatogr. A 1574 (2018) 71-81. DOI:10.1016/j.chroma.2018.09.004 |
| [38] |
G.E. Berendsen, L.D. Galan, J. Chromatogr. A 196 (1980) 21-37. DOI:10.1016/S0021-9673(00)80356-8 |
| [39] |
Q. Wu, L. Chen, J. Gao, et al., Talanta 194 (2019) 105-113. DOI:10.1016/j.talanta.2018.10.005 |
| [40] |
M. Czok, H. Engelhardt, Chromatographia 27 (1989) 5-14. DOI:10.1007/BF02290396 |