 2021, Vol. 32


b Institute for Advanced Interdisciplinary Research, University of Jinan, Jinan 250011, China
In recent years, biosensors have been extensively applied in the fields including food safety, environment monitoring, medical research and disease diagnosis [1-4]. Organic field-effect transistors (OFETs), as new styles of biosensors, received wide attention. There are numerous advantages of OFETs as biosensors: Organic semiconductors have flexibility, which can be used to create flexible devices; most are polymers with long alkyl chains, which are stable in air, have strong water resistance, and good biocompatibility. Moreover, the mobility, source-drain current and threshold voltage can be used to generate an electrical output signal, thus enabling multi-channel sensing. Due to the signal conversation function of OFETs, label-free determination can be realized [5-9].
Efforts have been made to develop highly responsive and sensitive OFETs-based biosensors. It will be fundamental to improve the transport performance of OFET carriers to obtain more electrical signal [10]. Chen et al. synthetized a new organic semiconductor material named dialkoxyphenyl pentathiophene derivative (2R5T2R) through molecular design, which exhibited highly sensitive detection of melamine [11]. Minamiki et al. described an extended gate-based biosensor to realize a high response to the histidine-rich protein by optimization of device structure [12]. Hammock et al. developed a biosensor based on OFETs using gold nanoparticles binding sites to modify the surface of 5, 5′-bis-(7-dodecyl-9H-fluoren-2-yl)-2, 2′-bithiophene (DDFTTF), which showed high sensitivity for thrombin protein detection by means of chemical modification [13]. Nevertheless, the experimental procedures using above strategies are complex, costly and time-consuming. A new and simple method for improving sensitivity is desired.
It is found that many organic polymer semiconductor materials demonstrate good photoelectric effect owing to their wide absorption peaks and narrow optical band gaps. Appropriate wavelengths (λ) of light irradiation can induce the separation of charges in the organic semiconductor layer, producing photogenerated carriers and forming a photocurrent under the drive of source and drain voltage [14-16]. Compared with dark conditions, more carriers can be obtained in the channel, thus leading to an increase in the magnitude of channel current. Therefore, we design to apply the property of photo response of polymer semiconductors to biosensors based on OFETs and take the change of channel current as output signal. The existence of light has a signal enhancement effect equivalent to signal amplification. In this case, just a beam of suitable light can greatly improve the responsivity and sensitivity for biomolecule detection, which indeed achieves low cost, easy operation and quick determination. Furthermore, while this novel biosensor is utilized to diagnose disease, higher sensitivity represents that early intervention and treatment of diseases can be better realized to improve clinical prognosis.
Herein, we fabricated a biosensor based on bottom-gate and bottom-contact (BGBC) OFET with poly{2, 2′-[(2, 5-bis(2-octyldodecyl)-3, 6-dioxo-2, 3, 5, 6-tetrahydropyrrolo[3, 4-c] pyrrole-1, 4-diyl)] dithiophene-5, 5′-diyl-alt-thieno[3, 2-b] thiophene-2, 5-diyl} (PDBT-co-TT) [17] thin film. We investigated that the polymer is an organic semiconductor material as well as a photoelectric active material. Taking the detection of liver cancer marker alpha-fetoprotein (AFP) antigen as a representative example of disease diagnosis [18-20], the expansion of the detection signal and a maximum responsivity [21] (defined as ΔI/I=(IL(D)Ag−IDAb)/IDAb, where L(D) refers to light or dark, Ag represents antigen, Ab represents antibody) of over 103 after light illumination were achieved. Moreover, extremely low AFP concentration could not be detected in the dark, while it was well detected in the light, suggesting that the sensitivity could be greatly improved.
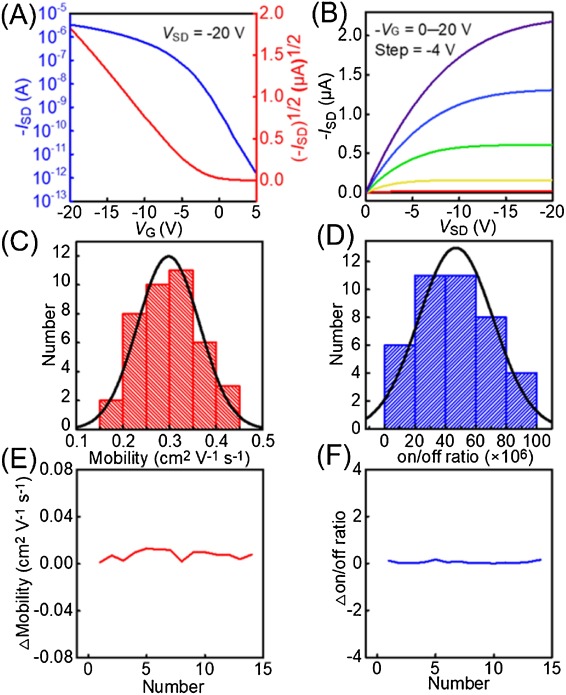
OFETs with donor-acceptor (D-A) polymer PDBT-co-TT, chemical structure of which is shown in Fig. S1A (Supporting information), were assembled and parameters of the devices were determined. The conducive channel length (L) and width (W) were approximately 25 μm and 210 μm, respectively (Fig. S1B in Supporting information), and the growth of the thin film was uniform and dense. The transfer and output characteristic curves were examined in darkness. As shown in Fig. 1A and B, the devices exhibited p-type behaviour and excellent output performance. The mobility μ at saturation regions were obtained from the transfer curves (ISD-VG, VSD = ‒20 V) based on the following equation (Eq. 1):

|
(1) |

|
Download:
|
| Fig. 1. Electrical characteristics of BGBC OFETs. (A) Transfer curves of PDBT-co-TT-based OFETs measured at VSD = ‒20 V. (B) Output curves withVG tuning from 0 V to ‒20 V in steps of −4 V in dark. (C) Normal distribution diagram of mobility was calculated from 40 devices. (D) Normal distribution diagram of on/off ratio was calculated from 40 devices. The change in the mobility (E) and on/off ratio (F) from one randomly selected OFET was calculated. | |
where ISD represents channel current, Ci represents the capacitance per unit area of gate dielectric layer; VG is the gate voltage; Vth is the threshold voltage. Calculation using 40 OFET devices indicated that the maximum mobility (hole) is 0.43 cm2 V−1 s−1, with a mean of 0.30 cm2 V−1 s−1 (Fig. 1C) and maximal on/off ratio is 9.85 × 10⁷, with a mean of 4.68 × 10⁷ (Fig. 1D).
To further characterize the stability of the device, one OFET was randomly selected from among these 40 devices, and 15 measurements were performed repeatedly (Figs. S1C‒F in Supporting information). The change of mobility in Fig. 1E was defined as ΔMobility = [(Mobility, N) ‒ (Mobility, N–1)] and the change of on/off ratio in Fig. 1F was defined as Δon/off ratio = [(on/off ratio, N) ‒ (on/off ratio, N–1)]/(on/off ratio, N–1), (Mobility, N) and (on/off ratio, N) are the mobility and on/off ratio of the Nth measurement, respectively, and the maximum value of N is 15. The above two change values were around 0 within 0.013 cm2 V−1 s−1 and 0.168, suggesting that the performance of the OFET device was without destruction under successive 15 measurements and stable experimental conditions were guaranteed. The reason why the OFET device is extremely stable may be that the densely packed polymer film with long alkyl-side chains prevented the penetration of water and oxygen in the air [22]. It can be seen from the basic electrical characteristics that this transistor meets the needs for biological detection.
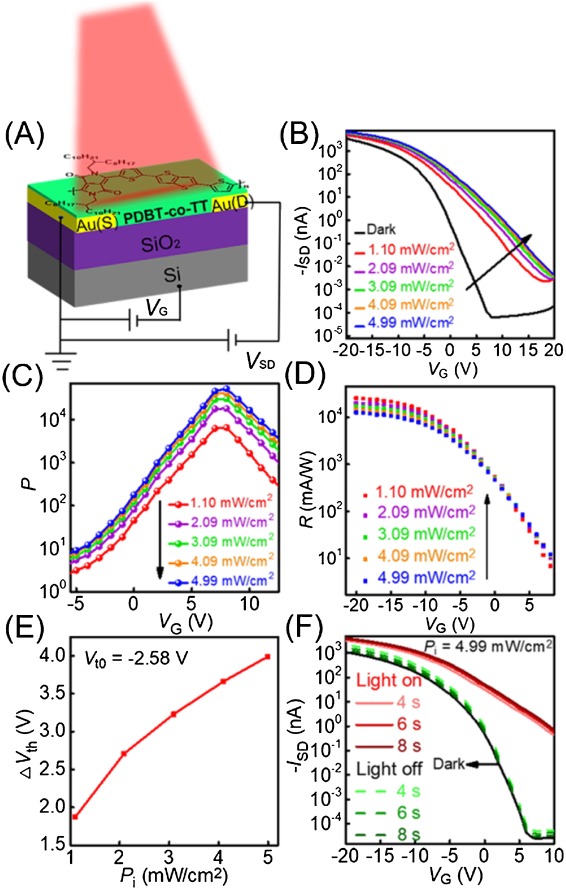
PDBT-co-TT-based OFETs were exposed to illumination to study their photo responsive properties (Fig. 2A). The UV–vis absorption spectrum of PDBT-co-TT thin film has a broad and high absorption over the wavelength range of 600–1000 nm, with the maximum absorption peak at around 825 nm (Fig. S2 in Supporting information). The optical bandgap of PDBT-co-TT is 1.23 eV [23, 24]. These features indicate that the polymer can be used as photoelectric active material, and light in this wavelength range has no destructive effect on biomolecules adsorbed on the polymer surface. Fig. 2B shows the transfer characteristic of the device, both under darkness and 808 nm near-infrared (NIR) light irradiation of various intensities (1.10, 2.09, 3.09, 4.09 and 4.99 mW/cm2), where the magnitude of ISD dramatically increased with the intensity of the NIR light (black arrow) at a fixed source-drain voltage (VSD) of ‒20 V on account of the photogenerated carriers in the channel. To evaluate the performance of the optical response [25], two important parameters, photosensitivity (P) and photo (R), are given by the following equations (Eqs. 2 and 3):

|
(2) |

|
(3) |

|
Download:
|
| Fig. 2. (A) Schematic of a BGBC OFET device based on PDBT-co-TT with illumination from above. (B) Transfer curves of the device with different intensities of near-infrared irradiation (λ = 808 nm) at VSD = ‒20 V. Plots of photosensitivity P (C) and photoresponsivity R (D) as functions of VG. (E) The change of threshold voltage ΔVth under different intensities of light sources. (F) Transfer curves measured 4, 6 and 8 s after light on and 4, 6 and 8 s after light off. | |
where Il and Idark are channel current under irradiation and darkness, respectively; Pi represents the power of the incident light per unit area and S is the effectively irradiated device area. The P and R obtained at different VG (from 20 V to ‒20 V) with different light powers are shown (Fig. 2C and D). The highest P was 5.26 × 10⁴ at 4.99 mW/cm2 in the off-state of VG = 7 V, and the highest R was 22.3 A/W at 1.10 mW/cm2, both of which are in agreement with previous report [26]. The change in the threshold voltage of OFETs as a function of different NIR light intensities is shown in Fig. 2E. Vth has an obvious shift from ‒2.58 V (Vt0) under dark condition to 3.99 V under irradiation, which may be attributed to the transport of photogenerated holes gathered near the drain electrode and photogenerated electrons captured near the source electrode, resulting in positive shift of Vth [27]. For the light irradiation durations of 4, 6 and 8 s, ISD remained primarily unchanged (4.99 mW/cm2), indicating that the light response time of the device is within this extent (Fig. 2F). In order to further confirm the specific value of the response speed, the time response profiles of the OFET device [26, 28] using a modulated NIR light source (808 nm, 4.99 mW/cm2) at a light on/off cycle of 20 s (Fig. S3 in Supporting information). The response speed was determined as 5.9 s, which corresponded to the presented conclusion in Fig. 2F. For the convenience of timing, the light irradiation time (defined as tr) was uniformly selected as 6 s in the following experimental operation. Moreover, for the durations of 4, 6 and 8 s after the light was turned off, the transfer curve basically coincided with that under darkness, which indicated that most of the excitons decayed back to the ground gate, and the fall time of the device is within this period. This clearly demonstrated that the change in ISD resulted from the generation and disappearance of NIR illumination, not due to noise interference.
Sun et al. confirmed that AFP antibodies can be adsorbed on the surface of PDBT-co-TT thin film by means of atomic force microscopy, X-ray photoelectron spectroscopy (XPS) and confocal laser scanning microscopy [29]. Fig. 3A shows the structure of AFP antibody-immobilized OFET that served as the basis of the AFP biosensor. All operations were performed on this device. To evaluate the stability of the antibody-immobilized device, the measurement of ISD-t curve was supplemented with the VSD of ‒20 V and the VG of 7 V. As presented in Fig. 3B, the device operated for up to 1000 s in air did not show obvious attenuation, exhibiting a quite stable behavior. It was worth mentioning that the device acted as a biosensor for the detection of AFP antigens was quick- determination and the analysis time was within 3 min. Through the Fig. 3B, there was a slight variation in the ISD-t curve, which was sufficient for the analysis time. In our study, light was an important factor in signal enlargement. The UV–vis spectrum and photosynthesis of AFP antibodies before and after immobilization were measured (Figs. 3C and D) as AFP antibodies are large proteins that may hinder light. We observed that the absorption was significantly weakened and at the voltage of 7 V the magnitude of P decreased from 104 to 102. These results provided sufficient evidence that the factor affecting the enhancement of sensing signal still existed; the existence of antibodies reduced the intensity of the incident light on the polymer and then the performance of photo response was decreased but was not completely abolished.

|
Download:
|
| Fig. 3. (A) Schematic of OFET after immobilization by AFP antibodies. (B) The source-drain current as a function of time measured for the antibody-immobilized device exposed to air for 1000 s. (C) UV–vis absorption spectra determined from PDBT-co-TT thin film and the thin film physically adsorbed by antibodies. (D) Photosensitivity P of bare OFET and AFP antibody-immobilized OFET (Pi = 4.99 mW/cm2). | |
When antigens (Table S1 in Supporting information) reacted with antibodies on the device, antigen-antibody complexes were formed (Fig. 4A). In evaluating the performance of a biosensor, selectivity is a very important parameter. In our paper, the probe molecules that can be used for specific recognition are immobilized on the surface of the OFET device, so the biosensor can only recognize the corresponding target molecules and detect selectively. Herein, in line with optimal screening conditions (VG = 7 V, tr = 6 s, Pi = 4.99 mW/cm2), the ISD-t curves of 1 μg/mL AFP antigens (target molecules), a negative control of 1 μg/mL human serum albumin (HSA) and a pure phosphate buffer solution (1 × PBS), which were used to react with the AFP antibodies (probe molecules) were measured for 25 s under darkness and NIR illumination (Fig. S4A, S4B in Supporting information). The responsivities (ΔI/I) are 4.22, 1.32, 0.74 under darkness (black) and 1500, 245, 153 under NIR illumination (red) (Fig. 4B). The control experiments suggest that our biosensors based on OFETs have the good selectivity regardless of dark and light environments. More notably, the sensing signal was sharply enlarged under lighting (over 102-fold) and the highest responsivity was up to 103 in comparison to darkness in Fig. 4B. This may be because the polymer PDBT-co-TT, as the photoelectric active material, absorbs photons and produces photogenerated carriers. Under these circumstances, a certain number of holes participating in the conduction channel are increased, leading to a significant amplification of ISD and the observed increase of responsivity.

|
Download:
|
| Fig. 4. (A) Schematic of OFET after reaction with AFP antigens. (B) The sensing signal (responsivity) after exposure to 1 × PBS, 1 μg/mL HSA and 1 μg/mL AFP under dark (black) and light (red) conditions. Standard deviation is represented by Error bars (n = 3). (C) Sensing signal (responsivity) after exposure to 150 pg/mL AFP and 1 × PBS under dark (white) and light (blue) conditions. | |
It is known that the cut-off value for the detection of AFP in liver cancer is 10 ng/mL. Herein, we selected an extremely low concentration of AFP antigens (150 pg/mL) and 1 × PBS (blank) to measure the response value under light and dark conditions, respectively. Under light irradiation, the responsivity of 150 pg/mL AFP antigens (i.e., 521) was much greater than three times the amount of blank control (i.e., 153), while in the dark, the response value of 150 pg/mL AFP antigens (i.e., 2.11) was less than three times that of blank control (i.e., 0.74) (Fig. 4C). Therefore, we conclude that the sensitivity of the OFET biosensor in the detection of disease markers has been greatly improved by introducing the photoelectric active material.
In conclusion, we confirmed that the OFET based on the p-type polymer PDBT-co-TT which is used as a semiconductor layer, exhibited stable device performance throughout the optimization process. In addition, the polymer PDBT-co-TT is a photoelectric active material with good responsivity to light. After light exposure, the OFET biosensor can qualitatively detect the liver cancer marker, AFP. Moreover, the output signal can be amplified by two orders of magnitude compared to that in darkness, which also indicates the high responsivity of AFP detection. The limiting concentration of 150 pg/mL AFP antigens was not detected in the dark, while it was successfully detected under light, suggesting that the sensitivity could be greatly improved. In future, the sensitivity is expected to be further improved by replacing different photoelectric active materials, and this class of novel biosensors can be developed as a potential platform for the diagnosis of various diseases.
Declaration of competing interestThe authors report no declarations of interest.
AcknowledgmentsThis project was financially supported by the Ministry of Science and Technology of China (Nos. 2015CB856502, 2016YFB0401100 and 2017YFA0204503), National Natural Science Foundation of China (Nos. 21705116, 51733004, 91433115, 51633006, 51703160, 21661132006, 21473222 and 51902131).
Appendix A. Supplementary dataSupplementary material related to this article can be found, in the online version, at doi:https://doi.org/10.1016/j.cclet.2021.04.005.
| [1] |
S.S. Li, C.W. Lin, K.C. Wei, et al., Sci. Rep. 6 (2016) 25155. DOI:10.1038/srep25155 |
| [2] |
A. Sankiewicz, L. Romanowicz, M. Pyc, A. Hermanowicz, E. Gorodkiewicz, J. Pharm. Biomed. Anal. 150 (2018) 1-8. DOI:10.1016/j.jpba.2017.11.070 |
| [3] |
Y. Ye, H. Guo, X. Sun, Biosens. Bioelectron. 126 (2019) 389-404. DOI:10.3390/plants8100389 |
| [4] |
S. Bidmanova, M. Kotlanova, T. Rataj, et al., Biosens. Bioelectron. 84 (2016) 97-105. DOI:10.1016/j.bios.2015.12.010 |
| [5] |
Y. Zang, D. Huang, C. Di, D. Zhu, Adv. Mater. 28 (2016) 4549-4555. DOI:10.1002/adma.201505034 |
| [6] |
C. Zhang, P. Chen, W. Hu, Small 12 (2016) 1252-1294. DOI:10.1002/smll.201502546 |
| [7] |
X. Ren, F. Yang, X. Gao, et al., Adv. Energy Mater. 8 (2018) 1801003. DOI:10.1002/aenm.201801003 |
| [8] |
H. Li, W. Shi, J. Song, et al., Chem. Rev. 119 (2019) 3-35. DOI:10.1021/acs.chemrev.8b00016 |
| [9] |
K. Zhou, K. Dai, C. Liu, C. Shen, SmartMat 1 (2020) e1010. |
| [10] |
X. Wu, S. Mao, J. Chen, J. Huang, Adv. Mater. 30 (2018) 1705642. DOI:10.1002/adma.201705642 |
| [11] |
H. Chen, S. Dong, M. Bai, et al., Adv. Mater. 27 (2015) 2113-2120. DOI:10.1002/adma.201405378 |
| [12] |
T. Minamiki, Y. Sasaki, S. Tokito, T. Minami, Chemistry Open 6 (2017) 472-475. DOI:10.1002/open.201700070 |
| [13] |
M.L. Hammock, O. Knopfmacher, B.D. Naab, J.B.H. Tok, Z. Bao, ACS Nano 7 (2013) 3970-3980. DOI:10.1021/nn305903q |
| [14] |
X. Huang, D. Ji, H. Fuchs, W. Hu, T. Li, ChemPhotoChem 3 (2019) 1-31. DOI:10.1155/2019/6248725 |
| [15] |
X. Wang, F. Zhao, Z. Xue, et al., Adv. Electron. Mater. 5 (2019) 1900174. DOI:10.1002/aelm.201900174 |
| [16] |
P. Gu, M. Hu, S. Ding, et al., Chin. Chem. Lett. 29 (2018) 1675-1680. DOI:10.1016/j.cclet.2018.03.034 |
| [17] |
S.H. Peng, T.W. Huang, G. Gollavelli, C.S. Hsu, J. Mater. Chem. C 5 (2017) 5193-5198. DOI:10.1039/C7TC00966F |
| [18] |
L. Zhang, S. Wan, Y. Jiang, et al., J. Am. Chem. Soc. 139 (2017) 2532-2540. DOI:10.1021/jacs.6b10646 |
| [19] |
A. Mohammadinejad, R.K. Oskuee, R. Eivazzadeh-Keihan, et al., TrAC Trends Anal. Chem. 130 (2020) 115961. DOI:10.1016/j.trac.2020.115961 |
| [20] |
H. Shen, C.A. Di, D. Zhu, Sci. China Chem. 60 (2017) 437-449. DOI:10.1007/s11426-016-9014-9 |
| [21] |
S.H. Yu, H.G. Girma, K.M. Sim, et al., Nanoscale 11 (2019) 17709-17717. DOI:10.1039/c9nr06096k |
| [22] |
J. Lee, A.R. Han, J. Kim, et al., J. Am. Chem. Soc. 134 (2012) 20713-20721. DOI:10.1021/ja308927g |
| [23] |
Y. Li, S.P. Singh, P. Sonar, Adv. Mater. 22 (2010) 4862-4866. DOI:10.1002/adma.201002313 |
| [24] |
J. Li, Y. Zhao, H.S. Tan, et al., Sci. Rep. 2 (2012) 754-763. DOI:10.1038/srep00754 |
| [25] |
Y. Yao, Y. Chen, H. Wang, P. Samorì, SmartMat 1 (2020) e1009. |
| [26] |
Y. Lei, N. Li, W.K.E. Chan, B.S. Ong, F. Zhu, Org. Electron. 48 (2017) 12-18. DOI:10.1016/j.orgel.2017.05.029 |
| [27] |
W. Huang, B. Yang, J. Sun, et al., Org. Electron. 15 (2014) 1050-1055. DOI:10.1016/j.orgel.2014.02.020 |
| [28] |
J. Song, P. Lin, Y.F. Ruan, et al., Adv. Healthcare Mater. 7 (2018) 1800536. DOI:10.1002/adhm.201800536 |
| [29] |
C. Sun, Y. Wang, M. Sun, et al., Biosens. Bioelectron. 164 (2020) 112251. DOI:10.1016/j.bios.2020.112251 |