 2021, Vol. 32


b School of Environmental and Chemical Engineering, Foshan University, Foshan 528000, China
Photoelectrochemical (PEC) water splitting at the interface between semiconductor and electrolyte interfaces has been considered as a promising strategy for providing electrical energy or clean fuels [1-4]. A Photoelectrochemical cell (PECs) is always composed of a semiconductor photoanode and a platinum cathode. Under illumination, photogenerated electrons transfer to the cathode for hydrogen evolution or CO2 reduction, while photogenerated holes migrate to the interface of the photoanode [5]. Currently, TiO2 has been widely studied as a photocatalyst due to its low cost, environmental-friendliness, corrosion resistance in electrolyte [6-8].
The challenges to increase the performance of the PECs mainly depends on the separation efficiency of photogenerated electron/hole pairs and their transport to the interface [9-11]. Generally, the charge transfer at the interface between the electrode and the electrode is a crucial step. In this regard, the interface between electrode and electrlyte should play a vital role on the PEC reactions. From our viewpoint, for the PEC water oxidation, the photoexcited carriers (mainly holes for photoanode) need to transport to the interface and the solution ions (like water or OH−) have to be adsorbed on the interface [12]. The efficiency of this two processes determines the efficiency of PECs.
Supercapacitor has attracted great attention due to its storage of energy by accumulating charge at the interface between electrode and electrolyte [13]. It is constructed by two layers of opposite charge at the interface. Specifically, in PECs, with an anodic bias applied on the photoanode, a supercapacitor is formed by the positive charges and a layer of adsorbed anions. Under illumination, the supercapacitor could be charged when some holes are accumulated on the surface of the photoanode. From this viewpoint, the supercapacitor serves as an accepting unit of holes in the PECs. Thereby, the supercapacitor is a very important factor to be considered, especially about the interaction between charge carrier (electron/hole) and the adsorbed ions. The relationship between the supercapacitance and the photoelectrochemical performance has not been fully studied, and there are very few studies about this investigation.
Herein, we systematically study the relationship between the supercapacitance and the performance of a photoanode. We report on a new strategy for the enhanced transport of photogenerated carrier and enhanced adsorbed solution ions by increasing the suparcapacance of TiO2 photoanodes. A porous carbon layer with high supercapacitance is coated on the TiO2 NWs. Mechanism for the transportation of hole and electron is also investigated. The TiO2 NWs with enhanced supercapacitance increase the transport of photoexcited holes and the adsorption of ions to the interface, thereby promoting the PEC reactions. By adjusting the thinkness of the carbon layer, the supercapacitance can be controlled. The relationship between supercapacitance of the photoanode and the photocurrent density follows an exponent relationship. In the beginning, the photocurrent density only slightly increases when the supercapacitance rises. Then, the increase becomes faster and faster and following an exponent increase. The relationship can be simulated as (Eq. 1):
|
(1) |
where Jp is the photocurrent density and C is the supercapacitance.
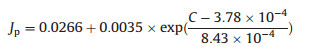
In this study, the supercapacitance is controlled by coating a carby layer on TiO 2. Carbon coated titanium dioxide (C-TiO2) has been used in the field of Li-ion battery [14, 15]. water splitting [16]. In our study, a very thin carbon layer is coated on the TiO2 NWs to enhance its supercaitance. Carbonaceous materials can be formed via the cross-linking and intermolecular dehydration of glucose molecules under hydrothermal condition [17-21]. In the presence of metals or metal oxides, the carbonaceous material tends to cover on their surfaces [18, 19]. In our experiments, a carbonaceous polymer layer was coated on TiO2 nanowire array in glucose solution, and it was converted into pure carbon layer via calcination. The process is shown in Scheme 1.

|
Download:
|
| Scheme 1. Schematic diagram for the preparation of C-TiO2. | |
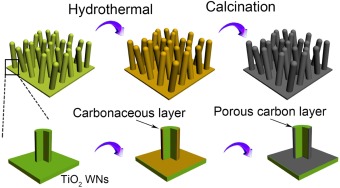
As shown in Fig. 1a, the TiO2 NWs has a clean surface. After the hydrothermal reaction, a layer of carbonaceous polymer material covers uniformly on the surface of TiO2 NWs (Fig. 1b). The carbonaceous polymer layer is amorphous with a thickness of about 3−5 nm. After calcination, the thickness does not change apparently (Fig. 1c).

|
Download:
|
| Fig. 1. Schematic diagram showing the synthesis of C-TiO2 NWs. Transmission electron microscopic (TEM) images of (a) TiO2 NWs, C-TiO2 NWs (b) before and (c) after heated. High resolution transmission electron microscopic (HRTEM) of C-TiO2 NWs (d) before and (e, f) after heated. Picture of (g) TiO2 NWs, C-TiO2 NWs (h) before and (i) after heated support on a Ti substrate. | |
There is no apparent pore structure in the carbonaceous layer before calcination (Fig. 1d). After calcinations, those peaks disappear in the FTIR spectra, and the layer becomes much rougher (Figs. 1e and f). The pores should be formed during the following calcination step. As shown in Fig. S1 (Supporting information), some carbon, oxygen and hydrogen will be released from the carbonaceous polymer layer in the form of H2O, CO and CO2. This will cause the formation of pores. Then plenty of micropores are formed resulting from the removal of H and O [22]. This process is schematically shown in Fig. S1. Scanning electron microscopic (SEM) images (Fig. S2 in Supporting information) show that the nanowire structure remains after the heated treatment. X-Ray diffraction (XRD) (Fig. S3 in Supporting information) pattern shows that the TiO2 is a mixture of anatase (PDF card No. 21-1272) and rutile (PDF card No. 65-0190). The picture of TiO2, C-TiO2 before and after heated are shown in Fig. 1g, e, and f, respectively.
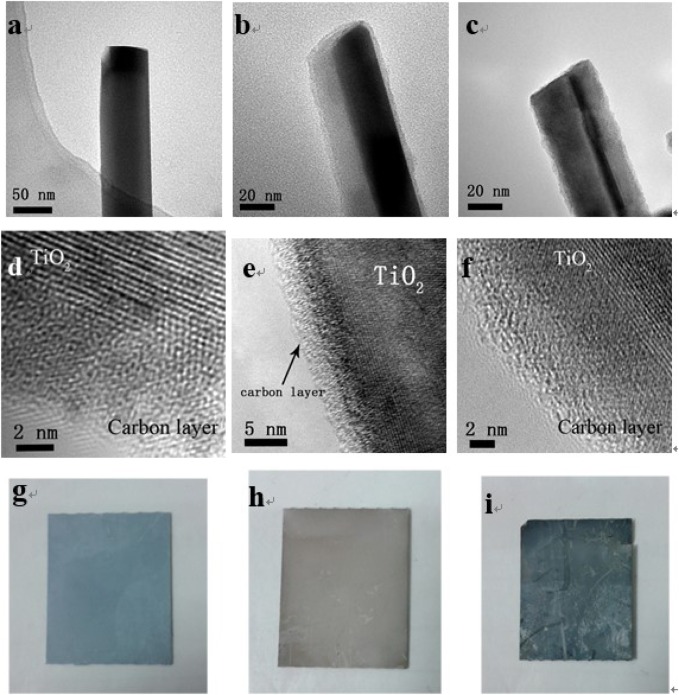
Energy dispersive spectrometer (EDS) also exhibits the element of C, O and Ti (Fig. 2a). Besides, the peaks of carbonyl group (1680 cm−1) and hydroxyl group (3430 cm−1) are found in the FTIR spectra (Fig. 2b) [19]. This suggests that the layer contains C, H and O elements.

|
Download:
|
| Fig. 2. (a) EDS of C-TiO2 NWs and (b) FTIR spectra of C-TiO2 NWs before and after calcination. (c) Linear sweeps voltammogram collected from TiO2 NWs in the dark (black), under illumination (blue), and C-TiO2 NWs in the dark (green) and under illumination (orange). (d) Transient photocurrent density measurements and (e) applied bias photon-to-current efficiency (APEC) of TiO2 NWs (blue) and C-TiO2 NWs (orange) at 0.1 V vs. Ag/AgCl in 0.1 mol/L NaOH solution. (f) Mott-Schottky plots of TiO2 NWs and C-TiO2 NWs at a frequency of 1000 Hz in 0.1 mol/L NaOH solution. | |
All the PEC measurements were conducted in a three-electrode electrochemical cell in 0.1 mol/L NaOH electrolyte. The linear sweeps voltammograms (LSV) were collected in a potential range of 0.2–1.4 V vs. RHE, as shown in Fig. 2c.
At a small bias, the photocurrent density of TiO2 NWs and C-TiO2 NWs increases slowly due to limited separation of the photogenerated electron-hole pairs in weak electric field. When the bias reaches 0.6 V vs. RHE, the photocurrent density increases much faster, suggesting higher separation efficiency of the photogenerated electron/hole pairs. In such a potential region (0.4 to 0.9 V vs. RHE), the raise of photocurrent density of C-TiO2 NWs is much more apparent than that of TiO2 NWs. Since charge transport in the photoanode is considered as the rate-limiting step, this suggests that the carbon layer promotes the charge transport in the photoanode. This C-TiO2 NWs also compares favorably with the state-of-the-art TiO2 based photoanode (Table S1 in Supporting information).
At higher bias, their photocurrent density saturates due to insufficient supply of photogenerated carriers [23]. Under such circumstance, the photocurrent density of C-TiO2 NWs is about 8 times higher than that of bare TiO2 NWs. This can also be seen in the transient photocurrent densities measurements in Fig. 2d.
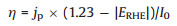
Usually, an external bias is needed to activate and promote a PEC because PEC is driven by both external bias and light. It is very necessary to evaluate the contribution of solar energy without considering that of the external bias. The applied bias photon-to-current efficiency (ABPE) can be used to calculated on the base of the equation bellows (Eq. 2):
|
(2) |
where η is the efficiency of PEC water splitting, jp is the photocurrent density at the measured potential, I0 is the power density of incident light (100 mW/cm2), and ERHE is the bias potential vs. RHE.
As shown in Fig. 2e, it is clear that the applied bias photon-to-current efficiency (ABPE) of C-TiO2 is much higher than that of TiO2 in almost all the potential window.
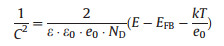
Mott-Schottky plots of TiO2 NWs and C-TiO2 NWs are compared in Fig. 2f. The zoom-in view of the frame in Fig. 2f showing the detail of C-TiO2 NWs is shown in Fig. S4 (Supporting information). Flatband potentials and carrier density of TiO2 NWs and C-TiO2 NWs are calculated from their Mott-Schottyk plots by the following equation (Eq. 3) [24-26]:
|
(3) |
where C is the space charge capacitance, ε and ε0 are the permittivity of the electrode and free space. e0 the elementary charge, E is the applied potential, EFB is the flatband potential, k is the Boltzmann's constant, and T is the temperature. Then, EFB can be determined from the extrapolation of X intercept in the plot. According to Fig. 2f, EFB values of TiO2 NWs and C-TiO2 NWs are calculated to be about ‒0.90 V and ‒0.87 V, respectively. It suggests that flatband potential of the photoanode would not be greatly influenced by the carbon layer.
In addition, according to Eq. 3, slope of the Mott-Schottky plot is expressed as 1/(εε0e0ND). Therefore, the carrier density (ND) can be estimated by the slope according to the following equation (Eq. 4):

|
(4) |
Since 1/(εε0e0) can be considered as a constant, ND is found to be inversely related to the slope of the Mott-Schottky plots. Fig. 2f shows that the slope of C-TiO2 NWs is much smaller than that of TiO2 NWs, indicating that the carrier density of C-TiO2 NWs is much higher than that of bare TiO2 NWs. Meanwhile, by using the value of ε = 30 F/m, ε0 = 8.85 × 10¹⁸ F/m, e0 = 1.6 × 10¹⁸ C, ND of TiO2 NWs and C-TiO2 NWs can be calculated to be 1.6 × 1018 cm−3 and 3.3 × 1024 cm−3. The carrier density increases greatly after the coating of carbon layer.
Cyclic voltammetry (CV) curves of C-TiO2 NWs and TiO2 NWs at a scan rate of 20 mV/s are shown in Figs. 3a and b. Their quasi-rectangular shape is characteristic of ideal double layer capacitance mechanism for storage of energy [27, 28].

|
Download:
|
| Fig. 3. CV curves of (a) C-TiO2 NWs and (b) TiO2 NWs at a scan rate of 20 mV/s. Galvanostatic charge/discharge curves of (c) C-TiO2 NWs and (d) TiO2 NWs at a current density of 0.0125 mA/cm2. (e) Transient photocurrent densities measurements of TiO2 NWs (blue), C(0.1)-TiO2 NWs, C(0.5)-TiO2 NWs, C(1.0)-TiO2 NWs and C(2.0)-TiO2 NWs (magenta) at 1.0 V vs. RHE in 0.1 mol/L NaOH solution. (f) Relationship between the current density and initial added glucose. | |
Furthermore, a galvanostatic charge/discharge measurement is conducted to study the supercapacitance [29]. This is carried out by applying a constant current density of 0.0125 and −0.0125 mA/cm2 intermittently at the photoanodes in the potential windows of ‒0.2~0.2 V. As shown in Figs. 3c and d, the curve is linear and symmetrical during both the charging and discharging processes. This suggests that the electrode has an ideal characteristic of capacitor and excellent electrochemical reversibility.
The specific capacitance C can be estimated from the charge/discharge curves according to the following equation (Eq. (5)) [30, 31],

|
(5) |
where I is the current density during charge/discharge processes, t is the charge/discharge duration in each segment, ΔV is the potential difference.
In our experiments, since I, and ΔV are constants, the specific capacitance is proportional to Δt. Apparently, Δt of C-TiO2 NWs is much larger than that of TiO2 NWs, suggesting that the capacitance of C-TiO2 NWs is much higher than that of TiO2 NWs. According to Eq. 4, the C of TiO2 NWs and C-TiO2 NWs is calculated to be 3.75 × 10⁻⁵ F and 5.75 × 10⁻³ F, respectively.
Obviously, the capacitance of C-TiO2 NWs is larger. Possibly, the majority of the capacitance lies in the carbon layer. For ideal supercapacitor, its surepcapacitance can also be expressed as equation below (Eq. 6) [32]:

|
(6) |
where ε and ε0 are the permittivity of the semiconductor electrode and free space, A is the specific surface area of the electrode accessible to the electrolyte ions, and d is the eff; ective thickness. Since εε0/d is a constant, the larger capacitance of C-TiO2 NWs is mainly due to larger specific surface area of the carbon layer. As is discussed before, plenty of micropores in the carbon layer are formed. Those pores structure greatly increase the specific surface area and capacitance of the photoanode.
Furthermore, the capacitance can be controlled by the thickness of the carbon layer. Thicker carbon layer can be formed with higher glucose concentration. As shown in Fig. S5 (Supporting information), the capacitance of C-TiO2 NWs exhibits a linear dependence (R2 = 0.977) on the glucose concentration. As the amount of glucose increase from 0.1 g to 1.0 g, the capacitance of C-TiO2 NWs raise from 3.25 × 10⁻³ to 5.75 × 10⁻³F, and the photocurrent density increases from 0.17 mA/cm2 to 0.90 mA/cm2 at the same time (Fig. 3e, Fig. S6 in Supporting information). This suggests that larger capacitance is more beneficial to the photoactivity of C-TiO2 NWs. However, due to light-blocking effect caused by excess carbon, the photocurrent diminishes rapidly despite larger capacitance (Fig. 3f).
To study the relationship between the supercapacitance and the photoelectrochemical activity, we have controlled the supercapacitance of the photoanode by adjusting the thickness of the carbon layer and measure their photocurrent. Then, we can obtain the relationship between the supercapacitance and the photocurrent. The result is shown in Fig. 4a. It is clear that the relationship between supercapacitance of the photoanode and the photocurrent density follows an exponential relationship. In the beginning, the photocurrent density only slightly increases when the supercapacitance rises. Then, the increase becomes faster and faster and following an exponential increase. The relationship can be simulated by Eq. 1.

|
Download:
|
| Fig. 4. (a) Relationship between supercapacitance of the photoanode and the photocurrent density. (b) Fluorescence spectra of the electrolyte containing 0.1 mol/L NaOH and 4 × 10⁻³ mol/L terephthalic acid where the TiO2 NWs and C-TiO2 NWs are illuminated for 60 min at 1.03 V vs. RHE. The insert is the fluorescence intensity of the emission peak at 420 nm as a function of experimental time. Schematic diagram comparing the photoelectrochemical water splitting on the photoanode of (c) TiO2 NWs and (d) C-TiO2 NWs. | |
Supercapacitor is often considered as an energy storage unit. Specfically for a photoanode, a supercapacitor is form bewteen the photoexcited hole arriving at the electrode/electrolyte interface and the adsorbed solution ions (mainly OH− in alkaline solution). With regrading to the side of supercapacitor on the side of electrode, it is the photoexcited holes that charge the supercapacitor. With higher supercapacitance, more holes can be storaged at the supercapacitor. This will be greatly beneficial to the separation of electron and hole insider the electrode, enabling more holes to the surface for water oxidation and more electrons to the external circuit for photocurrent generation (Fig. S7 in Supporting information).
With regarding to the side of supercapacitor on the side of electrolyte, the photoelectrochemical mechanism is investigated by applying a bias on the illuminated photoanodes in a mixture electrolyte of 0.1 mol/L NaOH and 4 × 10⁻³ mol/L terephthalic acid. The OH− anions is oxidated to OH radical by the photogenerated holes [33], and in the presence of terephthalic acid, the OH radicals will convert the non-fluorescent terephthalic acid into highly fluorescent 2-hydroxyterephthalic acid (Fig. S8 in Supporting information) [33, 34]. Consequently, the amount of formed OH radicals and photogenerated holes is evaluated by terephthalic acid as a fluorescent probe (Eqs. 7 and 8).

|
(7) |

|
(8) |
For TiO2 NWs, a clear fluorescent peak of 2-hydroxyterephthalic acid at 420 nm can be seen, and it increases with illumination time (Fig. 4b). This confirms the formation of OH radical (·OH) on the illuminated TiO2 NWs.
The fluorescent peak can also be observed in case of C-TiO2 NWs, suggesting ·OH are formed despite a layer of carbon. Since the carbon layer cannot produce any photogenerated holes, the holes migrate from the TiO2 NWs to the electrolyte through the carbon layer. Moreover, as exhibited in Fig. 4b, the intensity of the peak is much higher than that of TiO2 NWs, suggesting more ·OH is formed.
Likely, the carbon layer with large specific surface area adsorbs more OH– on its surface. Hence, higher density of OH– may result in faster water oxidation rate, and more ·OH.
Based on the results above, a tentative mechanism for the photoelectrochemical water splitting on the C- TiO2 NWs is proposed: As mentioned above, at the interface between photoanode and electrode, a supercapacitor forms with holes and OH– anions on each side. Under illumination, some holes are accumulated by the supercapacitor. Then, the potential increases and the adsorbed OH– will be oxidized to ·OH and further to oxygen (depending of the potential) [35]. However, not all the holes can reach the interface because of the recombination of electron/hole pairs. The ratio of holes arriving at the interface to those recombined with photoenerated electrons determines the photoelectrochemical activity.
For bare TiO2 NWs, only a small amount of holes are accepted by its supercapacitor and most of them recombine with photogenerated electrons. This is shown in Fig. 4c Accordingly, a few electrons are extracted to the cathode, as represented by the small photocurrent density. On the country, the carbon layer with larger supercapacitance promotes the separation of electron/hole pairs more efficiently by collecting more holes. Therefore, the photocurrent density is higher. Meanwhile, the carbon layer with large specific surface area facilitates the rate of water oxidation by adsorbing more OH–, as can be confirmed by the higher intensity of fluorescent peaks in Fig. 4b. Consequently, the C-TiO2 NWs exhibits higher photoelectrochemical activity. The comparison between TiO2 NWs and C-TiO2 NWs is schematically shown in Fig. 4d.
In summary, the supercapacitance of TiO2 NWs has been greatly increased by coated a porous carbon layer on its surface. The photocurrent density C-TiO2 NWs is higher than that of TiO2 NWs. A mechamism for the photoelectrochemical water splitting on C-TiO2 NWs is proposed: On one hand, the carbon layer with high supercapacitance favors the separation rate of electron-hole pairs in the TiO2 NW photoanode. Meanwhile, it promotes the water oxidation rate by adsorbing more OH– on its surface. This study will broaden our understanding of the supercapacitor at the interface and demonstrate an effective method to enhance the performance of PECs, which should also applicable to other photoanodes.
Declaration of competing interestThe authors declare that they have no known competing financial interests or personal relationships that could have appeared to influence the work reported in this paper.
AcknowledgmentsThis work was supported by the National Natural Science Foundation of China (No. 51902357), the Natural Science Foundation of Guangdong Province, China (No. 2019A1515012143), the Start-up Funds for High-Level Talents of Sun Yat-Sen University (No. 38000-18841209) and the Fundamental Research Funds for the Central Universities (No. 19lgpy153).
Appendix A. Supplementary dataSupplementary material related to this article can be found, in the online version, at doi:https://doi.org/10.1016/j.cclet.2021.04.004.
| [1] |
Z.S. Li, W.J. Luo, M.L. Zhang, J.Y. Feng, Z.G. Zou, Energy Environ. Sci. 6 (2013) 347-370. DOI:10.1039/C2EE22618A |
| [2] |
S.R. Pendlebury, M. Barroso, A.J. Cowan, K. Sivula, J.W. Tang, et al., Chem. Commun. 47 (2011) 716-718. DOI:10.1039/C0CC03627G |
| [3] |
Y.X. Fang, I.S. Merenkov, X.C. Li, J.K. Xu, S. Lin, et al., J. Mater. Chem. A 8 (2020) 13059-13064. DOI:10.1039/d0ta04593d |
| [4] |
X.C. Li, Z. Cheng, Y.X. Fang, X.Z. Fu, X.C. Wang, Solar RRL 4 (2020) 1900567. DOI:10.1002/solr.201900567 |
| [5] |
Y. Lan, G. Niu, F. Wang, D. Cui, Z. Hu, ACS Appl. Mater. Interfaces 12 (2020) 36128-36136. DOI:10.1021/acsami.0c09240 |
| [6] |
M. Xu, P.M. Da, H.Y. Wu, D.Y. Zhao, G.F. Zheng, Nano Lett. 12 (2012) 1503-1508. DOI:10.1021/nl2042968 |
| [7] |
Y.C. Lan, Y.Z. Xie, J.X. Chen, Z.F. Hu, D.H. Cui, Chem. Commun. 55 (2019) 8068-8071. DOI:10.1039/c9cc02891a |
| [8] |
Z.F. Hu, J.C. Yu, T. Ming, J.F. Wang, Appl. Catal. B: Environ. 168 (2015) 483-489. |
| [9] |
H. Dotan, K. Sivula, M. Gratzel, A. Rothschild, S.C. Warren, Energy Environ. Sci. 4 (2011) 958-964. DOI:10.1039/C0EE00570C |
| [10] |
Z. Hu, J. Gong, Z. Ye, Y. Liu, X. Xiao, et al., J. Catal. 384 (2020) 88-95. DOI:10.1016/j.jcat.2020.02.015 |
| [11] |
R.Z. Chen, C. Zhen, Y.Q. Yang, X.D. Sun, J.T.S. Irvine, et al., Nano Energy 59 (2019) 683-688. DOI:10.1016/j.nanoen.2019.03.009 |
| [12] |
Z. Hu, Z. Shen, J.C. Yu, F. Cheng, Appl. Catal. B: Environ. 203 (2017) 829-838. DOI:10.1016/j.apcatb.2016.10.079 |
| [13] |
R.B. Ambade, S.B. Ambade, N.K. Shrestha, Y.C. Nah, S.H. Han, et al., Chem. Commun. 49 (2013) 2308-2310. DOI:10.1039/c3cc00065f |
| [14] |
L. Sun, J. Xie, L. Zhang, R. Jiang, J. Wu, et al., FlatChem 20 (2020) 100152. DOI:10.1016/j.flatc.2020.100152 |
| [15] |
G. Zhu, L. Ma, H. Lin, P. Zhao, L. Wang, et al., Nano Res. 12 (2019) 1713-1719. DOI:10.1007/s12274-019-2427-3 |
| [16] |
W. Zhang, Y. Hu, C. Yan, D. Hong, R. Chen, et al., Nanoscale 11 (2019) 9053-9060. DOI:10.1039/c9nr01732a |
| [17] |
M. Sevilla, A.B. Fuertes, Carbon 47 (2009) 2281-2289. DOI:10.1016/j.carbon.2009.04.026 |
| [18] |
X.M. Sun, Y.D. Li, Angew. Chem. Int. Ed. 43 (2004) 597-601. DOI:10.1002/anie.200352386 |
| [19] |
H.S. Qian, S.H. Yu, L.B. Luo, et al., Chem. Mat. 18 (2006) 2102-2108. DOI:10.1021/cm052848y |
| [20] |
X. He, N. Zheng, R. Hu, Z. Hu, J.C. Yu, Adv. Funct. Mater. 21 (2021) 2006505. DOI:10.1002/adfm.202006505 |
| [21] |
Z.F. Hu, Z.R. Shen, J.C. Yu, Environ. Sci. Technol. 51 (2017) 7076-7083. DOI:10.1021/acs.est.7b00118 |
| [22] |
Q. Wang, H. Li, L.Q. Chen, X.J. Huang, Carbon 39 (2001) 2211-2214. DOI:10.1016/S0008-6223(01)00040-9 |
| [23] |
G.M. Wang, Y.C. Ling, D.A. Wheeler, et al., Nano Lett. 11 (2011) 3503-3509. DOI:10.1021/nl202316j |
| [24] |
X.Y. Yang, A. Wolcott, G.M. Wang, et al., Nano Lett. 9 (2009) 2331-2336. DOI:10.1021/nl900772q |
| [25] |
C. Baumanis, D.W. Bahnemann, J. Phys. Chem. C 112 (2008) 19097-19101. DOI:10.1021/jp807655a |
| [26] |
T.V. Nguyen, O.B. Yang, Catal. Today 87 (2003) 69-75. DOI:10.1016/j.cattod.2003.10.014 |
| [27] |
A. Ramadoss, S.J. Kim, J. Alloys Compd. 561 (2013) 262-267. DOI:10.1016/j.jallcom.2013.02.015 |
| [28] |
P. Simon, Y. Gogotsi, Nat. Mater. 7 (2008) 845-854. DOI:10.1038/nmat2297 |
| [29] |
L. Li, Z. Hu, J.C. Yu, Angew. Chem. Int. Ed. 59 (2020) 20538-20544. DOI:10.1002/anie.202008031 |
| [30] |
F. Tao, Y.Z. Shen, Y.Y. Liang, H.L. Li, J. Solid State Electrochem. 11 (2007) 853-858. DOI:10.1007/s10008-006-0232-x |
| [31] |
Y. Yang, D. Kim, M. Yang, P. Schmuki, Chem. Commun. 47 (2011) 7746-7748. DOI:10.1039/c1cc11811k |
| [32] |
L.L. Zhang, X.S. Zhao, Chem. Soc. Rev. 38 (2009) 2520-2531. DOI:10.1039/b813846j |
| [33] |
S. Kohtani, K. Yoshida, T. Maekawa, et al., Phys. Chem. Chem. Phys. 10 (2008) 2986-2992. DOI:10.1039/b719913a |
| [34] |
C.H. Li, F. Wang, J.A. Zhu, J.C. Yu, Appl. Catal. B: Environ. 100 (2010) 433-439. DOI:10.1016/j.apcatb.2010.08.017 |
| [35] |
H. Jun, B. Im, J.Y. Kim, et al., Energy Environ. Sci. 5 (2012) 6375-6382. DOI:10.1039/C1EE02526K |