 2021, Vol. 32


Cremophor® EL (CrEL, BASF) is a nonionic solubilizer and emulsifier containing a complex mixture of polymeric materials. It is widely used in pharmaceutical formulations of poorly water-soluble drugs such as cyclosporine A, paclitaxel and cisplatin. Regrettably, CrEL has been found to cause hypersensitivity reactions [1, 2], abnormal lipoprotein patterns [3, 4], peripheral neuropathy [5, 6], hyperlipidaemia [7] and neurotoxicity [8, 9]. However, on the positive side, CrEL has been found to enhance the efficacy and bioavailability of co-administered P-glycoprotein (P-gp) substrates by blocking the P-gp efflux pump [10-15]. To understand these complex biological and pharmacological effects of CrEL, an analytical strategy capable of monitoring its various constituents and their metabolites is urgently required.
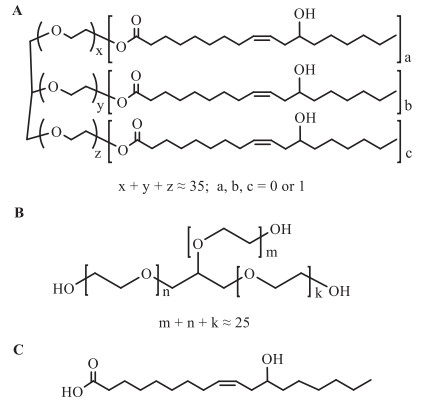
CrEL is prepared by reacting castor oil with about 35 equivalents of ethylene oxide. It contains approximately 83% polyoxyethylene glycerol fatty acid esters that made up of hydrophobic mono-, di- and tri-fatty acid esters of glycerol ethoxylate (GE). The fatty acids are derived from castor oil with the great majority being ricinoleic acid (RA) together with small amounts of oleic, linoleic, and several saturated fatty acids. CrEL also contains about 17% of hydrophilic components primarily made up of polyethylene glycols (PEGs) and GE [16]. The structures of PGR (the main constituent of CrEL) and GE are shown in Fig. 1. GE is the main metabolite of CrEL identified in rat plasma and is formed together with the major metabolite, RA, shown in Fig. 1C.

|
Download:
|
| Fig. 1. Chemical structures of (A) polyoxyethylene glycerol ricinoleate (the main constituent of CrEL), (B) glycerol ethoxylate and (C) ricinoleic acid. | |
Because CrEL contains multiple polymeric constituents with high structural diversity, its quantitative analysis poses a major challenge. Previous studies used indirect methods based on the UV-absorbance of dye-CrEL complexes [17, 18] or potentiometric titration [19]. One such indirect method was to hydrolyze CrEL completely to the corresponding fatty acids, which were then derivatized with 1-naphthylamine for the HPLC determination [20]. This complex sequence of degradation, extraction and derivatization steps does not lend itself to high throughput quantitative analysis of CrEL in biological samples.
Ghassempour et al. developed a pyrolysis-mass spectrometry method for the determination of CrEL in blood samples [21] with a limit of detection (LOD) of 1 ng/mL. The strategy involved selective monitoring of characterized glycerol- and PEG-specific fragments. The same PEG-specific product ion was previously selected for LC-MS/MS determination of CrEL by multiple reaction monitoring (MRM) [22]. Although suitable for the analysis of PEG block copolymers [23, 24] the method is limited in being unable to distinguish the essential components of CrEL from other hydrophilic PEG and GE components [16].
In the molecular characterization of castor oil ethoxylates (CASEOs, a similar non-ionic surfactant to CrEL), Nasioudis et al. combined reverse-phase liquid chromatography with LC-TOF MS and multistage mass spectrometry (MSn) to identify and determine its various components [25]. The study demonstrated that the polymerization of castor oil and ethylene oxide produces a structurally diverse mixture of fatty acid esters with MWs in the range 350–1800 Da and doubly charged distributions.
Recently, a hybrid Q-TOF MS technique utilizing product ion scan and TOF MS was successfully applied to the bioassay of polydisperse PEGs [26]. The combined acquisition of precursor ions in Q1, their entire fragmentation in Q2 and subsequent product ion scan by TOF MS is known as MSALL. Unlike selective fragmentation in multiple reaction monitoring (MRM), all precursor ions are fragmented in the MSALL mode regardless of their m/z values. Therefore, MSALL has the potential to overcome the aforementioned difficulties in the quantitation of CrEL.
In the study described here, MSALL and SWATH MS were used to determine CrEL and GE respectively in a biological matrix. SWATH MS is emerging as a technology that combines data independent acquisition (DIA) with high fragmentation efficiency and selectivity [27-30]. Taking advantage of the high disassociation efficiency of in-quadrupole CID and the high resolution of the TOF analyzer, problems of multicharged ions and matrix interference were greatly reduced allowing the hydrophilic and hydrophobic components of CrEL and their metabolites to be determined. In addition, a simple sample preparation procedure and normal-phase chromatography allowed a short analytical run-time with the potential for high throughput analysis.
The methods of the profile analysis of CrEL were carried out as shown in Tables S1 and S2 (Supporting information). The chromatographic conditions for quantitative analysis of the analytes are given in Table S4 (Supporting information). The quantitations of CrEL, GE and RA were carried out using MS ALL, SWATH MS and product ion modes respectively. The corresponding internal standards viz Phenformin, MP-AM and diclofenac were quantitated using TOF MS, SWATH MS and product ion modes respectively. Optimization of the source and compound MS parameters for the determination of CrEL, GE and RA are listed in Tables S5 and S6 (Supporting information) respectively. Detailed quantitative bioanalytical method for CrEL, GE and RA as well as the method in optimization and validation can be found in Supporting information.
In vitro CrEL metabolism in plasma was studied in 5 replicates of incubation mixtures (final volume 0.2 mL) containing 100 mmol/L PBS at pH 7.4, 1 mg/mL CrEL and 10 vol% fresh rat plasma. Control samples contained thermally inactivated rat plasma (5 replicates). Reactions were initiated by adding plasma and incubated at 37 ℃ for 5 min with shaking at 500 rpm (MicBio-Ⅱ Thermo Shaker, ABSON Science Equipment Co., Ltd.). Reactions were terminated by adding 2 volumes of ice-cold acetonitrile, mixed under vortex for 30 s and centrifuged at 16,000 g for 3 min (HERAEUS PICO17 centrifuge, Thermo Scientific). Finally, the supernatants were diluted 10-fold with 10 vol% acetonitrile-water and injected into the LC-Q-TOF MS system.
Animal welfare and experimental procedures were carried out in accordance with the guidance for the care and use of laboratory animals of the national research council of U. S. A. 1996 and related ethical regulations of Jilin University. A group of male Sprague-Dawley rats (n = 5, weight 200 ± 10 g) obtained from the Experimental Animal Centre of Jilin University were administered single intravenous 200 mg/kg doses of CrEL dissolved in normal saline at a concentration of 80 mg/mL. Blood samples (~ 200 μL) were collected from ophthalmic veins into heparinized tubes pretreated with esterase inhibitor (dichlorvos). Samples were collected before administration and at 0.017, 0.083, 0.25, 0.5, 1, 2, 4, 6, 8, 10, and 24 h after dosing. Plasma was separated by centrifugation at 16,000 g for 3 min and analyzed by LC-Q-TOF MS.
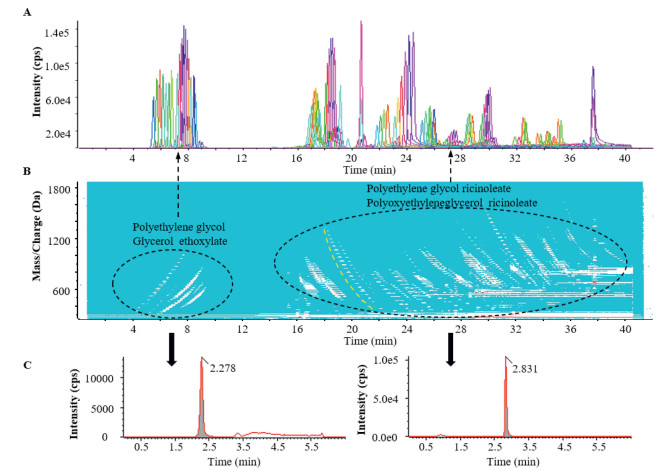
The structural relationships between series of homologues are more directly revealed with the aid of a contour plot on the LC-TOF MS chromatogram (Fig. 2). Homologues that differ from each other in the number of PEG units generally differ slightly in chromatographic retention and are easily recognized in the contour plot as closely arranged dashed lines (see the yellow curved lines in Fig. 2B).

|
Download:
|
| Fig. 2. Strategy for the profile and quantitative analysis of the components of Cremophor EL in vitro and in vivo: (A) Extraction of partial parent ion chromatogram of CrEL (50.0 μg/mL), (B) general landscape of all parent ions of CrEL observed in the positive ion mode and obtained with a contour plot of the LC-TOF MS, and (C) chromatograms of (left) glycerol ethoxylate and (right) CrEL in a sample of rat plasma collected after a single intravenous dose of CrEL. (For interpretation of the references to color in this figure, the reader is referred to the web version of this article.) | |
In the full scan MS of CrEL, the precursor ions can be divided into a hydrophilic block eluting between 4.0 and 9.5 min and a hydrophobic block eluting between 16.0 and 40.0 min (Figs. 2A and B). The parent ions in the hydrophilic block appear as adduct ions of PEG and GE with one or two ammonium ions as shown in Fig. S1A (Supporting information). GE is mainly present as two series of specific fragment ions, namely a series with m/z 45 + 44n Da (such as m/z 89.5597, 133.0859, 177.1121 and 221.1384) from the PEG moiety and a series with m/z 57 + 44n Da (such as m/z 101.0597, 145.0859 and 189.1121) from PEGs with glycerol residues. These characteristics are consistent with observations of standard GE (Fig. S5 in Supporting information).
The parent ions in the hydrophobic block appear as adduct ions along with 1–3 ammonium ions with the general molecular formulae of polyethylene glycol ricinoleate and PGR after deconvolutions (Figs. S1B–D in Supporting information). The latter is mainly present as three series of specific fragment ions, two of which are the same as those derived from GE. The third series with m/z 263 + 44n Da (such as m/z 263.2369, 307.2632, 351.2894, 395.3156, 439.3418 and 483.3680) (Fig. S4 in supporting information) consists of moieties of RA and PEG, the most intense of which at m/z 307.2632 represents an RA residue with one ethylene glycol unit [31].
In this study, the combination of slow gradient LC with high-resolution MS produced symmetrical peaks for most parent ions, as shown in Fig. 2A. However, due to the long analytical runtime as well as the diversity of parent ions and interference from the biological matrix, the parent ions could not be employed in quantitative analysis. Accordingly, chromatographic conditions were optimized so that the components with similar structure and properties co-eluted as symmetrical peaks and produced common fragment ions for quantitative analysis as shown in Fig. 2C.
The mass spectra of CrEL, GE and RA are given in Fig. S2 (Supporting information). The observed parent ions of CrEL exist primarily as doubly and triply charged cationic species withm/z in the range 350–1800 Da (Fig. S2A in Supporting information). The observed m/z of GE is in the range 350-1250 Da and is primarily centered around 1100 Da after deconvolution (Fig. S2B in Supporting information).
Four acquisition procedures, viz in-source fragmentation, MSALL, SWATH MS and product ion, were tested and evaluated for the quantitative analysis of CrEL, GE and RA. To our knowledge, the MSALL and SWATH MS strategies are applied for the first time in quantitation of CrEL and GE. The fragmentation yields of specific fragment ions from CrEL by in-source fragmentation and the MSALL mode are compared. The fragmentation yield by using the MSALL mode is about 10-folds higher than that by in-source fragmentation (Fig. S3 in Supporting information). Furthermore, the CE intensity curve under the MSALL mode is relatively smooth, which indicates a stabilized intensity providing.
The fragment ion at m/z 307.2632 is the most intense and highly specific to the hydrophobic component of CrEL (Fig. S4 in Supporting information), which was employed for the quantitation of the hydrophobic component of CrEL. Similarly, the fragment ion at m/z 145.0859 was selected for the quantitation of the hydrophilic component of CrEL (Fig. S5). The quantitation of RA has been previously carried out by GC-MS [32] and LC-APPI-MS/MS techniques [33]. In the present study, its specific product ion at m/z 183.1391 with the structure shown in Fig. S5C was used for quantitation.
In comparison with the MSALL mode, the signal-to-noise ratio (S/N) under SWATH mode is higher (Fig. S6 in Supporting information), so that the linear range for determination of GE in rat plasma was increased about 5-folds. With DP 30 V and CE 10 eV, the multiply charged precursor ions of GE in LC-TOF MS were distributed in the rangem/z 350-1250 Da as shown in Fig. S2B. Accordingly, the range of the SWATH acquisition window was set at m/z 350-1250 Da.
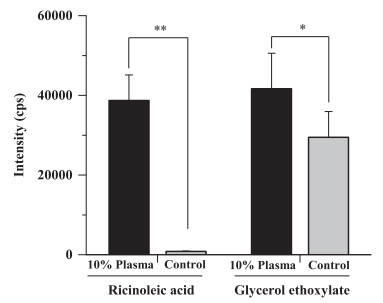
The polyoxyethylene castor oil is susceptible to hydrolysis by esterases, therefore blood samples were collected into heparinized tubes pretreated with the esterase inhibitor, dichlorvos. Degradation during the sample preparation procedure can be effectively inhibited. It was reported that in plasma CrEL might be hydrolyzed after removal of the surfactant, polysorbate 80 [34]. In the in vitro test, a rapid biotransformation of CrEL into GE and RA during incubation with 10% plasma has been observed (Fig. 3). The formation of GE is not proportional to the formation of RA, since the hydrolysis of polyoxyethylene glycerol triricinoleate produces RA and diricinoleate or monoricinoleate but not GE directly.

|
Download:
|
| Fig. 3. Comparison of metabolites of CrEL produced during incubation of a 1 mg/mL solution in 10% rat plasma at 37 ℃ for 5 min with those produced in control samples prepared using deactivated plasma (data are means ± SD, n = 5). All samples were diluted 1:30 prior to analysis. (** P < 0.01, * P < 0.05) | |
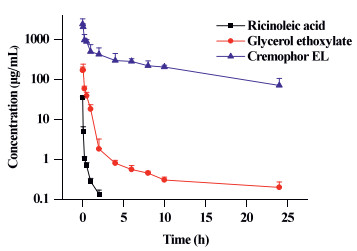
Typical plasma concentration-time profiles for CrEL, GE and RA are shown in Fig. 4. The concentration of CrEL in rat plasma was found to decrease over 24 h from 2425 ± 849 μg/mL to 70.8 ± 35.1 μg/mL, while that of GE decreased from 169 ± 33.7 μg/mL to 0.194 ± 0.0700 μg/mL. The concentration of RA decreased from 34.9 ± 1.92 μg/mL to 0.134 ± 0.0350 μg/mL over 2 h and was below its lower limit of quantitation (LLOQ) 4 h after dosing. The AUC0-24h values for CrEL, GE and RA were 5622 ± 530, 78.8 ± 14.7 and 3.27 ± 0.227 mg L-1 h and the corresponding half-lives (t1/2) in plasma were 8.72 ± 2.79, 14.7 ± 10.27 and 0.554 ± 0.175 h, respectively. The results suggest that CrEL exists mainly in its original form, meanwhile RA will be rapidly eliminated from the bloodstream.

|
Download:
|
| Fig. 4. Plasma concentration-time curves for CrEL and its two metabolites, glycerol ethoxylate and ricinoleic acid, after single intravenous 200 mg/kg doses of CrEL to Sprague Dawley rats (data are means + SD, n = 5). | |
This paper describes the development, validation and application of three separate but related analytical methods for the comprehensive quantitative analysis of CrEL and its metabolites, GE and RA, in rat plasma. The methods, based on LC-Q-TOF MS in conjunction with MSALL, SWATH MS and the product ion mode were successfully applied to a pharmacokinetic study involving single intravenous 200 mg/kg injection of CrEL to Sprague Dawley rats. The results indicate that CrEL undergoes a rapid hydrolysis and the metabolite RA will be subsequently rapidly cleared from the bloodstream. This method enables the investigation of the spatiotemporal fate of CrEL in vivo, which may also facilitate the pharmacological and toxicological studies of polydisperse excipient constituents of this kind.
Declaration of competing interestThe authors include Ruifeng Bai, Dong Sun, Yuqin Shan, Zhiqiong Guo, Dafeng Chu, John Paul Fawcett and Jingkai Gu declare that there is no conflict of interest regarding the publication of this article.
AcknowledgmentsThis work was supported by grants from the National Natural Science Foundation of China (Nos. 81872831 and 82030107), and the National Science and Technology Major Projects for "significant new drugs creation" of the 13th five-year plan (Nos. 2017ZX09101001 and 2018ZX09721002007, China).
Appendix A. Supplementary dataSupplementary material associated with this article can be found, in the online version, at doi:10.1016/j.cclet.2021.04.031.
| [1] |
J. Szebeni, C.R. Alving, S. Savay, et al., Int. Immunopharmacol. 1 (2001) 721-735. DOI:10.1016/S1567-5769(01)00006-6 |
| [2] |
A. Nan, Miscellaneous drugs, materials, medical devices and techniques, in: S.D. Ray (Ed. ), Side Effects of Drugs Annual, Elsevier B.V., Amsterdam, 2016, pp. 523-532.
|
| [3] |
M. Kongshaug, L.S. Cheng, J. Moan, C. Rimington, Int. J. Biochem. 23 (1991) 473-478. DOI:10.1016/0020-711X(91)90176-N |
| [4] |
K. Woodburn, D. Kessel, J. Photochem. Photobiol. B 22 (1994) 197-201. DOI:10.1016/1011-1344(93)06968-9 |
| [5] |
P.C. de Groen, A.J. Aksamit, J. Rakela, G.S. Forbes, R.A. Krom, N. Engl. J. Med. 317 (1987) 861-866. DOI:10.1056/NEJM198710013171404 |
| [6] |
G.J. Lesser, S.A. Grossman, S. Eller, E.K. Rowinsky, Cancer Chemother. Pharmacol. 37 (1995) 173-178. |
| [7] |
T. Shimomura, H. Fujiwara, S. Ikawa, J. Kigawa, N. Terakawa, Lancet 352 (1998) 541-542. |
| [8] |
A.J. Windebank, M.D. Blexrud, P.C. de Groen, J. Pharmacol. Exp. Ther. 268 (1994) 1051-1056. |
| [9] |
D.J. Brat, A.J. Windebank, S. Brimijoin, J. Pharmacol. Exp. Ther. 261 (1992) 803-810. |
| [10] |
D.M. Woodcock, S. Jefferson, M.E. Linsenmeyer, et al., Cancer Res. 50 (1990) 4199-4203. |
| [11] |
G.J. Schuurhuis, H.J. Broxterman, H.M. Pinedo, et al., Br. J. Cancer 62 (1990) 591-594. DOI:10.1038/bjc.1990.335 |
| [12] |
D.S. Chervinsky, M.L. Brecher, M.J. Hoelcle, Anticancer Res. 13 (1993) 93-96. |
| [13] |
L. Webster, M. Linsenmeyer, M. Millward, et al., J. Natl. Cancer Inst. 85 (1993) 1685-1690. DOI:10.1093/jnci/85.20.1685 |
| [14] |
E. Friche, P.B. Jensen, M. Sehested, E.J. Demant, N.N. Nissen, Cancer Commun. 2 (1990) 297-303. |
| [15] |
M. Martin-Facklam, J. Burhenne, R. Ding, et al., Br. J. Clin. Pharmacol. 53 (2002) 576-581. DOI:10.1046/j.1365-2125.2002.01595.x |
| [16] |
K. Singh, Polyoxyethylene castor oil derivatives, in: R.C. Rowe, P.J. Sheskey, M.E. Quinn (Eds. ), Handbook of Pharmaceutical Excipients Sixth edition, Pharmaceutical Press, London, 2009, pp. 542-549.
|
| [17] |
A. Sparreboom, W.J. Loos, J. Verweij, et al., Anal. Biochem. 255 (1998) 171-175. DOI:10.1006/abio.1997.2467 |
| [18] |
E. Brouwer, J. Verweij, B. Hauns, et al., Anal. Biochem. 261 (1998) 198-202. DOI:10.1006/abio.1998.2746 |
| [19] |
M. Kunkel, T. Meyer, J. Bohler, E. Keller, A.W. Frahm, J. Pharm. Biomed. Anal. 21 (1999) 911-922. DOI:10.1016/S0731-7085(99)00212-5 |
| [20] |
A. Sparreboom, O. van Tellingen, M.T. Huizing, W.J. Nooijen, J.H. Beijnen, J. Chromatogr. B Biomed. Appl. 681 (1996) 355-362. DOI:10.1016/0378-4347(95)00544-7 |
| [21] |
A. Ghassempour, M.R. Nabid, M. Talebi, A.A. Entezami, Talanta 59 (2003) 435-441. DOI:10.1016/S0039-9140(02)00466-6 |
| [22] |
V. Vijaya Bhaskar, A. Middha, Int. J. Anal. Chem. 2013 (2013) 135613. |
| [23] |
J. Gong, X. Gu, W.E. Achanzar, et al., Anal. Chem. 86 (2014) 7642-7649. DOI:10.1021/ac501507g |
| [24] |
R. Epping, U. Panne, J. Falkenhagen, Anal. Chem. 90 (2018) 3467-3474. DOI:10.1021/acs.analchem.7b05214 |
| [25] |
A. Nasioudis, J.W. van Velde, R.M. Heeren, O.F. van den Brink, J. Chromatogr. A 1218 (2011) 7166-7172. DOI:10.1016/j.chroma.2011.08.032 |
| [26] |
T. Wang, Y. Guo, Y. He, et al., Acta Pharm. Sin. B 10 (2020) 2002-2009. DOI:10.1016/j.apsb.2020.02.001 |
| [27] |
R. Bade, J.M. White, C. Gerber, Anal. Bioanal. Chem. 410 (2018) 529-542. DOI:10.1007/s00216-017-0747-2 |
| [28] |
H.E. Sidjabat, J. Gien, D. Kvaskoff, et al., Sci. Rep. 8 (2018) 3871. DOI:10.1038/s41598-018-21984-9 |
| [29] |
R. Alvarez-Ruiz, Y. Pico, J. Chromatogr. A 1595 (2019) 81-90. DOI:10.1016/j.chroma.2019.02.041 |
| [30] |
C. Ludwig, L. Gillet, G. Rosenberger, et al., Mol. Syst. Biol. 14 (2018) e8126. |
| [31] |
G. Groeneveld, M.N. Dunkle, M. Rinken, et al., J. Chromatogr. A 1569 (2018) 128-138. DOI:10.1016/j.chroma.2018.07.054 |
| [32] |
H.E. Spinnler, C. Ginies, J.A. Khan, E.N. Vulfson, Proc. Natl. Acad. Sci. U. S. A. 93 (1996) 3373-3376. DOI:10.1073/pnas.93.8.3373 |
| [33] |
B.A. Black, C. Sun, Y.Y. Zhao, M.G. Ganzle, J.M. Curtis, J. Agric. Food. Chem. 61 (2013) 5338-5346. DOI:10.1021/jf400932g |
| [34] |
L. van Zuylen, L. Gianni, J. Verweij, et al., Anticancer Drugs 11 (2000) 331-337. DOI:10.1097/00001813-200006000-00003 |