 2021, Vol. 32


b Department of Thoracic Oncology, Zhejiang Cancer Hospital, Hangzhou 310000, China;
c Department of Cancer Research, Zhejiang Cancer Hospital, Hangzhou 310000, China;
d School of Pharmaceutical Sciences (Shenzhen), Sun Yat-sen University, Shenzhen 518000, China
Metabolic dysregulation was considered as a major hallmark in a variety of human diseases, including cancer, gout, mental disorder and genetic disease [1-6]. As a corollary, understanding the molecular events involved in such diseases has become of interest to many areas of science, which consequently promoted the development of analytical technologies for detecting lipids, metabolites, and proteins in human samples, thus gaining metabolic insights into patients perturbed by either endogenous or exogenous stimulus [7-11]. Mass spectrometry (MS)-based metabolomics has become an excellent platform for measurement of small molecules and xenobiotics present in human tissue and body fluids, which provides clues for clinical biomarkers discovery and potential drug targets for disease treatment [12-14].
Advances in MS instrument equipped with versatile ionization techniques permit comprehensive assessment of both polar and non-polar metabolites. Moreover, MS-based metabolomics is readily compatible with chromatographic separation techniques, such as gas chromatography (GC) and liquid chromatography (LC), which greatly minimizes signal suppression effects and aids metabolite identification by providing a retention time identifier [15, 16]. However, structure annotation of thousands of ions generated in the MS-based metabolomics remains challenging for characterizing metabolic features of biological samples. To address this concern, research efforts have been made to develop database-assisted global metabolomics approaches, which permitted unbiased identification of hundreds of metabolites in parallel [17, 18]. These methods utilized high resolution mass analyzer operated at full scan MS and tandem MS, such as data-dependent acquisition (DDA) [19], data-independent acquisition (DIA) [20] and all ion fragmentation (AIF) [21] to obtain both accurate mass and fragmentation patterns of metabolites. Subsequent database search of mass spectra enabled identification of a wide range of metabolites without a priori knowledge of the metabolome. Moreover, the development of mass spectral databases [22], such as Metlin, KEGG, mzCloud, NuBBEDB and MIBiG, greatly expand the applicability of database-assisted global metabolomics.
Pulmonary tuberculosis and lung carcinoma are among the respiratory diseases, which are caused by either bacterial infection or genetic and environmental factors [23-27]. The excess and exudative pleural effusion is one of the most common forms of extrapulmonary tuberculosis and malignancy, which occurs in approximately 5% of patients with tuberculosis [28] and affects up to 15% of patients who died with malignancy [29]. However, clinical discrimination of tuberculous and malignant pleural effusion is difficult because of the similar symptoms of the diseases, such as fever, cough, expectoration and hemoptysis [30, 31]. Currently available methods for diagnosis of patients with pleural effusions, such as cytological test and histological examination either have low diagnostic accuracy (approximately 60%) or require invasive tissue biopsy [32, 33], which were not widely accepted. Within this context, it is of significance to develop novel strategies for discrimination of tuberculous and malignant pleural effusions. In this current study, we developed a database-assisted global metabolomics method for investigation of the metabolic traits of pleural effusions caused by tuberculosis and malignancy, in which ultra-high-performance liquid chromatography (UHPLC) coupled to high resolution Orbitrap MS was applied for untargeted metabolite screening. The mass spectrometer was operated at full scan and DDA mode for simultaneously obtaining the MS and MS/MS spectra of metabolites. Unbiased metabolite identification was conducted through mzCloud database searching. Applying this method revealed differential metabolites and candidate biomarkers for discrimination of tuberculous and malignant pleural effusions with high sensitivity and specificity.
Our primary goal was to establish an LC–MS based metabolomics approach, enabling simultaneous identification and analysis of metabolites present in pleural effusion samples. Metabolite separation was performed using an amine column with two sample injections, configurated with positive and negative ionization mode in electrospray ionization (ESI)-MS detection. A hybrid quadrupole-orbitrap mass analyzer working on the full scan and DDA mode was applied to collect MS and MS/MS spectra of metabolites in biological samples. The mass resolution of mass analyzer operating in full scan mode and tandem MS were set as 35, 000 and 17, 500, respectively (Table S1 in Supporting information). In addition, to expand MS/MS coverage of low-abundance metabolites in samples, dynamic exclusion mode with an exclusion time of 3.5 s (approximate half of the peak width) was used, which allowed precursor ion to be temporarily placed into exclusion list after its MS/MS spectrum has been obtained. Under this condition, reproducible MS/MS scans (at least three times) on each qualified precursor ion could be obtained. The next step is unbiased identification of metabolites through mass spectral matching, in which the extracted precursor ion and MS/MS spectra were automatically searched in a mzCloud database, which contains approximately three thousand primary and secondary metabolites.
Then we applied this established method for investigation of metabolic characteristics of pleural effusions from sixty-six patients with either tuberculosis or malignancy (Table S2 in Supporting information). By applying this method, 7317 metabolite features in ESI positive-ion (ESI+) mode and 6029 in ESI negative-ion (ESI−) mode were detected in the pleural effusion samples. The average of coefficient of variation (CV) values of the detected MS variables in positive and negative mode was 10.9% and 12.3% respectively, demonstrating good repeatability of the method. Fig. 1 shows the distribution of CV values of these detected ions in QC samples across the entire experiment, which demonstrated that most of the metabolite ions had CVs less than 10%, and only less than 2% of metabolites had CVs greater than 30%. Searching the MS and consensus MS/MS spectra in mzCloud database resulted in 561 putatively identified metabolites with spectral similarity higher than 50%. Of those, 104 in the positive mode and 90 in the negative mode were confirmed by using authentic standards, which covered a great variety of endogenous metabolites, including amino acids, sugars, organic acids, carnitines, dipeptides, vitamins, nucleosides and fatty acids. The retention time, monoisotopic mass and MS/MS fragments of these identified metabolites were summarized in Tables S3 and S4 (Supporting information).

|
Download:
|
| Fig. 1. Coefficient of variation values of metabolite features determined in the ESI positive- (A) and negative- (B) ion mode and PLS-DA plots of tuberculous and malignant pleural effusions in ESI positive- (C) and negative- (D) ion mode. Green dots and red dots represent malignant pleural and tuberculous pleural effusions samples, respectively. | |
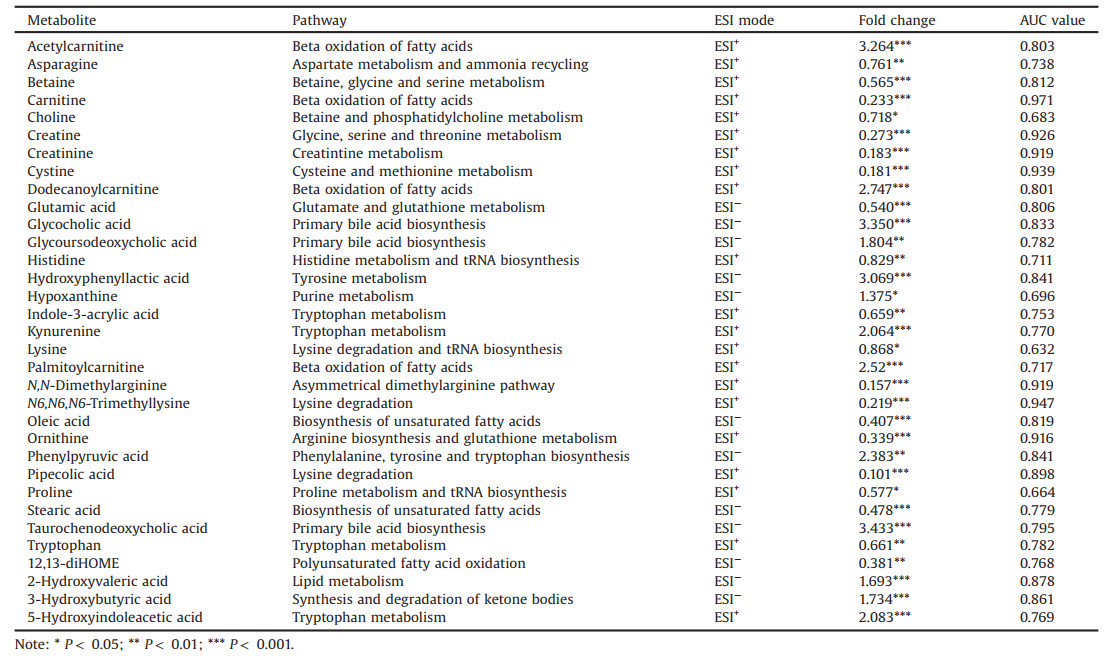
Next, we investigated the metabolites that differed significantly between tuberculous and malignant pleural effusions. Partial least squares discriminant analysis (PLS-DA) was employed to demonstrate the clustering trend of the metabolic profiles between the two groups of samples. A noticeable separation was observed between the tuberculous and malignant pleural effusion samples, demonstrating significant differentiation in their metabolic profiles. Meanwhile, no overfitting was observed after cross validation and permutation test (Fig. S1 in Supporting information). Metabolic variables with a VIP value exceeding 1.2 and P-value less than 0.05 were selected as differential metabolites and summarized in Table 1. Of note, most of amino acids, including tryptophan, ornithine, proline, asparagine, glutamate and histidine were significantly elevated in the malignant pleural effusion, whereas metabolites generated from tryptophan catabolism, such as kynurenine and 5-hydroxyindole-3-acetic acid were increased in the tuberculous pleural effusion. This phenomenon may be attributed to the over-exuberant inflammatory responses, for instance, the activation of interferon-γ [34] and increased activity of indoleamine 2, 3 dioxygenase [35] in patients with tuberculosis, which are the important inducers to stimulate tryptophan catabolism and generate kynurenine and other downstream metabolites. Decreased levels of carnitine and fatty acids (e.g., oleic acid and stearic acid) were noted in tuberculous pleural effusion. These results accompanied with elevated acylcarnitines levels collectively demonstrated the enhanced β-oxidation of fatty acids in tuberculous pleural effusion samples. In addition, accumulation of 12, 13-DiHOME, an oxidized polyunsaturated fatty acid, was detected in malignant pleural effusion, implicating the alteration of the redox state. Another metabolic distinction was the bile acid metabolism, as evidenced by the consistent higher levels of glycocholic acid, glycoursodeoxycholic acid, and taurochenodeoxycholic acid in tuberculous pleural effusion samples. Next, we conducted pathway analysis based on those differential metabolites (Fig. S2 in Supporting information). A variety of metabolic pathways, such as tryptophan metabolism, histidine metabolism, lysine degradation, aminoacyl-tRNA biosynthesis, and carnitine synthesis were found to be discriminated between tuberculous and malignant pleural effusion samples.
|
|
Table 1 Differential metabolites identified between tuberculous and malignant pleural effusions. |
The distinct metabolic profiles between tuberculous and malignant pleural effusion provided potential metabolite candidates for discrimination of clinical pleural effusion samples without the needed of tissue biopsy. Therefore, we measured the area under the ROC curve (AUC) to estimate the predictive accuracy of each metabolite. As shown in the Table 1, seven metabolites, including carnitine, creatine, creatinine, cystine, dimethylarginine, trimethyllysine and ornithine showed excellent ability for discriminating the tuberculous and malignant pleural effusion samples, with AUC values higher than 0.90. To further improve the diagnostic performance of these biomarkers, multiple metabolites from relevant metabolic pathways were combined for ROC analysis. As shown in Fig. 2, a diagnostic panel consisting of the three metabolites of glycocholic acid, glycoursodeoxycholic acid and taurochenodeoxycholic acid from bile acid metabolism resulted in a higher AUC value (0.933) than the results obtained from individual metabolite. In addition, the combination of tryptophan with 5-hydroxyindoleacetic acid plus kynurenine led to a better AUC value (Fig. S3 in Supporting information). Notably, selecting the six metabolites from the β-oxidation of fatty acids, including carnitine, acetylcarnitine, dodecanoylcarnitine, palmitoylcarnitine, oleic acid and stearic acid as a diagnostic panel yielded the highest AUC value of 0.995 (Fig. S4 in Supporting information). The results demonstrated great potential of these candidate biomarkers for discriminating tuberculous and malignant pleural effusions with high sensitivity and specificity.

|
Download:
|
| Fig. 2. ROC analysis of (A) glycocholic acid, (B) glycoursodeoxycholic acid, (C) taurochenodeoxycholic acid and (D) a panel consisting of these three metabolites. | |
In this current study, we implemented a database-assisted metabolomics method, performed on an UHPLC-Orbitrap MS system operating in the full scan and DDA mode. The combination of high resolution MS and database searching enabled simultaneous identification and analysis of metabolites present in samples. The developed method offers significant advantages over conventional MS-based global profiling approaches. First, it is less time-consuming because full scan MS and tandem MS can be obtained in a single analytical run. Second, it greatly expands the metabolite coverage through mass spectral searching, which permits unbiased identification of metabolites without a priori knowledge of the metabolome. As a proof of practical application, we used this approach for investigation of metabolic traits of pleural effusions caused by tuberculosis and malignancy. Applying this method enabled unbiased identification of 194 endogenous metabolites in the samples, and 33 out of them were found to be clearly differed between tuberculous and malignant pleural effusions. The results of this study not only gained insights into the metabolic traits of the two types of pleural effusions, but also provided non-invasive biomarkers for diagnosis of these pleural effusion samples with high sensitivity and specificity. In addition, as our developed method enabled simultaneous identification and quantification of metabolites present in biological samples, we envisage that this method could be used for differentiation of other types of pleural effusions with relevant clinical samples being collected. In further study, these candidate biomarkers discovered in this study are expected to be verified using external and multicenter cohorts.
Declaration of competing interestThe authors declare that they have no known competing financial interests or personal relationships that could have appeared to influence the work reported in this paper.
AcknowledgmentsThis study was supported by grants from National Key Research and Development Program of China (No. 2017YFC1600500), National Nature Science Foundation of China (Nos. 21575120 and 21707112), and Hong Kong General Research Fund (No. 12302317).
Appendix A. Supplementary dataSupplementary material related to this article can be found, in the online version, at doi:https://doi.org/10.1016/j.cclet.2021.03.052.
| [1] |
H. Zhao, H. Li, A.C.K. Chung, et al., J. Proteome Res. 18 (2018) 292-300. |
| [2] |
P. Saudemont, J. Quanico, Y.-M. Robin, et al., Cancer Cell 34 (2018) 840-851. DOI:10.1016/j.ccell.2018.09.009 |
| [3] |
A.M. Porcari, J. Zhang, K.Y. Garza, et al., Anal. Chem. 90 (2018) 11324-11332. DOI:10.1021/acs.analchem.8b01961 |
| [4] |
M. Agathocleous, C.E. Meacham, R.J. Burgess, et al., Nature 549 (2017) 476-481. DOI:10.1038/nature23876 |
| [5] |
E. Hessmann, M. Patzak, L. Klein, et al., Gut 67 (2018) 497-507. DOI:10.1136/gutjnl-2016-311954 |
| [6] |
S.P. Su, E. Flashner-Abramson, S. Klein, et al., Mol. Cancer Ther. 17 (2018) 931-942. DOI:10.1158/1535-7163.MCT-17-0377 |
| [7] |
J.R. Idle, F.J. Gonzalez, Metab. Cell Metab. 6 (2007) 348-351. DOI:10.1016/j.cmet.2007.10.005 |
| [8] |
W.B. Dunn, D.I. Ellis, Trac-Trend Anal. Chem. 24 (2005) 285-294. DOI:10.1016/j.trac.2004.11.021 |
| [9] |
H. Luan, X. Wang, Z. Cai, Mass Spectrom. Rev. 38 (2019) 22-33. DOI:10.1002/mas.21553 |
| [10] |
C. Zhao, P. Xie, T. Yang, et al., Chin. Chem. Lett. 29 (2018) 1281-1283. DOI:10.1016/j.cclet.2018.01.034 |
| [11] |
G. Xie, L. Zhu, Y. Song, et al., Chin. Chem. Lett. 32 (2021) 2164-2168. DOI:10.1016/j.cclet.2020.11.064 |
| [12] |
X. Shi, S. Wang, P. Jasbi, et al., Anal. Chem. 91 (2019) 13737-13745. DOI:10.1021/acs.analchem.9b03107 |
| [13] |
L.C. Menikarachchi, R. Dubey, D.W. Hill, et al., Metabolites 6 (2016) 17. DOI:10.3390/metabo6020017 |
| [14] |
H. Zhao, J. Li, X. Ma, et al., Chin. Chem. Lett. 29 (2018) 102-106. DOI:10.1016/j.cclet.2017.06.013 |
| [15] |
C.H. Johnson, J. Ivanisevic, G. Siuzdak, Nat. Rev. Mol. Cell Biol. 17 (2016) 451-459. DOI:10.1038/nrm.2016.25 |
| [16] |
M. Vinaixa, E.L. Schymanski, S. Neumann, et al., Trac-Trend Anal. Chem. 78 (2016) 23-35. DOI:10.1016/j.trac.2015.09.005 |
| [17] |
S. Devi, B. Nongkhlaw, M. Limesh, et al., Sci. Rep. 9 (2019) 1-11. |
| [18] |
Y. Wang, G. Kora, B.P. Bowen, et al., Anal. Chem. 86 (2014) 9496-9503. DOI:10.1021/ac5014783 |
| [19] |
J.P. Koelmel, N.M. Kroeger, E.L. Gill, et al., J. Am. Soc. Mass Spectrom. 28 (2017) 908-917. DOI:10.1007/s13361-017-1608-0 |
| [20] |
Y. Chen, Z. Zhou, W. Yang, et al., Anal. Chem. 89 (2017) 6954-6962. DOI:10.1021/acs.analchem.6b04727 |
| [21] |
H. Tsugawa, T. Cajka, T. Kind, et al., Nat. Methods 12 (2015) 523-526. DOI:10.1038/nmeth.3393 |
| [22] |
H. Mohimani, A. Gurevich, A. Shlemov, et al., Nat. Commun. 9 (2018) 1-12. DOI:10.1038/s41467-017-02088-w |
| [23] |
E. Tacconelli, E. Carrara, A. Savoldi, et al., Lancet Infect. Dis. 18 (2018) 318-327. DOI:10.1016/S1473-3099(17)30753-3 |
| [24] |
O. Raaschou-Nielsen, R. Beelen, M. Wang, et al., Environ. Int. 87 (2016) 66-73. DOI:10.1016/j.envint.2015.11.007 |
| [25] |
L. Stabile, G. Buonanno, P.A. Avino, et al., Environ. Pollut. 235 (2018) 65-73. DOI:10.1016/j.envpol.2017.12.055 |
| [26] |
P.K. Drain, K.L. Bajema, D. Dowdy, et al., Clin. Microbiol. Rev. 31 (2018) 18-21. |
| [27] |
F.R. Hirsch, G.V. Scagliotti, J.L. Mulshine, et al., Lancet 389 (2017) 299-311. DOI:10.1016/S0140-6736(16)30958-8 |
| [28] |
A.M. Bays, D.J. Pierson, Respir. Care 57 (2012) 1682-1684. DOI:10.4187/respcare.01443 |
| [29] |
G. Dixon, D. de Fonseka, N. Maskell, J. Thorac. Dis. 7 (2015) 1041-1051. |
| [30] |
M. Bhatt, S. Kant, R. Bhaskar, South Asian J. Cancer 1 (2012) 36-42. DOI:10.4103/2278-330X.96507 |
| [31] |
K. Zhai, Y. Lu, H.-Z. Shi, J. Thorac. Dis. 8 (2016) 486-494. DOI:10.21037/jtd.2016.05.87 |
| [32] |
O. Epelbaum, N.M. Rahman, Ann. Transl. Med. 7 (2019) 352-363. DOI:10.21037/atm.2019.03.61 |
| [33] |
A. Saguil, K. Wyrick, J. Hallgren, Am. Fam. Physician 90 (2014) 99-104. |
| [34] |
S.H. Kaufmann, A. Dorhoi, Curr. Opin. Immunol. 25 (2013) 441-449. DOI:10.1016/j.coi.2013.05.005 |
| [35] |
J. Weiner, S.K. Parida, J. Maertzdorf, et al., PLoS One 7 (2012) e40221. DOI:10.1371/journal.pone.0040221 |