 2021, Vol. 32


The extensive exploitation of natural fuel has brought a battery of severe environmental issues such as acid rain, photochemistry smog, eutrophia, and ozone depletion [1-4], in which nitrogen oxides and sulfur dioxide are the primary pollutants from fuel combustion [5, 6]. Therefore, environmental organizations in various countries strictly supervised the emissions of nitrogen oxides and sulfur dioxide. To date, the environmental treatment with respect to SO2 and NO2 are fairly well-addressed because they are easily dissolved in water in solution [7-9]. But it is hard to handle NO discharge accounting for about 95% in nitrogen oxides (NOx) from coal-fired flue gas because of extremely low solubility of NO in water. There are different technologies of pre- and post-emission control methods for reducing NO emission, among which selective catalytic reduction (SCR) is extensively industrialized [10, 11]. However, it was subjected to the expensive and latent poisoned catalyst, fussy procedure, and secondary pollution. For this reason, for developing a high-powered and low-cost technology for nitric oxide absorption is imminent for air pollution control.
In the past few years, NO removal by urea, a very cheap and non-toxic reducing agent, was extensively researched. The mechanism of denitrification by urea is that nitrogen oxide dissolves into water to form nitric acid and nitrous acid, and then react with urea to form N2 and CO2. The total denitrification reaction by urea can be shown as Eq. 1 [12].

|
(1) |
But the nitrogen oxide absorption efficiency was popularly less than 40% because of low solubility of NO in water [13]. In order to solve this issue, mixing suitable oxidation additives with urea solution is a practical and effective approach [12, 14-16]. For example, Zhou et al. [16] added Na2S2O8 into urea solution for denitrification of marine engine exhaust gases, and found that the NO removal efficiency of 99.7% can be obtained at 80 ℃, 0.1 mol/L Na2S2O8, and 4 mol/L urea. In addition, the Na2S2O8/urea system not only achieved effective NO removal efficiency, but also reduced the nitrate in wastewater. Fang et al. [17] employed different additive solutions (H2O2, NaClO, NaClO2, KMnO4) to urea solution for NO removal, finding that they could all evidently improve NO removal efficiency, among which the removal efficiencies of NaClO2 and KMnO4 in urea solution were more than 90%. These additives can effectively convert relatively water insoluble NO to soluble NO2, thereby react with urea. Thus, the NO removal efficiency is improved. NaClO2, KMnO4, and Na2S2O8 are strong oxidants and can obtain a satisfactory NO removal efficiency with urea. However, NaClO2 is flammable and explosive, and easy to release toxic gas ClO2 under acid condition [18]. Na2S2O8 is harmful to human health and environment. KMnO4 is toxic to aquatic organisms and may damage hydroecology [19]. Seeking an environment-friendly additive with high oxidation is significant for further industrial application of denitrification by urea solution.
Compared with above these oxidation additives, ferrate(Ⅵ) is an environment-friendly powerful oxidant over a wide pH range on wastewater disposal for removal of inorganic pollutant, organic compound, foul smell, nutrient, radionuclide, and so on [20-22]. It is probably the strongest oxidant of all practical applications in pollutant treatment. The standard reduction potential is 2.20V and 0.72V in acidic and basic solution, respectively [23]. In the field of flue gas purification, ferrate(Ⅵ) was recently used for NO and SO2 removal with respect to the absorption efficiency, the kinetics, and byproducts analysis. For example, He et al. [24] used ferrate(Ⅵ) for the simultaneous desulfurization and denitrification, finding that the NO removal efficiency was more than 90%, and the SO2 removal efficiency was 100% by room temperature. Liu et al. [25] studied the strengthening mechanism of NO removal by ferrate(Ⅵ), finding that NO removal reaction with ferrate(Ⅵ) is a rapid reaction, and it was oxidized by ferrate(Ⅵ) to nitrite, then to nitrate. But ferrate(Ⅵ) is unstable in solution, especially in acid solution. Therefore, a high NO removal efficiency by ferrate(Ⅵ) can be obtained with high concentration of ferrate(Ⅵ), which results in high operation costs. In addition, the accumulated nitrite and nitrate treatment becomes a thorny problem.
Considering the advantages and disadvantages of urea denitrification and ferrate(Ⅵ) denitrification, adding ferrate(Ⅵ) into urea solution forms a new mixed absorbent, which can not only solve low solubility of NO in urea solution, but also reduce the nitrate content in the washing liquid and produce non-toxic gases which can be directly discharged in the process of denitrification, so as to develop a new efficient and low-cost denitrification absorbent.
Based on the above ideas and discussions, the main intention of this paper is to investigate the NO removal from flue gas using ferrate(Ⅵ)/urea in a bubbling reactor. The four effective factors including urea concentration, ferrate(Ⅵ) concentration, reaction temperature and pH value were experimentally and statistically considered and optimized to obtain optimum removal conditions by response surface methodology (RSM) analysis with Design-Expert statistical software. These results will be useful for the further application of this new technology.
Potassium ferrate was obtained by Kaida Chemical Co., Ltd. (Tianjin, China) and used without additional purification. Urea (99.0%) was purchased by Guangdong Guanghua Technology Co., Ltd., China. Nitrogen (99.999%), and nitric oxide (99.99%) were obtained from Jiangxi Guohui Gas Co., China. All reagents are AR grades. The flow-process chart of NO removal was presented in Text S1 (Supporting information). The experimental design for RSM analysis was shown in Text S2 (Supporting information).
The NO removal efficiency was measured by different the experimental conditions given by the system Design-Expert statistical software to investigate the influence imposed with the four selected variables on NO absorption efficiency. Table S3 (Supporting information) shows the absorption efficiency of nitric oxide under various parameter values.
Results of variance analysis of second-order formula on nitric oxide absorption efficiency were shown by Table S4 (Supporting information). Whether the model term is significant depends on the P-value. The model terms is significant by P-value below 0.05, and it is not significant when P value is more than 0.10. The f-value could explain the distribution of experimental NO removal efficiency around the predicted data by the model [26].
It can be seen from Table S4 that the model is very significant ( P < 0.0001) and is reasonable, which is in good agreement with the experimental results. Besides, we could find that three linear terms (temperature, urea concentration, ferrate(Ⅵ) concentration) and four quadratic terms (pH, temperature, urea concentration, ferrate(Ⅵ) concentration) were significant, but the interactive terms were not significant.
Fidelity of the model of nitric oxide absorption by ferrate(Ⅵ)/urea systems was checked with the determined coefficient ( R2), coefficient of variation (CV), predictive determinant coefficient ( Rpred2), adequate precision (AP), predicted residuals error sum of squares (PRESS), and adjusted determination coefficient ( RAdj2). The values of the above parameters are shown in Table 1. For example, R2 (0.9875) and adjusted RAdj2 (0.9759) shows that over 97% variabilities in the response can be explained in this model. The Rpred2 (0.9321) is fitted well with the RAdj2 (0.9759), and coefficient of variation (1.03%) < 10%, suggesting that the model was highly reliable and accurate for forecasting NO removal efficiency with ferrate(Ⅵ)/urea system [27]. The signal to noise ratio is measured by AP. Here, the ratio of 29.858 shows an adequate signal. This model can be used to navigate the design space [28]. The PRESS represents difference between the predictive and experimental results. The low PRESS (51.55) usually represents a desired model.
|
|
Table 1 Quadratic model ANOVA results responses. |

The diagnostic charts in the Fig. 1 can evaluate the adequateness of the regressive model [29]. From Fig. 1a, it is shown that the experimental data and the predictive values on NO removal efficiency are fitted well.

|
Download:
|
| Fig. 1. (a) The contrast of the predictive and experimental data on NO removal efficiency. (b) Normal probability graph of original residuals. (c) The internally studentized residuals vs. the predictive chart. | |
The dots gathering around the diagonal line shows the agreement of the analysis system. From Fig. 1b, the residuals of regressive model with normal probability indicates that there are few critical infractions of the hypotheses underlying the examination, which confirms the normality hypotheses and independence. The contrast indicates that the individual residual errors are all lower than the twice of the square root of the error variance.
The point distribution shown in Fig. 1c estimates the hypothesis of invariant variance. These randomly scattered points are in the range of −3 and +3, which can be seen as the detecting limit [30]. For example, most of the spots are concentrated in a more compact region. From the Figs. 1a and c, a systematic error, derived from inconsistent points may be due to the mistakes in the experiment operation. Therefore, the second-order formula and the regressive model are appropriate and excellent for catching the relevance between the researched parameters and variables of the nitric oxide absorption.
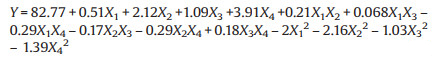
Finally, based on the ANOVA result, the quadratic equation shown in code value of variables is obtained with the responding value of nitric oxide absorption efficiency by Eq. 2.
|
(2) |
In addition, the quadratic formula was employed to evaluated the linear, square and interactive effects of four independent variables on dependent variable. The coefficients of pH value, temperature, urea concentration, and ferrate(Ⅵ) concentration in Eq. 2 are 0.51, 2.12, 1.09 and 3.91, respectively, inferring the four variables all have a positive independent effect on nitric oxide absorption, in which X4 with the highest coefficient of +3.91 is more evident.
The coefficients of squared independent variables ( X12, X22, X32, X42) are minus, which show negative influence. The three interactive terms ( X1 X2, X1 X3, X3 X4) with coefficients of 0.21, 0.068, and 0.18, respectively, have a positive independent influence.
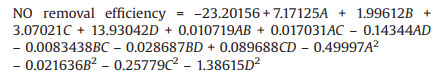
In addition, the quadratic equation shown in actual value of variables is obtained with the responding value of nitric oxide absorption efficiency by Eq. 3. The pH value, temperature, urea concentration and ferrate(Ⅵ) concentration were labelled as A, B, C, and D, respectively. The nitric oxide absorption efficiency was estimated with respect to these various import variables.
Finally, based on the ANOVA results, the Eqs. 2 and 3 are all adequate to predict nitric oxide absorption efficiency in the variables' studied range.
|
(3) |
Here, the two dimensional (2D) profile and three dimensional (3D) curved plot were analyzed to demonstrate the variation of dependent variable with independent variable vividly, and the mutual effect of these variables on nitric oxide absorption efficiency could be explained [31]. When the influence of the selected two factors on responding value was analyzed, the code values of other variables were fixed to zero. Finally, the nitric oxide absorption system can be optimized from their 3D surface plots.
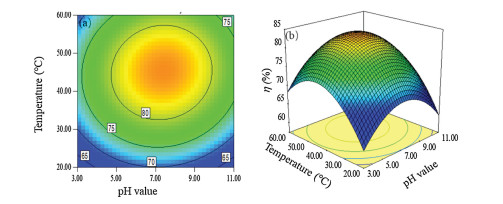
The interrelationship between temperature and pH value on the nitric oxide absorption efficiency was presented in Fig. 2. The nitric oxide removal efficiency raised with increase of temperature and pH value within low range of the two variables, and then declined with further increasing of pH and temperature. However, the nitric oxide absorption efficiency declined with the simultaneous increasing of these two variables, and a antagonism was existed between them. Ultimately, a higher nitric oxide absorption efficiency could be gained at pH value of 6.0–8.0, and temperature of 40−50 ℃.

|
Download:
|
| Fig. 2. RSM diagrams of nitric oxide absorption efficiency with function of pH value and temperature. (a) 2D contour profile, (b) 3D surface diagram. | |
The effects of pH value and urea concentration on nitric oxide absorption efficiency were shown in Fig. S2 (Supporting information). During pH value from 3.0 to 11.0, the nitric oxide absorption efficiency raises and then slightly declines with the urea concentration increasing. In urea concentration of 1−9wt%, the NO efficiency increases then declines with the increasing of pH 3–11. It is also seen from Fig. S2 that a greater nitric oxide absorption efficiency could be gained at pH 7−9, and temperature of 40−50 ℃.
The interplay of ferrate(Ⅵ) concentration and pH value on nitric oxide absorption efficiency was shown in Fig. S3 (Supporting information). The nitric oxide absorption efficiency increases and then decreases with pH value raise within high ferrate(Ⅵ) concentration. But at pH value of 3.0–11.0, the nitric oxide absorption efficiency raises as ferrate(Ⅵ) concentration increases. From Fig. S3, a higher nitric oxide absorption efficiency could be realized at pH value about 7.0 and ferrate(Ⅵ) concentration of 4−5 mmol/L.
The interactivity of temperature and urea concentration in nitric oxide absorption efficiency was shown in Fig. S4 (Supporting information). The nitric oxide removal efficiency raises with the increase of temperature and urea concentration in low ranges, while sharply decreased with the enhancement of temperature.
From Fig. S5 (Supporting information), within the ferrate(Ⅵ) concentration of 1−5 mmol/L, the nitric oxide absorption efficiency increased as temperature increased, while slightly decreased with the continued increasing of temperature. During temperature from 20−60 ℃, ferrate(Ⅵ) concentration had a positive independent influence on nitric oxide absorption. Ultimately, from Fig. S5, a higher nitric oxide absorption efficiency could be achieved in ferrate(Ⅵ) concentration of 4−5 mmol/L, and temperature of 40−50 ℃.
From Fig. S6 (Supporting information), the positive influence of ferrate(Ⅵ) concentration on nitric oxide removal efficiency was evident. The nitric oxide absorption efficiency was comparatively greater at higher ferrate(Ⅵ) concentration in the high range of urea concentration. The nitric oxide absorption efficiency increases and then decreases as urea concentration increases in ranges of ferrate(Ⅵ) concentration. Ultimately, from Fig. S6, a higher nitric oxide absorption efficiency could be achieved at urea concentration of 7−9wt%, and ferrate(Ⅵ) concentration of 4−5 mmol/L.
The optimum NO removal parameters were obtained by analyzing the fitted the second order equation and mesh analysis of RSM plots. They were shown in Table 2. From Table 2, The optimum nitric oxide absorption efficiency of 86.3% was statistically realized at a ferrate(Ⅵ) concentration 4.4 mmol/L, urea concentration of 7.1wt%, pH value of 7.1, and reaction temperature of 43.8 ℃. Besides, the NO removal verification experiment was conducted at the optimum points for three times, and the experimental results were presented in Table 2. Three times of NO removal experiments were carried out at the optimal conditions. The experimental results are shown in Table 2. It can be seen that the mean value of three experiments (85.2%) was very close to the predicted value (86.3%) on nitric oxide absorption efficiency. Obviously, the optimum parameters are reliable and desirable.
|
|
Table 2 The optimal conditions for NO removal. |

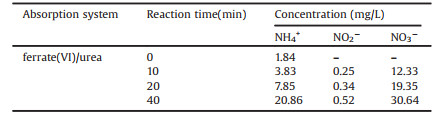
In addition, the products in the process of NO removal by ferrate(Ⅵ)/urea solution were analyzed (Table 3). To begin with, ammonium mainly comes from the hydrolysis of urea itself. Because of the slow hydrolysis of urea, the concentration of ammonium is very low (compared with urea concentration) in the whole absorption process. Ammonium is a nonpolar molecule with stable tetrahedral space structure, and is difficult to be oxidized by ferrate(Ⅵ). Secondly, nitrite mainly comes from the oxidation of NO. Because of the strong oxidation capacity of potassium ferrate, nitrite can be oxidized to nitrate directly, and the concentration of nitrite is also very low. The concentration of nitrate increased with time, and the final nitrate concentration in solution was 30.64 mg/L.
|
|
Table 3 Products of NO removal process in ferrate (Ⅵ)/urea solution under best conditions. |
In this experiment, the NO removal efficiency was about 85%, and the total concentration of NO2− and NO3− was about 31.16 mg/L. Based on the conservation of N element, it can be judged that most of NO was converted into N2. This is mainly because nitrite and nitrate react with urea to produce N2. And nitrate concentration was mainly related to the oxidation degree of NO and the concentration of urea. The oxidation rate of NO by potassium ferrate is higher than reaction rate between urea and nitrate, which causes increasing of nitrate concentration with time.
Therefore, according to previous study [16, 17, 24, 25], and the concentration of related ions, the mechanism of NO removal by ferrate (Ⅵ)/urea solutions is mainly divided into two steps. Firstly, NO is oxidized to nitric acid and nitrite by ferrate(Ⅵ), in which because of the strong oxidation capacity of potassium ferrate, the concentration of nitrate is much higher than that of nitrite. Secondly, the nitrate and nitrite react with urea to produce N2 and CO2. In this system, ferrate(Ⅵ) and urea play different roles in promoting NO absorption, and donot consume each other, forming a continuous and stable denitrification system. The reaction mechanism was deduced as follows (Eqs.4-7):

|
(4) |

|
(5) |

|
(6) |

|
(7) |
In conclusion, NO absorption process by using ferrate(Ⅵ)/urea was investigated on RSM. The quadratic response surface model was adequate for forecasting the relation between nitric oxide absorption efficiency and operation variables, such as pH value, ferrate(Ⅵ) concentration, urea concentration, and temperature. The regressive equation, designed with central composite design, agreed well with experiment case, which was confirmed with the R2 and Radj2 values of 0.9875 and 0.9759, respectively. The optimum NO removal conditions were realized in pH of 7.1, reaction temperature of 43.8 ℃, urea concentration of 6.3wt%, ferrate(Ⅵ) concentration of 4.4 mmol/L, in which the predictive and experiment maximums on nitric oxide absorption efficiency were 86.3% and 85.2%, respectively. Finally, N-containing product analysis shows that nitric oxide was primarily translated into N2 and nitrate.
Declaration of competing interestThe authors report no declarations of interest.
AcknowledgmentThe project was supported by the National Natural Science Foundation of China (Nos. 21808031 and 11905029).
Appendix A. Supplementary dataSupplementary material related to this article can be found, in the online version, at doi:https://doi.org/10.1016/j.cclet.2021.03.003
| [1] |
F. He, X. Deng, J. Ding, RSC Adv. 8 (2018) 32138-32145. DOI:10.1039/c8ra06376a |
| [2] |
L. Yang, X. Zhang, Q. Kan, B. Zhao, X. Ma, Chinese J. Chem. Eng. 12 (2019) 3017-3028. |
| [3] |
H. Zhang, M. Zhang, L. Hao, et al., Fuel Process. Technol. 201 (2020) 106342. DOI:10.1016/j.fuproc.2020.106342 |
| [4] |
Y. Dai, R. Lv, J. Fan, et al., J. Hazard. Mater. 391 (2020) 121467. DOI:10.1016/j.jhazmat.2019.121467 |
| [5] |
Y.X. Li, Q.Y. Xu, R.T. Guo, et al., Fuel 254 (2019) 115612. DOI:10.1016/j.fuel.2019.06.020 |
| [6] |
C. Yuan, W. Cui, Y. Sun, et al., Chin. Chem. Lett. 31 (2020) 751-754. DOI:10.1016/j.cclet.2019.09.033 |
| [7] |
M. Chen, B. Xie, F. He, X. Deng, Energy Fuel 33 (2019) 1383-1391. DOI:10.1021/acs.energyfuels.8b03862 |
| [8] |
K. Huang, X. Deng, F. He, RSC Adv. 8 (2018) 5550-5558. DOI:10.1039/C7RA12963G |
| [9] |
J. Jin, J. Chen, H. Wang, P. Hu, Chin. Chem. Lett. 30 (2019) 618-623. DOI:10.4163/jnh.2019.52.6.618 |
| [10] |
Z. Wang, R. Guo, X. Shi, et al., Chem. Eng. J. 381 (2020) 122753. DOI:10.1016/j.cej.2019.122753 |
| [11] |
Y. Liu, R. Guo, C. Duan, et al., Fuel 271 (2020) 117667. DOI:10.1016/j.fuel.2020.117667 |
| [12] |
J. Wei, Y. Luo, P. Yu, B. Cai, H. Tan, J. Ind. Eng. Chem. 15 (2009) 16-22. DOI:10.1016/j.jiec.2008.07.010 |
| [13] |
H. Zhu, Y. Mao, X. Yang, et al., Sep. Purif. Technol. 74 (2010) 1-6. DOI:10.1109/CISE.2010.5676718 |
| [14] |
R. Guo, Y. Yu, W. Pan, et al., Sep. Purif. Technol. 49 (2014) 2085-2089. DOI:10.1080/01496395.2014.907809 |
| [15] |
P. Fang, C. Cen, X. Wang, et al., Fuel Process. Technol. 106 (2013) 645-653. DOI:10.1016/j.fuproc.2012.09.060 |
| [16] |
H. Xi, S. Zhou, J. Zhou, Chem. Eng. J. 362 (2019) 12-20. DOI:10.1016/j.cej.2019.01.002 |
| [17] |
P. Fang, C. Cen, Z. Tang, et al., Chem. Eng. J. 168 (2011) 52-59. DOI:10.1016/j.cej.2010.12.030 |
| [18] |
H. Chu, T.W. Chien, B.W. Twu, J. Hazard. Mater. 84 (2001) 241-252. DOI:10.1016/S0304-3894(01)00215-1 |
| [19] |
H. Chu, T.W. Chien, S. Li, Sci. Total Environ. 275 (2001) 127-135. DOI:10.1016/S0048-9697(00)00860-3 |
| [20] |
D. Tiwari, J.K. Yang, S.M. Lee, Environmen Eng. Res. 10 (2005) 269-282. DOI:10.4491/eer.2005.10.6.269 |
| [21] |
V.K. Sharma, M. Sohn, G.A. Anquandah, N. Nesnas, Chemosphere 87 (2012) 644-648. DOI:10.1016/j.chemosphere.2012.01.019 |
| [22] |
V.K. Sharma, Coord. Chem. Rev. 257 (2013) 495-510. DOI:10.1016/j.ccr.2012.04.014 |
| [23] |
J. Xue, Z. Zhu, Y. Zong, C. Huang, M. Wang, ACS Omega 4 (2019) 9467-9472. DOI:10.1021/acsomega.9b01012 |
| [24] |
D. Xia, C. He, L. Zhu, et al., J. Environ. Monitor. 13 (2011) 864-870. DOI:10.1039/c0em00647e |
| [25] |
Y. Liu, J. Zhang, F. Xie, et al., Chem. Eng. Res. Des. 111 (2016) 196-203. DOI:10.1016/j.cherd.2016.05.002 |
| [26] |
L. Mohajeri, H.A. Aziz, M.H. Isa, M.A. Zahed, Bioresour. Technol. 101 (2010) 893-900. DOI:10.1016/j.biortech.2009.09.013 |
| [27] |
R. Davarnejad, S. Nasiri, Environ. Pollut. 223 (2017) 1-10. DOI:10.1016/j.envpol.2016.11.008 |
| [28] |
R. Davarnejad, M. Mohammadi, A.F. Ismail, J. Water. Process. Eng. 3 (2014) 18-25. DOI:10.1016/j.jwpe.2014.08.002 |
| [29] |
P. Zhang, M. Akobi, A. Khattab, Compos. Part B: Eng. 168 (2019) 129-139. DOI:10.1016/j.compositesb.2018.12.048 |
| [30] |
R. Sakthivel, K. Ramesh, S. Joseph, John Marshal, K.K. Sadasivuni, Renew. Energy 136 (2019) 91-103. DOI:10.1016/j.renene.2018.12.109 |
| [31] |
Y. Wu, S. Zhou, F. Qin, X. Ye, K. Zheng, J. Hazard. Mater. 180 (2010) 456-465. DOI:10.2478/s11535-010-0027-z |