 2021, Vol. 32


b Beijing Advanced Innovation Center for Soft Matter Science and Engineering, Beijing University of Chemical Technology, Beijing 100029, China
Proton exchange membrane fuel cells (PEMFC) have been regarded as one of the promising technologies for both vehicular and stationary power sources owing to their high energy efficiency, fast start capability, and environmental friendliness [1-7]. Over the past years, significant progresses have been achieved towards reducing the cost and improving the performance of membrane electrode assemblies (MEAs) target required for the vehicle application of PEMFCs. However, the lifetime, identified as one of the prime issues in PEMFCs technology, still hinders their commercialization in electrical vehicles [8-10]. Specifically, the lifetime of PEMFCs power system is generally below the 5000 h target under the practical operating condition for the vehicle application especially at low Pt loading.
Previously reported works have indicated that the harsh operating conditions in fuel cells, including idling [11, 12], start-up/shut-down [13-16], load-cycling [17-19] and freeze/thaw [20, 21] in automotive application, significantly affect the durability of the key components in fuel cells and thus their performance, making the lifetime target a tough challenge for the application of PEMFC technologies. Among them, the dynamic load-cycling operation is regarded as the one of the major factors for the performance degradation of PEMFCs, especially for the load variation between the idling and the working operation [22, 23]. Under the dynamic load-cycling operation, the cell voltage generally changes frequently in the range of 0.5−0.9 V that inevitably corrodes the Pt catalyst and thus leads to the decrease of fuel cell performance [24]. Tu et al. [23] conducted a load-cycling test on a PEMFC stack with a 330 cm2 active area under 10, 000 dynamic cycles between 25 and 600 mA/cm2, and the result shows a higher percentage of cell voltage decrease at 600 mA/cm2 than that of 25 mA/cm2. Yang et al. [25] investigated the durability of a 1.9 kW PEMFC stack under a rapidly continuous load-cycling operation at a low hydrogen stoichiometric ratio, and found an obvious performance degradation after 244 h test. In Wang et al.'s work [26], a 900 h durability test of a commercial MEA was performed to simulate the start-up/shut-down, idling and load-cycling operation in PEMFC vehicles. After 900 h accelerating life test, the performance decreases with a rate of approximately 70 μV/h at a current density of 500 mA/cm2. These above works have investigated the correlation of cell performance loss with the dynamic operation model. To ensure the PEMFC power system as durable as the internal combustion engine, the degradation behavior of a PEMFC and its degradation mechanism of key materials still need to be specifically unraveled, especially under the load-cycling operation with different load amplitude.
In this work, the degradation behavior of a single PEMFC was investigated under a simulated automotive dynamic condition, and the effect of the load amplitude on its performance degradation was elucidated. A single PEMFC (active area: 5 cm2) was operated under the load-cycling condition with the current density cycling in the range of 0.1–0.9 A/cm2 (0.8 A/cm2 amplitude) and 0.1−0.3 A/cm2 (0.2 A/cm2 amplitude), respectively. The selection of current density range is aiming to simulate the practical vehicle operation of fuel cells from the idling to the working conditions. The current density of 0.1 A/cm2 operation represents the idling condition, while 0.9 and 0.3 A/cm2 means that fuel cells work at high and low load condition, respectively. Results show that a higher amplitude load-cycling operation leads to a higher percentage of performance loss, showing a larger increase extent of mass transfer resistance. The higher percentage loss is due to the more serious degradation of cathodic catalyst layer with the microstructure change and Pt catalyst decay.
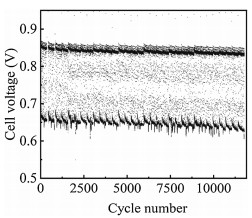
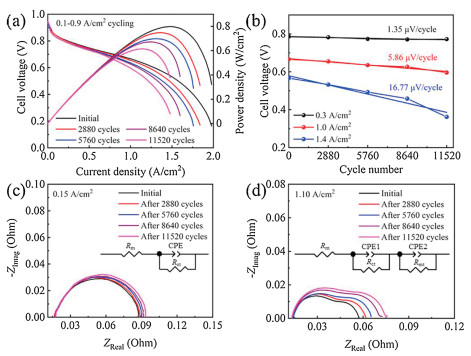
For the accelerating test, the degradation behavior of a PEMFC under the higher amplitude load-cycling operation was first investigated (load amplitude: 0.8 A/cm2, corresponding current density variation between 0.1 and 0.9 A/cm2) with the changing time of 1 s (each load lasts for 4 s) (Fig. S1 in Supporting information). Fig. 1 shows the cell voltage variation versus the cycle numbers under 0.1−0.9 A/cm2 load-cycling test. The cell voltage fluctuates in the range of 0.68−0.85 V for the load-cycling operation and both decreases after 11, 520 cycles no matter at the current density of 0.1 or 0.9 A/cm2. Polarization curves show that the cell performance declines evidently with the increase of cycle numbers (Fig. 2a), which is mainly related to the loss of three types of polarization, including the electrode kinetic loss, ohmic loss and mass transfer loss. The initial cell voltage is 0.666 V at a current density of 1.0 A/cm2. After 11, 520 cycles, the cell voltage drops to 0.596 V with an approximate loss of 10.5% that represents the end of durability test for fuel cell in vehicle application [27]. The performance loss is probably ascribed to the reduced Pt reactive sites during the load-cycling test due to the frequent potential fluctuation. The cell voltage degradation rate was calculated to be 1.35, 5.86 and 16.77 μV/cycle at the current densities of 0.3, 1.0 and 1.4 A/cm2, respectively (Fig. 2b). It is noted that the performance degradation rate gradually rises with the increase of current densities, showing an approximate linear relation with the cycle numbers. The more prominent performance loss at 1.4 A/cm2 reveals that Pt sites in the catalyst layer might not be able to provide an adequate number of reactive sites to catalyze the electrocatalytic reaction under such high current density, especially for the oxygen reduction reaction. Furthermore, the decreased performance is also probably related to the microstructure change in the catalyst layer during the load-cycling operation, which might hinder the effective mass transfer for the electrocatalytic reaction.

|
Download:
|
| Fig. 1. Cell voltage variation under 0.1–0.9 A/cm2 load-cycling test. | |

|
Download:
|
| Fig. 2. (a) Polarization curves before and after load-cycling test and (b) cell voltage versus cycle numbers at different current densities. Nyquist plots at (c) 0.15 and (d) 1.10 A/cm2 under load-cycling operation (Rm: ohmic resistance, Rct: charge transfer resistance, Rmt: mass transfer resistance, CPE: constant phase angle element). | |
To further elucidate the degradation behavior under dynamic load-cycling test, electrochemical impedance spectroscopy (EIS) characterization was carried out to determine the three types of polarization loss by measuring the charge transfer resistance, ohmic resistance, and mass transfer resistance, respectively (Figs. 2c and d). The membrane resistance and charge transfer resistance can be obtained by fitting the Nyquist plots at the low current density (0.15 A/cm2) [28, 29]. As shown in Fig. 2c, a negligible change was observed for the membrane resistance during the load-cycling test, indicating that no obvious degradation occurs for the proton exchange membrane. The charge transfer resistance was found to be increased with the rise of cycle numbers, 71.49, 72.72, 73.74, 75.45 and 77.07 mOhm after 0, 2880, 5760, 8640 and 11, 520 cycles, respectively. It reveals the decrease of apparent catalytic activity during the load-cycling test, probably due to the gradual loss of Pt reactive sites with the increase of cycle numbers [22, 30]. To determine the mass transfer resistance, the EIS measurement was also performed under a high current density (1.1 A/cm2) [31] (Fig. 2d). EIS fitting results show that the mass transfer resistance increases by 66.35% after 11, 520 cycles, rather higher than that of the change in charge transfer resistance (7.81%). Clearly, the increase in mass transfer resistance is more remarkable than that of the charge transfer resistance, indicating that the load-cycling operation leads to a prominent increase of mass transfer resistance.
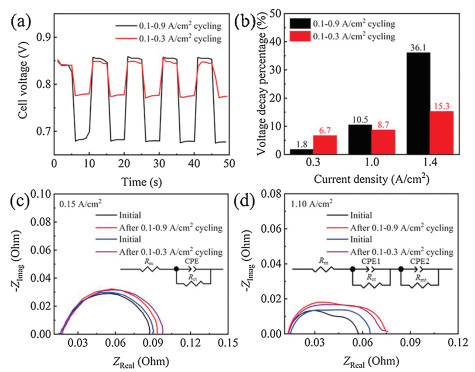
To illustrate the effect of load amplitude on performance degradation, we also conducted the dynamic load-cycling test under the low load amplitude operation (0.2 A/cm2) with the corresponding current density range of 0.1−0.3 A/cm2. Fig. 3a shows the cell voltage variation range is 0.84−0.78 V for 0.1−0.3 A/cm2 load-cycling operation, which is narrower than that of 0.1−0.9 A/cm2 cycling test (0.85−0.68 V). The voltage decrease percentage was also calculated according to the polarization curves, and the result shows that the decrease percentage of cell voltage both rises with the increase of current density no matter under low or high load amplitude cycles (Fig. 3b). Notably, the decrease extent of cell voltage at the current density of 1.0 and 1.4 A/cm2 was calculated to be higher for 0.8 A/cm2 amplitude operation than that of 0.2 A/cm2, implying that the performance decay at 1.0 and 1.4 A/cm2 is more server under the higher load amplitude test condition. However, the cell voltage at the current density of 0.3 A/cm2 decreases with a slightly higher percentage for the 0.2 A/cm2 amplitude than that of 0.8 A/cm2, which suggests that the electrode kinetic loss under the low amplitude operation is probably larger. EIS fitting results show that no obvious change of membrane resistance was observed, indicating that both two ranges of load vibration do not lead to the degradation of the proton exchange membrane (Figs. 3c and d). The increase extent of charge transfer resistance under the 0.8 A/cm2 amplitude operation is slightly lower than that of 0.2 A/cm2 amplitude, consistent with the performance decrease percentage as indicated as the polarization curve analyses. For the mass transfer resistance, an approximately 2-fold increase extent was observed after 11, 520 cycles for the 0.8 A/cm2 amplitude operation (~66.35%) compared to that of 0.2 A/cm2 amplitude (~31.63%), which consequently results in a larger mass transfer loss during the high amplitude load-cycling operation. It is speculated that the microstructure change of catalyst layer is more prominently under the wider range of load-cycling condition, probably due to the degradation of Pt catalyst.

|
Download:
|
| Fig. 3. (a) Cell voltage responses under two different load amplitudes operation and (b) the performance decay percentage at the current density of 0.3, 1.0, and 1.4 A/cm2. Nyquist plots at the current density of (c) 0.15 and (d) 1.10 A/cm2. | |
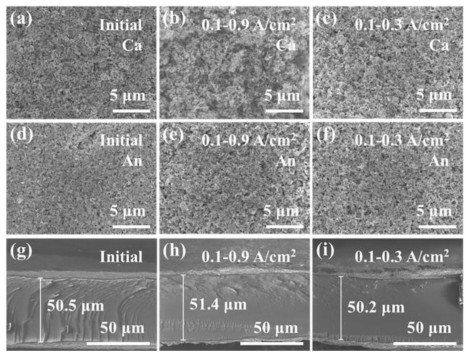
To examine the underlying degradation characteristics of the MEA under dynamic load-cycling test, ex-characterizations including scanning electron microscopy (SEM), transmission electron microscopy (TEM), and X-ray photoelectric spectroscopy (XPS) were conducted for the catalyst layer before and after 11, 520 cycles test. SEM images show that the initial catalyst layer has a relatively smooth surface distributed with Pt/C catalyst for both anode and cathode (Figs. 4a and d). After 11, 520 cycles, the surface of cathodic catalyst layer becomes rougher for the sample that operated under the high amplitude (0.8 A/cm2) load-cycling test compared to the low amplitude operation (0.2 A/cm2) (Figs. 4b and c). More collapsed pores appeared in most regions of the cathodic catalyst layer, especially for the sample operated at high amplitude condition, suggesting that the carbon structure in the catalytic layer was probably corroded. It reveals that the dynamic load-cycling has a negative effect on the cathodic catalyst layer. However, for the anodic catalyst layer, small changes were observed after 11, 520 load cycles for both high and low amplitude test (Figs. 4e and f), implying that the anodic catalyst layer is basically not affected by the load-cycling operation due to the low potential. SEM cross-sectional images display that the thickness of proton exchange membranes is in the range of 50.2–51.4 μm without any obvious pinholes on the surface after load-cycling test (Figs. 4g–i), suggesting no significant degradation occurred for the membrane, which is in agreement with the EIS result.

|
Download:
|
| Fig. 4. SEM images of the (a) cathodic and (d) anodic catalyst layer surface and (g) SEM cross-sectional images before the load-cycling test, and the corresponding images after 11, 520 load cycles under different load range of (b, e, h) 0.1–0.9 and (c, f, i) 0.1–0.3 A/cm2 test. | |
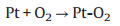
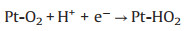
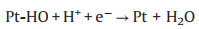
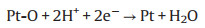
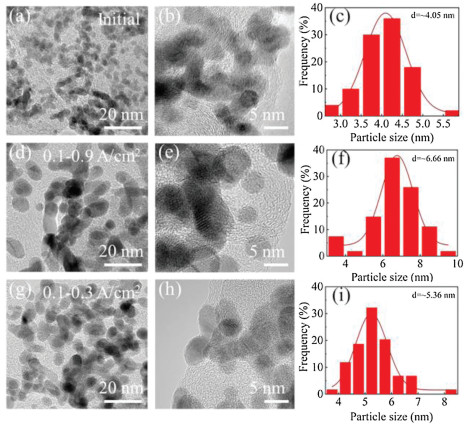
TEM characterization was performed to further explore the microstructure change of cathodic catalyst layer before and after load-cycling test (Fig. 5). As shown in Fig. 5a, the initial Pt nanoparticles (NPs) are uniformly distributed on the carbon support with a small average particle size of ~4.05 nm, and most of Pt NPs are spherical. After 11, 520 cycles, the Pt NPs in the cathodic catalyst layer grow significantly with an obvious aggregation, and thus their initial sphere morphology appears to be irregular. Further investigations show that the Pt NPs grow faster during a higher amplitude load-cycling test after 11, 520 cycles, with the average Pt diameter of 6.66 and 5.36 nm for 0.8 and 0.2 A/cm2 amplitude test, respectively. This result reveals that a more serious degradation of the cathodic Pt catalyst occurs under the higher amplitude load-cycling test. The major reason is that the corresponding potential variation range is wider for 0.8 A/cm2 amplitude load operation than that of 0.2 A/cm2. Under circumstance of the frequently wider potential fluctuation (0.85−0.68 V), the Pt species tend to be oxidized and reduced repeatedly [9, 18]. The possible reaction mechanism is shown as follows (Eqs. 1-5) [32]:
|
(1) |
|
(2) |

|
(3) |
|
(4) |
|
(5) |

|
Download:
|
| Fig. 5. TEM images of cathodic Pt catalyst and corresponding Pt NPs distribution (a–c) before and after load-cycling test with the current density ranges of (d–f) 0.1–0.9 and (g–i) 0.1–0.3 A/cm2. | |
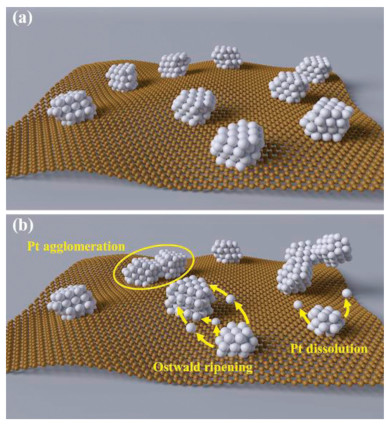
Subsequently, the small reduced Pt are dissolved and then redeposit on the surface of the large Pt NPs to reach a more stable state by reducing the interface energy of Pt NPs, leading to the growth of Pt NPs, that is, the called Ostwald ripening mechanism explains the enlarged particle size phenomenon (Fig. 6) [33, 34]. The growth of particle size will lead to the decrease of electrochemical surface area and ultimately result in a decline in the electrocatalytic activity and thus the fuel cell performance. Besides, the potential cycling also causes the corrosion of the carbon support because that carbon corrosion tends to occur at high potential through the electrochemical oxidation, although this phenomenon is not distinct under the load-cycling condition.

|
Download:
|
| Fig. 6. The degradation mechanism of Pt/C catalyst under load cycling operation. Illustration schemes of the Pt/C catalyst (a) before and (b) after load-cycling test. | |
XPS analysis was performed to quantify the change of surface element composition and content on cathodic catalyst layer (Fig. S2 in Supporting information). XPS spectra show the presence of C, Pt, F, S and O on the surface of cathodic catalyst layer for both before and after 11, 520 cycles test. Notably, the surface Pt content decreases after the load cycling test (1.96 and 2.31 at% for 0.8 and 0.2 A/cm2 amplitude, respectively) compare with the initial sample (initial Pt content: 4.75 at%), indicating the dissolution of Pt element no matter under low or high load amplitude cycles. Previously reported works have indicated that the potential cycling operation results in a higher extent of Pt dissolution compare with that of the steady-state operation [32]. It should be mentioned that the decrease percentage of Pt content was found to be substantially higher after 11, 520 cycles test for the sample under higher load amplitude cycles (58.7% and 51.4% for 0.8 and 0.2 A/cm2 amplitude, respectively), suggesting that the dissolution of Pt is more serious under higher amplitude operation. For the C element, the content (initial: 49.05 at%) obviously decreases after 11, 520 cycles test (43.58 and 43.61 at% for 0.8 and 0.2 A/cm2 amplitude, respectively), implying that the carbon support corrosion probably occurs and the Pt NPs are subsequently detached from the carbon surface. XPS results combined with above SEM and TEM analyses reveal that Pt species in the cathodic catalyst layer tend to be dissolved, migrated/redeposited and agglomerated to form the large Pt NPs during the accelerating test, leading to the loss of Pt electrochemical active surface area. Furthermore, the catalyst layer was also corroded with more collapsed pores on its surface that results in a poor mass transport path for the cathodic electrocatalytic process.
In summary, the degradation behavior of a single PEMFC under a simulated automotive load-cycling operation was investigated. Two different load amplitude of 0.8 and 0.2 A/cm2 were adopted to simulate the dynamic cycling operation between the idling and the working condition, and its effect on cell performance and its key materials were also explored. Results show that the 0.8 A/cm2 amplitude cycling operation leads to a higher percentage performance loss than that of 0.2 A/cm2 amplitude cycling. The cell performance decays with a rate of ~5.86 μV/cycle at a current density of 1.0 A/cm2 under 0.8 A/cm2 amplitude test, equivalent to a maximum total voltage loss of 70 mV after 11, 520 cycles. Physicochemical characterizations indicate that the cathodic catalyst layer degradation is the decisive factor for the durability deterioration of PEMFC, showing a faster growth of Pt NPs with accelerated dissolution and aggregation under the higher amplitude load-cycling operation because of the wider vibration of potential. Furthermore, the microstructure change of the cathodic catalyst layer also affects the durability of PEMFC, resulting in a higher increase extent of mass transfer resistance. The proposed degradation mechanism in this work holds the promise for providing valuable guidance for the migration strategies to improve the durability of PEMFCs.
Declaration of competing interestThe authors declare that they have no known competing financial interests or personal relationships that could have appeared to influence the work reported in this paper.
AcknowledgmentThis work was supported by the National Key R & D Program of China (No. 2018YFB0105503).
Appendix A. Supplementary dataSupplementary material related to this article can be found, in the online version, at doi:https://doi.org/10.1016/j.cclet.2021.02.045.
| [1] |
C. Wang, Z.Q. Mao, F.Y. Bao, X.G. Li, X.F. Xie, Int. J. Hydrogen Energy 30 (2005) 1031-1034. DOI:10.1016/j.ijhydene.2004.11.010 |
| [2] |
C. Pan, R. He, Q. Li, et al., J. Power Sources 145 (2005) 392-398. DOI:10.1016/j.jpowsour.2005.02.056 |
| [3] |
J. Hana, S.M. Leea, H. Chang, J. Power Sources 112 (2002) 484-490. DOI:10.1016/S0378-7753(02)00440-8 |
| [4] |
G. Mikhail, D. Ibrahim, A.R. Marc, Int. J. Hydrogen Energy 31 (2006) 337-352. DOI:10.1016/j.ijhydene.2005.10.004 |
| [5] |
C. Bernay, M. Marchand, M. Cassir, J. Power Sources 108 (2002) 139-152. DOI:10.1016/S0378-7753(02)00029-0 |
| [6] |
M. Chandesris, L. Guetaz, P. Schott, M. Scohy, S. Escribano, J. Electrochem. Soc. 165 (2018) F3290-F3306. DOI:10.1149/2.0321806jes |
| [7] |
R. Borup, J. Meyers, B. Pivovar, et al., Chem. Rev. 107 (2007) 3904-3951. DOI:10.1021/cr050182l |
| [8] |
N.L. Garland, T.G. Benjamin, J.P. Kopasz, ECS Trans. 11 (2007) 923-931. |
| [9] |
J. Wu, X.Z. Yuan, J.J. Martin, et al., J. Power Sources 184 (2008) 104-119. DOI:10.1016/j.jpowsour.2008.06.006 |
| [10] |
Kang Jungtak, J. Kim, Int. J. Hydrogen Energy 35 (2010) 13125-13130. DOI:10.1016/j.ijhydene.2010.04.077 |
| [11] |
J. Wu, X. Yuan, J. Martin, et al., J. Power Sources 195 (2010) 1171-1176. DOI:10.1016/j.jpowsour.2009.08.095 |
| [12] |
X. Yuan, R. Zhang, R. Wang, et al., J. Power Sources 195 (2010) 7594-7599. DOI:10.1016/j.jpowsour.2010.06.023 |
| [13] |
T. Zhang, P. Wang, H. Chen, P. Pei, Appl. Energy 223 (2018) 249-262. DOI:10.1016/j.apenergy.2018.04.049 |
| [14] |
T. Mittermeier, A. Weiß, F. Hasché, G. Hübner, H.A. Gasteiger, J. Electrochem. Soc. 164 (2017) F127-F137. DOI:10.1149/2.1061702jes |
| [15] |
J.E. Owejan, T.Y. Paul, R. Makharia, ECS Trans. 11 (2007) 1049-1057. |
| [16] |
R. Lin, X. Cui, J. Shan, et al., Int. J Hydrogen Energy 40 (2015) 14952-14962. DOI:10.1016/j.ijhydene.2015.09.042 |
| [17] |
G.S. Harzer, J.N. Schwämmlein, A.M. Damjanović, et al., J. Electrochem. Soc. 165 (2018) F3118-F3131. DOI:10.1149/2.0161806jes |
| [18] |
H. Zhang, H. Haas, J. Hu, et al., J. Electrochem. Soc. 160 (2013) F840-F847. DOI:10.1149/2.083308jes |
| [19] |
D. Garcia-Sanchez, T. Morawietz, Da Rocha, et al., Appl. Energy 259 (2020) 14210. |
| [20] |
M. Oszcipok, D. Riemann, U. Kronenwett, M. Kreideweis, M. Zedda, J. Power Sources 145 (2005) 407-415. DOI:10.1016/j.jpowsour.2005.02.058 |
| [21] |
S.C. Sun, H.M. Yu, J.B. Hou, et al., J. Power Sources 177 (2008) 137-141. DOI:10.1016/j.jpowsour.2007.11.012 |
| [22] |
P. Pei, Q. Chang, T. Tang, Int. J. Hydrogen Energy 33 (2008) 3829-3836. DOI:10.1016/j.ijhydene.2008.04.048 |
| [23] |
G. Wang, F. Huang, Y. Yu, S. Wen, Z. Tu, Int. J. Hydrogen Energy 43 (2018) 4471-4481. DOI:10.1016/j.ijhydene.2018.01.020 |
| [24] |
Q. Shen, M. Hou, X. Yan, et al., J. Power Sources 179 (2008) 292-296. DOI:10.1016/j.jpowsour.2007.12.049 |
| [25] |
J. Huang, D. Yang, F. Chang, J. Ma, J. Chem. Eng. Chin. Univ. 29 (2015) 1364-1370. |
| [26] |
C. Wang, Q. Zhao, X. Zhou, et al., Int. J. Green Energy 16 (2019) 789-795. DOI:10.1080/15435075.2019.1641712 |
| [27] |
H. Chen, P. Pei, M. Song, Appl. Energy 142 (2015) 154-163. DOI:10.1016/j.apenergy.2014.12.062 |
| [28] |
J. Mainka, G. Maranzana, J. Dillet, et al., J. Power Sources 253 (2014) 381-391. DOI:10.1016/j.jpowsour.2013.12.064 |
| [29] |
S. Mohammad, R. Niya, M. Hoorfar, Electrochim. Acta 120 (2014) 193-203. DOI:10.1016/j.electacta.2013.12.083 |
| [30] |
R. Lin, B. Li, Y.P. Hou, et al., Int. J. Hydrogen Energy 34 (2009) 2369-2376. DOI:10.1016/j.ijhydene.2008.10.054 |
| [31] |
M. Chandesris, C. Robin, M. Gerard, Y. Bultel, Electrochim. Acta 180 (2015) 581-590. DOI:10.1016/j.electacta.2015.08.089 |
| [32] |
T. Tian, J. Tang, W. Guo, et al., Front. Energy 11 (2017) 326-333. DOI:10.1007/s11708-017-0489-z |
| [33] |
R.M. Darling, J.P. Meyers, J. Electrochem. Soc. 152 (2005) A242-A247. DOI:10.1149/1.1836156 |
| [34] |
P.J. Ferreira, G.J. la O', Y. Shao-Horn, et al., J. Electrochem. Soc. 152 (2005) A2256-A2271. DOI:10.1149/1.2050347 |