 2021, Vol. 32


b Department of Chemical Engineering, School of Environmental and Chemical Engineering, Shanghai University, Shanghai 200444, China
Various renewable and clean energy sources, such as solar and wind, are growing rapidly due to the imminent depletion of non-renewable fossil fuel resources and the increasingly serious environmental pollution problems [1, 2]. However, electric energy generated by renewable energy sources cannot be directly transmitted to the grid due to its intermittent characteristics [3]. It is urgent to develop an energy storage device with high capacity. SIBs are considered to be the promising electric energy storage (EES) systems in the field of energy storage power stations due to their rich sodium resources, low cost and electrochemical behavior similar to LIBs [4-6]. The key to commercialization of SIBs is to find electrode materials with low cost and high specific capacity [7]. Nowadays, many SIBs anode materials have been developed, including hard carbon, transition metal oxides and intermetallic compounds [4]. However, the drawbacks of these materials are noticeable. For example, the drawback of hard carbon lies in low electronic conductivity and poor initial coulombic efficiency [8-10]. The transition metal oxides and intermetallic suffer massive volume changes during the reaction with the Na+ ions, and some of them are expensive or toxic [11-16]. Therefore, it is imperative to develop new types of SIBs anode materials with high specific capacity, low cost, simple synthesis process and ecological friendliness.
Metal borates have attracted more and more attention as a promising anode for SIBs in the past few years owing to their low atomic weight and high electronegative features [ 17-19]. To date, metal borates have been used as anode materials for sodium-ion batteries, but its sodium storage mechanism is still unclear [20-22]. Recently, Tian et al. evaluated the electrochemical performance of Fe3BO6 as a SIBs anode material and further explored its sodium storage mechanism [23]. Based on the ex-situ XRD analysis results, they reported that Fe3BO6 irreversibly transformed into crystalline Fe2O3 and then into crystalline Fe metal during the initial discharge process. In the subsequent charge and discharge process, crystalline Fe metal and crystalline Fe2O3 alternately appear. Namely, the sodium storage mechanism of Fe3BO6 is a conversion reaction between crystalline Fe2O3 (Fe3+) and crystalline Fe metal (Fe0). Wang et al. proposed the reversible conversion reaction mechanism of Zn3B2O6 (crystalline) with sodium ion via air-insulated ex-situ characterizations: Zn3B2O6 (amorphous) + 6Na+ + 6e− ⇋ 3Zn (amorphous) + B2O3∙3Na2O [18]. According to the ex-situ characterization results, Zn3B2O6 was reversibly transformed into amorphous Zn metal during the first discharge, and amorphous Zn3B2O6 was formed in the subsequent charging process. Although some metal borate materials have been studied, there is no consensus on their sodium storage mechanism. Therefore, it is necessary to determine the sodium storage mechanism of metal borate and develop new metal borate materials.
In this work, a low-cost and environmentally friendly FeBO3 was prepared and evaluated as anode for SIBs for the first time. Electrochemical test results show that the FeBO3 electrode has an initial capacity of 684 mAh/g (at 0.4 A/g) and a reversible capacity of 328 mAh/g. Besides, the phase evolution of FeBO3 during charging and discharging process was revealed by in-situ XRD analysis. And the changes in the chemical composition of FeBO3 in the sodiation/desodiation process were monitored by an air-insulated ex-situ XPS. Based on the in-situ XRD and ex-situ analysis, a new metal borate sodium storage mechanism was proposed.
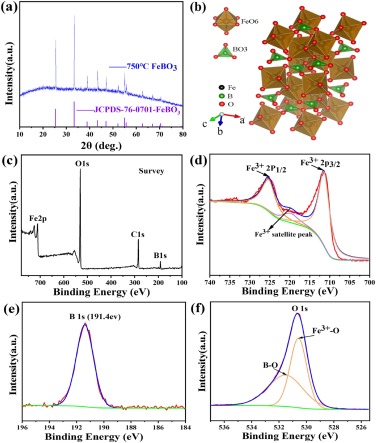
As shown in Fig. 1a, all peaks of the XRD pattern of the sintered product are well indexed with the hexagonal crystal FeBO3 (JCPDS No. 76-0701), which is composed of FeO6 octahedrons and BO3 plane triangles (Fig. 1b), indicating that a pure phase material was synthesized. The chemical composition and element valence of the FeBO3 material were measured by XPS. It can be proved from the survey spectrum that Fe, B and O elements exist in FeBO3 material (Fig. 1c). XPS spectrum for Fe 2 p consists of two peaks at 711.4 eV and 725.3 eV, and a satellite peak at 719.8 eV, which is characteristic of Fe3+ (Fig. 1d) [24, 25]. As shown in Fig. 1e, there is a strong peak at 191.4 eV, which is the characteristic peak of B 1s [26, 27]. As for the O 1s peak, it can be divided into two peaks at 530.5 and 531.5 eV, which are attributed to Fe-O and B-O of FeBO3, respectively (Fig. 1f) [28, 29].

|
Download:
|
| Fig. 1. (a) XRD patterns of the FeBO3. (b) Crystal model of the FeBO3. (c) XPS survey spectrum of FeBO3. (d) Fe 2 p spectrum of FeBO3. (e) B 1s spectrum of FeBO3. (f) O 1s spectrum of FeBO3. | |
The morphology and detailed crystal structure information of FeBO3 were explored through advanced FE-SEM and TEM. As shown in Figs. 2a and b, the morphology of FeBO3 is a particle with a size of 50 − 300 nm. Further, the size of FeBO3 particles is confirmed by the TEM image (Fig. 2c). In addition, the HRTEM image exhibits a 0.35 nm d-spacing, which is attributed to the (012) plane of FeBO3 and agrees well with the XRD result (Fig. 2d). Moreover, the elemental mapping images (Fig. 2e) reveal the uniform distribution of Fe, B and O all over the single FeBO3 particle.

|
Download:
|
| Fig. 2. (a) SEM image of FeBO3. (b) Particle size distribution chart of FeBO3. (c) TEM image of FeBO3. (d) HRTEM image of FeBO3. (e) Mapping images of FeBO3. | |
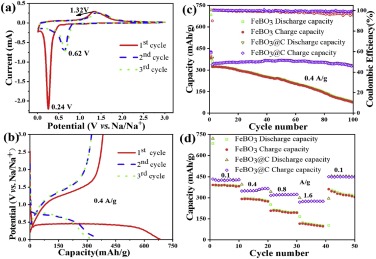
The CV curves for the FeBO3 electrode are measured at scan rate of 0.1 mV/s between 0.01 V and 3.0 V (Fig. 3a). A sharp and intense reduction peak appeared at 0.24 V during the first cathodic scan and then shifted to 0.62 V in the following scans. During the anodic polarization process, one peak is observed at 1.32 V, and no obvious difference is noticed in the subsequent cycles. The result indicates that the FeBO3 undergoes irreversible reaction during the first cathodic process and then keeps stable in the following cycles. The initial discharge profile shows a plateau at about 0.4 V, and the plateau shifted to 0.76 V in the subsequent cycles (Fig. 3b). This result is in agreement with the CV curves. In the case of cycle performance, the initial discharge/charge specific capacity of the FeBO3 electrode is 684/382 mAh/g, while the capacity decays to 78/74 mAh/g in the 100th cycle (Fig. 3c). The rate performance of the FeBO3 electrode is shown in Fig. 3d. The FeBO3 electrode exhibits discharge capacities of 390, 291, 198 and 107 mAh/g at current densities of 0.1, 0.4, 0.8 and 1.6 A/g, respectively. The FeBO3 has obvious capacity decay upon cycling. So it is necessary to improve its cycle stability.

|
Download:
|
| Fig. 3. (a) The initial three cycle CV curves for the FeBO3 electrode at 0.1 mV/s. (b) GCD curves of the FeBO3 electrode (0.4 A/g). (c) Cycle performance and corresponding CE of the FeBO3 and FeBO3@C electrodes. (d) Rate performance of the FeBO3 and FeBO3@C electrodes. | |
Carbon coating has proven to be very effective in improving cycle stability [30-32]. Most metal borates are synthesized in air at a temperature of > 800 ℃. Under these conditions, carbon would be oxidized to carbon dioxide and escape. If calcined in an inert gas, the pyrolysis of the carbon source would create a reducing atmosphere, which can change the valence state of the transition metal in the metal borate or even destroy the crystal structure. As a cheap and non-toxic raw material, oleic acid has a carboxyl group that can produce a strong bond with metal ions, so it is suitable as a carbon source for coating [33]. In addition, transition metals can catalyze the graphitization rate of oleic carbon during the sintering process and oleic carbon with good conductivity can be obtained even at low temperatures [34]. Therefore, oleic acid was used as carbon source for preparing carbon-coated FeBO3 (FeBO3@C). The structure of the FeBO3@C material remains unchanged after heat treatment at 500 ℃ (Fig. S1 in Supporting information). As shown in Fig. 3c, the FeBO3@C shows a higher initial discharge/charge capacities of 719/426 mAh/g and a higher retained capacities of 332/331 mAh/g in the 100th cycle. In addition, the FeBO3@C displays discharge capacities of 425, 349, 321 and 272 mAh/g, at current densities of 0.1, 0.4, 0.8 and 1.6 A/g, respectively (Fig. 3d). Compared with FeBO3, the cycle performance and rate performance of FeBO3@C composite have been significantly improved.
In order to explore the reasons for the improved electrochemical performance, the EIS spectra of FeBO3 and FeBO3@C electrodes were measured. As shown in Figs. S2a and b (Supporting information), the Nyquist diagrams consist of two semicircles and a diagonal line, which can be described as solid electrolyte interface layer resistance (RSEI), charge transfer resistance (Rct), and Weber impedance. In addition, the Rct and RSEI data of FeBO3 and FeBO3@C calculated using the equivalent circuit (Figs. S2a and b inset) are shown in Table S1 (Supporting information). The values RSEI of FeBO3@C are lower than that of FeBO3 owing to the less sodium-ion consumption during the formation of the SEI process, which explains the high coulomb efficiency and less irreversible capacity of FeBO3@C in the first cycle [35]. Comparing the RSEI change from 50 cycles to 100 cycles, it can be seen that the RSEI rate of the FeBO3 electrode is much greater than that of FeBO3@C. This indicates that more SEI is continuously generated upon the FeBO3 electrode during the sodiation/desodiation process, resulting in low capacity and poor stability. Simultaneously, the Rct value of the FeBO3 electrode increased from 27.4 Ω to 23945.3 Ω, but the Rct value of the FeBO3@C electrode only increased from 17.3 Ω to 48.5 Ω. The results show that the carbon coating can reduce the charge transfer resistance. The improved cycle and rate performance of the FeBO3@C electrode composite can be ascribed to the enhancement in rapid charge transfer kinetics with the effect of C.
In addition, the reason for the improvement of electrode stability was studied by observing the evolution of the surface morphology for FeBO3 and FeBO3@C electrodes under different conditions. Both the fresh FeBO3 and FeBO3@C electrodes have smooth surface morphology (Figs. S3a and d in Supporting information). However, after 50 cycles, the FeBO3 electrode shows some cracks on the electrode surface (Fig. S3b in Supporting information), whereas the FeBO3@C electrode still maintains a crack-free surface (Fig. S3e in Supporting information). After continuous sodiation/desodiation for 100 cycles, the FeBO3@C electrode still shows a smooth surface, while the FeBO3 electrode shows a lot of pits and cracks (Figs. S3 c and f in Supporting information). The carbon coating with oleic acid as the carbon source can reduce the side reaction between the electrode and the electrolyte, thereby maintaining the stability of the electrode [36].
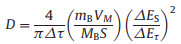
In order to evaluate whether carbon coating affects the reaction kinetics of FeBO3 anode materials, the galvanostatic intermittent titration technique (GITT) was used to determine the sodium ion diffusion coefficient (Fig. 4a and Fig. S4a in Supporting information). The diffusion coefficient can be calculated by Eq. 1 [37, 38]:
|
(1) |

|
Download:
|
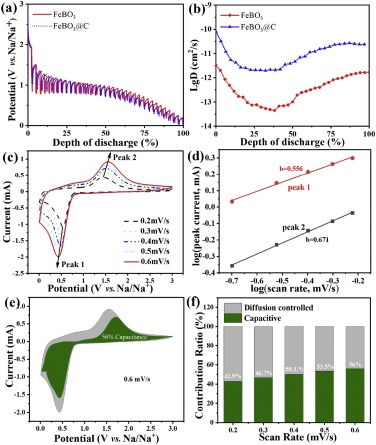
| Fig. 4. (a) GITT curve and (b) sodium ion diffusion coefficient of FeBO3 and FeBO3@C electrodes during the second discharge process. (c) CV curves for FeBO3 electrode at different sweep rates (0.2–0.6 mV/s). (d) The calculated b value of the cathodic and anodic peaks for FeBO3 electrode at 0.2–0.6 mV/s. (e) The green area represents the capacitance contribution at specific 0.6 mV/s of FeBO3 electrode. (f) The ratio of pseudocapacitive contribution for FeBO3 electrode at different sweep rates. | |
Where τ, mB, MB, VM, S, ΔES and ΔE correspond to relaxation time, active material mass, molar mass, molar volume, electrode/electrolyte contact area, voltage change caused by pulse and constant current charging (discharging), respectively. As shown in Fig. 4b and Fig. S4b (Supporting information), the calculated Na ion diffusion coefficient (DNa) of FeBO3@C is higher than that of the FeBO3 electrode. The reason for this result may be that carbon coating reduces the repetitive formation of the SEI film that hinders ion diffusion [39].
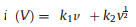
In addition, to explore the charge storage mechanism of FeBO3, pseudocapacitance analysis was performed through CV measurements at different sweep rates (0.2 − 0.6 mV/s) (Fig. 4c). The peak current (i) and sweep rate (V) of the CV curves follow the Eq. 2 below:

|
(2) |
where a, b are adjustable values [40]. Generally, b=0.5 corresponds to a diffusion control process, b=0.5–1 is a common control process of diffusion and capacitance, and b=1 corresponds to a capacitance control process [41]. The value of b can be obtained by Eq. 3 below:

|
(3) |
where b is the slope. As shown in Fig. 4d, the calculated b values for peak 1 and peak 2 are 0.556 and 0.671, which indicates that the kinetics of the charge storage process of the FeBO3 electrode is controlled by diffusion and capacitance. In addition, the capacitance contribution at a given scan rate can be determined according to Eq. 4:
|
(4) |
where k1v corresponds to the capacitance control contribution, and 
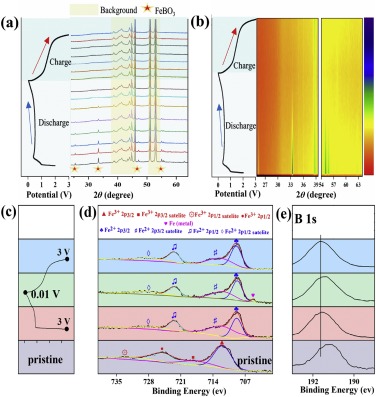
In-situ XRD test was performed to study the structural transformation and sodium ion storage mechanism of FeBO3 during the sodiation/desodiation process. The obtained in-situ XRD patterns and corresponding intensity contour maps are shown in Figs. 5a and b. For the pristine electrode, all peaks are indexed to FeBO3 with the hexagonal structure, except for the background peaks (Al foil, Be and BeO). Details information of the structural evolutions during cycling were monitored via the shifts/changes of selected characteristic peaks of 26°, 34°, 47° and 55° (Fig. 5a). The intensity of FeBO3 peaks decreased gradually with the initial discharge process. When the cell was discharged to ~0.46 V, FeBO3 peaks were fully disappeared and no peak reappearance was observed in the following charge process. This indicates that the crystalline FeBO3 transformed into an non-crystal (nc) phase during the first sodiation process.

|
Download:
|
| Fig. 5. (a) The first GCD curve of FeBO3 electrode and corresponding in-situ XRD patterns. (b) The first GCD curve of FeBO3 electrode and corresponding contour maps. (c) the second discharge charge curve. (d, e) ex-situ XPS Fe 2p and B 1s spectra at the pristine state and 2nd cycle of FeBO3 electrode. | |
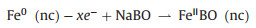
Since the FeBO3 electrode changes to the amorphous phase after the first discharge, it is difficult to determine the phase evolution during the cycle by comparing XRD patterns. Therefore, an ex-situ XPS test was performed to study the sodium ion storage mechanism of FeBO3 at fresh and different discharge/charge state in the second cycle. The results are shown in Figs. 5c and d. In the pristine state, the Fe 2 p peaks of the electrode appear at 711.5 and 725.3 eV with the two satellite peaks appear at 718.2 and 733.3 eV, which are characteristic peaks of Fe3+ [24, 25, 42]. When discharge to 0.01 V and then charge to 3 V, the characteristic peaks of Fe3+ does not appear. However, the Fe 2 p peaks of the electrode appear at 709 eV and 722.5 eV with the shaking satellite peaks appear at 713 eV and 729 eV, which indicates that the valence state of Fe is + 2 instead of + 3 (Fig. 5d). During the second sodiation process, Fe2+ partially transformed into Fe0, while the Fe0 can completely return to Fe2+ in the desodiation process, Fe2+ exist at all charging and discharging states. The results show that the electrode experienced a partially reversible process in the second cycle. The fine spectrum of B 1s was shown in Fig. 5e. It can be seen that the peak of B moves in the second cycle and finally returns to the 3 V state, indicating that boron participates in the reaction and the process is reversible. Based on the above in-situ XRD and ex-situ XPS test results, it can be concluded that the possible sodium storage mechanism of FeBO3 is:
The first cycle:
Discharge:

|
(5) |
Charge:
|
(6) |
The subsequent cycle:
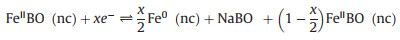
|
(7) |
In summary, FeBO3 was prepared and evaluated as a SIBs anode for the first time. The FeBO3 electrode showed a reversible capacity of 328 mAh/g at a current density of 0.4 A/g. The cycle stability and rate performance of FeBO3 were effectively improved by carbon coating. The prepared FeBO3@C composite had a reversible capacity of 426 mAh/g (at 0.4 A/g) and an outstanding rate capability of 272 mAh/g (1.6 A/g). The results of EIS and GITT show that carbon coating can improve electrochemical performance by reducing the generation of side reactions, avoiding the excessive formation of SEI films and improving charge transfer kinetics. Furthermore, in-situ XRD and ex-situ XPS analysis demonstrate that FeBO3 material transforms into an amorphous phase in the first sodiation/desodiation process. It was indicated that Fe3+ is irreversibly transformed into Fe2+. During the second sodiation process, Fe2+ partially transformed into Fe0, while the Fe0 can completely return to Fe2+ in the second desodiation process. The above results show that FeBO3 is a new potential anode material for SIBs.
Declaration of competing interestThe authors report no declarations of interest.
AcknowledgmentsThis work was supported by the National Natural Science Foundation of China (Nos. 21673136 and 22075173) and the Science and Technology Commission of Shanghai Municipality (No. 19DZ2271100).
Appendix A. Supplementary dataSupplementary material related to this article can be found, in the online version, at doi:https://doi.org/10.1016/j.cclet.2021.03.014.
| [1] |
H. Pan, Y.S. Hu, L.Q. Chen, et al., Energy Environ. Sci. 6 (2013) 2338-2360. DOI:10.1039/c3ee40847g |
| [2] |
H. Kang, Y. Liu, K. Cao, et al., J. Mater. Chem. A 3 (2015) 17899-17913. DOI:10.1039/C5TA03181H |
| [3] |
C. Delmas, Adv. Energy Mater. 8 (2018) 1703137. DOI:10.1002/aenm.201703137 |
| [4] |
M.D. Slater, D. Kim, E. Lee, et al., Adv. Funct. Mater. 23 (2013) 947-958. DOI:10.1002/adfm.201200691 |
| [5] |
Y. Fang, L. Xiao, Z. Chen, et al., Electro. Ener. Rev. 1 (2018) 294-323. DOI:10.1007/s41918-018-0008-x |
| [6] |
K. Chayambuka, G. Mulder, D.L. Danilov, et al., Adv. Funct. Mater. 8 (2018) 1800079. DOI:10.1002/aenm.201800079 |
| [7] |
J.Y. Hwang, S.T. Myung, Y.K. Sun, Chem. Soc. Rev. 46 (2017) 3529-3614. DOI:10.1039/C6CS00776G |
| [8] |
E. Irisarri, A. Ponrouch, M. Palacin, J. Electrochem. Soc. 162 (2015) A2476. DOI:10.1149/2.0091514jes |
| [9] |
M.-S. Balogun, Y. Luo, W. Qiu, et al., Carbon 98 (2016) 162-178. DOI:10.1016/j.carbon.2015.09.091 |
| [10] |
P. Lu, Y. Sun, H. Xiang, et al., Adv. Energy Mater. 8 (2018) 1702434. DOI:10.1002/aenm.201702434 |
| [11] |
Y. Jiang, M. Hu, D. Zhang, et al., Nano Energy 5 (2014) 60-66. DOI:10.1016/j.nanoen.2014.02.002 |
| [12] |
H. Su, S. Jaffer, H. Yu, Energy Storage Mater. 5 (2016) 116-131. DOI:10.1016/j.ensm.2016.06.005 |
| [13] |
M.K. Datta, R. Epur, P. Saha, et al., J. Power Sources 225 (2013) 316-322. DOI:10.1016/j.jpowsour.2012.10.014 |
| [14] |
Z. Li, J. Ding, D. Mitlin, Acc. Chem. Res. 48 (2015) 1657-1665. DOI:10.1021/acs.accounts.5b00114 |
| [15] |
L. Li, J. Zhao, Y. Zhu, et al., Electrochim. Acta 353 (2020) 136532. DOI:10.1016/j.electacta.2020.136532 |
| [16] |
Z. Zheng, P. Li, J. Huang, et al., J. Energy Chem. 41 (2020) 126-134. DOI:10.1016/j.jechem.2019.05.009 |
| [17] |
B. Xu, Y. Liu, J. Tian, et al., Chem. Eng. J. 363 (2019) 285-291. DOI:10.1016/j.cej.2019.01.089 |
| [18] |
S. Wang, X.B. Zhang, Adv. Mater. 31 (2019) e1805432. DOI:10.1002/adma.201805432 |
| [19] |
Q. Ping, B. Xu, X. Ma, et al., Dalton Trans. 48 (2019) 5741-5748. DOI:10.1039/c9dt00010k |
| [20] |
K. Zhou, G. Xu, Y. Chen, et al., Chem. Eng. J. 375 (2019) 121998. DOI:10.1016/j.cej.2019.121998 |
| [21] |
M. Dong, Q. Kuang, X. Zeng, et al., J. Alloys Compd. 812 (2020) 152165. DOI:10.1016/j.jallcom.2019.152165 |
| [22] |
D. Wu, Q. Kuang, Y. Zhao, et al., J. Alloys Compd. 732 (2018) 506-510. DOI:10.1016/j.jallcom.2017.10.254 |
| [23] |
J. Tian, B. Wang, F. Zhao, et al., Chem. Commun. 53 (2017) 4698-4701. DOI:10.1039/C7CC01612C |
| [24] |
K. Cao, L. Jiao, H. Liu, et al., Adv. Energy Mater. 5 (2015) 1401421. DOI:10.1002/aenm.201401421 |
| [25] |
S.H. Yu, D.E. Conte, S. Baek, et al., Adv. Funct. Mater. 23 (2013) 4293-4305. DOI:10.1002/adfm.201300190 |
| [26] |
R. Ge, X. Ren, F. Qu, et al., Chem. Eur. J. 23 (2017) 6959-6963. DOI:10.1002/chem.201700408 |
| [27] |
K. Dastafkan, Y. Li, Y. Zeng, et al., J. Mater. Chem. A 7 (2019) 15252-15261. DOI:10.1039/c9ta03346g |
| [28] |
H. Zhao, Y. Wang, Y. Wang, et al., Appl. Catal. B: Environ. 125 (2012) 120-127. DOI:10.1016/j.apcatb.2012.05.044 |
| [29] |
W.J. Jiang, S. Niu, T. Tang, et al., Angew. Chem. Int. Ed. 56 (2017) 6572-6577. DOI:10.1002/anie.201703183 |
| [30] |
H. Li, H. Zhou, Chem. Commun. 48 (2012) 1201-1217. DOI:10.1039/C1CC14764A |
| [31] |
X. Li, J. Li, Q. Gao, et al., Electrochim. Acta 254 (2017) 172-180. DOI:10.1016/j.electacta.2017.09.128 |
| [32] |
Y. Jiang, Z. Yang, W. Li, et al., Adv. Energy Mater. 5 (2015) 1402104. DOI:10.1002/aenm.201402104 |
| [33] |
X. Chen, C. Chen, Y. Zhang, et al., Nano Res. 12 (2018) 631-636. DOI:10.1109/AMC.2019.8371167 |
| [34] |
L. Chen, L. Huang, G. Chen, et al., Chemistry 26 (2020) 8926-8934. DOI:10.1002/chem.202000558 |
| [35] |
F. Kong, L. Lv, Y. Gu, et al., J. Mater. Sci. 54 (2018) 4225-4235. |
| [36] |
S. Zhao, K. Yan, P. Munroe, et al., Adv. Energy Mater. 9 (2019) 1803757. DOI:10.1002/aenm.201803757 |
| [37] |
D. Li, Y. Zhang, Q. Sun, et al., Energy Storage Mater. 23 (2019) 367-374. DOI:10.1016/j.ensm.2019.04.037 |
| [38] |
Z. Jian, Z. Xing, C. Bommier, et al., Adv. Energy Mater. 6 (2016) 1501874. DOI:10.1002/aenm.201501874 |
| [39] |
S.R. Das, S.B. Majumder, R.S. Katiyar, J. Power Sources 139 (2005) 261-268. DOI:10.1016/j.jpowsour.2004.06.056 |
| [40] |
V. Augustyn, J. Come, M.A. Lowe, et al., Nat Mater. 12 (2013) 518-522. DOI:10.1038/nmat3601 |
| [41] |
G. Fang, Z. Wu, J. Zhou, et al., Adv. Energy Mater. 8 (2018) 1703155. DOI:10.1002/aenm.201703155 |
| [42] |
M.C. Biesinger, B.P. Payne, A.P. Grosvenor, et al., Appl. Surf. Sci. 257 (2011) 2717-2730. DOI:10.1016/j.apsusc.2010.10.051 |