 2021, Vol. 32


b Research Center for Analytical Sciences, Department of Chemistry, College of Sciences, Northeastern University, Shenyang 110819, China
Glycosylation is one of the most common and essential protein post-translational modifications (PTM) in cells, containing a wealth of information related to cellular development and diseased statuses [1]. Glycoproteins have been proved to be abnormal expression in Alzheimer's disease, cancer and so on [2]. Some of glycoproteins in serum and/or tumor tissues are clinically used as biomarkers for cancer diagnosis, malignant development and prognostic assessment, including CEA (colon cancer) [3, 4]. MUC1(breast cancer), MUC16 (ovarian cancer) and prostate-specific antigen (PSA, prostate cancer) [5, 6]. Some of glycoproteins involve multiple cancers, such as CA19-9 [7]. Although the use of a single biomarker for the diagnosis and monitoring of disease progression is an attractive prospect, research shows that the whole glycome profile might be better than a single glycosylation pattern for the assessment of disease progression. Nevertheless, such multiple glycoprotein analysis methods rely on large instrument, i.e., matrix-assisted laser desorption ionization mass spectrometry (MALDI-MSI) [8], which is costly, time-consuming and require sophisticated instrumentation. Comparing with proteins, cancer cells have become newly more effective biomarkers for cancer diagnosis [9]. Therefore, the development of inexpensive, rapid, simple, accurate and high-throughput methods for identification of multiple glycoproteins and cell types is a meaningful research topic.
Array-based sensing approaches have been created and tuned to specific sensing challenges [10]. In recent years, a series of array-based sensing platforms have been used as alternative analytical tools for the identification of proteins [11-16] and cells [17-22]. However, it is still a great challenge to identify glycoproteins that have a class of proteins with similar PTM, due to the indiscernible signal difference from these protein species. Besides, total protein-driven sensing methods for identification of cancer cell types still have some disadvantages such as low sensitivity, because different cancer cells are often only associated with subtle changes in the expression level of a single or few protein molecular components. Considering that some glycoproteins have been clinically used as cancer biomarkers, we envisioned that glycoproteins could be potentially used as more representative components for cancer cell identification. Our group has developed an array sensing platform by exploiting pyrene-derived amphiphile/surfactant assemblies, for identification of eight glycoprotein species at a 50 nmol/L level [23]. However, this fingerprint-based glycoprotein-sensing system is based on micelle, limiting the operability and versatility of its applications, especially for cell analysis. To create simpler and more practical systems, it is desirable that the recognition elements themselves exhibit a selective turn-on response toward glycosylation events, and to generate distinct responses for each glycoprotein by cross-reactive receptors of sensor array.
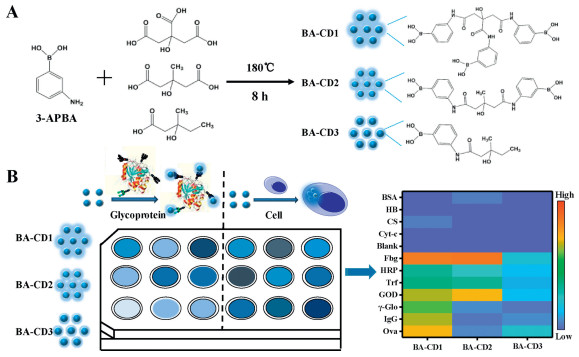
Herein, we developed three boronic acid-containing carbon dots (BA-CD1, BA-CD2, BA-CD3) as recognition elements to fabricate sensor array for identification of glycoproteins and cancer cells, as shown in Scheme 1. The BA-CDs can covalently interact with the cis-diols moiety of the glycoproteins to form a rigid structure aggregate, restricting intramolecular rotation and causing fluorescence signal to turn on. Due to the difference in the glycosylation content, molecular weight and other chemical composition of glycoproteins, the BA-CDs produced different aggregation degrees and aggregation-enhanced emission (AEE) responses. The map of discriminative fingerprints was gathered and can be recognized by linear discriminant analysis (LDA). Therefore, an effective identification of the glycoproteins can be achieved. Moreover, the proposed array could be applied in cell identification with several significant advantages of easy construction, low cost and simple procedure.

|
Download:
|
| Scheme 1. Scheme diagram of (A) one-step synthesis strategy for fabrication of BA-CDs, and (B) fluorescence sensor array based on three BA-CDs for identification of glycoproteins and cells. | |
The BA-CDs are synthesized through a one-pot solvothermal method at an optimum condition of 180 ℃ for 8 h, as shown in Scheme 1A. Under this situation, 3-aminophenylboronic acid is employed as boronic acid (B) doping sources, while citric acid (CA), 3-hydroxy-3-methylglutamate, and 3-hydroxy-3-methylpentanoic acid are used as variant precursors for modulating physicochemical properties of the BA-CDs. By changing the precursors, three BA-CDs are synthesized, namely BA-CD1, BA-CD2, and BA-CD3. The TEM images (Figs. S1A-C in Supporting information) revealed that the BA-CD1, BA-CD2, and BA-CD3 were spherical structure with the similar size of 3-6 nm, favorable uniformity, and well dispersed. The fluorescence and UV-vis spectra were shown in Figs. S1D-G (Supporting information), and the emission locations of three carbon dots were at 336, 420, and 374 nm, respectively [24]. The results of XPS spectra (Figs. S1H and S2A-F in Supporting information) and FT-IR spectra (Fig. S1I in Supporting information) confirmed boronic acid groups containing on the surface of BA-CDs during the process from precursors to final carbonization products at high temperature [25, 26]. ICP-MS measurements (Fig. S2G in Supporting information) and zeta potential analysis (Fig. S2H in Supporting information) indicated that different/diverse precursors of three BA-CDs resulted in variations of boronic element content (ICP-MS: 18.8%, 12.6%, 8.8%; XPS: 8.96%, 5.34%, 4.33%) [27, 28] and surface charge (-13.5 mV, -5.3 mV, and -15.4 mV). Diverse surface states of three BA-CDs were derived from different pH-dependent emission behaviors induced by protonation-deprotonation (Fig. S2I in Supporting information). Hence, three BA-CDs have different surface charge and boronic element content, facilitating them to be artificial receptors in a sensor array for target analysis.
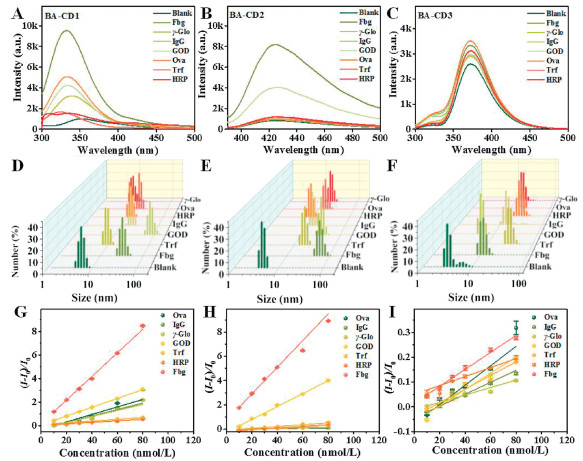
The fluorescence signal response of this sensor array against glycoprotein samples was investigated. Seven glycoproteins, including Ovalbumin (Ova), immunoglobulin (IgG), γ-Globulin (γ-Glo), glucose oxidase (GOD), fibrinogen (Fbg), transferrin (Trf), horseradish peroxidase (HRP), were employed with different carbohydrate contents (around 3%-18%), molecular weights (MW, around 40-340 kDa), and isoelectric points (pI, around 4.7-8) (Table S1 in Supporting information). The fluorescence spectrum of BA-CDs was significantly enhanced after interacting with seven glycoproteins (Figs. 1A-C). Dynamic light scattering data (Figs. 1D-F) revealed that BA-CDs and glycoproteins form a large of aggregates with diameter of 8~120 nm, due to the presence of the oligosaccharide and large molecular weight of the glycoproteins. Due to the larger saccharinity and molecular weight, the size and fluorescence response of aggregates of BA-CDs with GOD and Fbg are larger than other glycoproteins. The linear concentration range for the quantification of individual glycoproteins is 10-80 nmol/L (Figs. 1G-I). These results well suggest that this array sensing platform is sensitive enough for the quantitative detection of glycoprotein at a nanomolar level.

|
Download:
|
| Fig. 1. (A-C) Fluorescence response curves of three BA-CDs to seven glycoproteins; (D-F) DLS results of three BA-CDs in the presence of glycoproteins; Fluorescence titration of (G) BA-CD1, (H) BA-CD2 and (I) BA-CD3 with increasing the concentration of glycoproteins (10-80 nmol/L). | |
In order to prove the AEE phenomenon of BA-CDs, BA-CDs aggregates are fabricated by dissolving BA-CDs in 10%, 30%, 50%, 70%, 90% poor solvents of DMSO and glycerol. The investigation on hydration particle size (Figs. S3 and S4 in Supporting information) showed a comparable assembling tendency with the increase of the poor solvent concentrations for both DMSO and glycerol. However, the results of fluorescence intensity (Figs. S3 and S4) showed the glycerol had significantly higher AEE efficiency than DMSO, due to the effect of hydroxyl groups. Similarly, the cis-diols groups combined with BA-CDs to form a rigid structure, restricting the non-radiative transition of the BA-CDs, and significantly impacting the signal response. We further measure the fluorescence lifetime (Fig. S5 in Supporting information). Fluorescence lifetimes of three BA-CDs are 4.59 ns, 4.72 ns and 5.38 ns, while they become 6.31 ns, 5.70 ns and 5.46 ns in the presence of glycoproteins. The increased fluorescence lifetime can be attributed to the restriction of CDs non-radiative transitions after the addition of glycoproteins. The boronic acid groups of BA-CDs ensure that selective interactions occur only when the complex is close to analytes (glycoproteins) with cis-diols structure. The BA-CDs will alter their fluorescence properties to glycoproteins via AEE effect differently, when forming different degrees of aggregation impacted by the molecular weight of saccharides and different local environmental factors, such as chemical compounds and change. Moreover, three BA-CDs show different surface states and boronic acid group contents (Figs. S2G and H), resulting in the different degrees of aggregation and non-radiative transition varying. This sensor array based on three BA-CDs is ensured with cross-reactivity, selectivity and sensitivity, and should be suitable for fingerprint-based sensing.
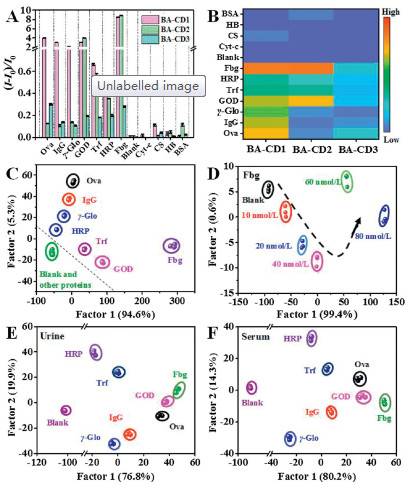
The responses of the three signal channels of BA-CDs to each analyte were recorded, and then the relative signal change in FL responses was quantified by (I - I0)/I0, where I and I0 are the emission intensities with and without analytes, respectively. The glycoproteins had very different ratios in each signaling profile, thus the response fingerprints of each glycoprotein were generated in Fig. 2A. The signal responses are negligible for the blank and non-glycoproteins (e.g., BSA, Hb, Cyt-c and CS), compared to the obviously enhanced responses for all the glycoproteins, verifying the well selectivity of this BA-CDs sensor. To clearly demonstrate the fingerprint response patterns of each analyte, we converted the response pattern to a heat map (Fig. 2B). The results prove that the sensing array can discriminate different glycoproteins by intuition.

|
Download:
|
| Fig. 2. (A) Fluorescence response patterns of glycoproteins and non-glycoproteins on the sensor array; (B) Heat map derived from fluorescence response pattern for proteins; (C) Canonical plot for the first two factors of simplified fluorescence response patterns. Glycoprotein concentration is at 80 nmol/L; (D) Identification of Fbg at various concentrations based on this sensor array; LDA canonical score plots for the response of the sensor array to glycoproteins (10 nmol/L) in (E) human urine and (F) human serum. Human serum and urine samples were collected from healthy volunteers at the Hospital of Northeastern University, and all relevant ethical regulations were complied with. | |
The resultant fluorescence response pattern was then analyzed using LDA, a widely used mathematical statistical method in sensing array system to maximize the separation ability of the sensor array. Three replicates were tested for each glycoprotein in each BA-CD, producing a training matrix (3 BA-CDs × 7 glycoprotein × 3 replicates) (Table S2 in Supporting information). Then, the matrix was handled by the IBM SPSS (version 22.0). A 2D plot was generated using the first two most significant discrimination factors (Fig. 2C), where each point represents the fluorescence response of three CDs to one glycoprotein.
To further announce the discriminating capability of BA-CDs-based sensor array to various concentrations of glycoproteins, LDA calculations were conducted to plot the discrimination results. Seven glycoproteins and blank & other proteins were clearly separated into eight clusters without overlap even at a very low concentration (80 nmol/L, 60 nmol/L, 40 nmol/L, 20 nmol/L and 10 nmol/L) (Fig. S6 in Supporting information), and the discrimination accuracy was 100% for each glycoprotein according to Jackknife classification (Table S3), indicating the effective discrimination ability of the CDs-based sensor array against glycoprotein. As shown in Fig. 2D and Fig. S7 (Supporting information), this sensor array is sufficiently sensitive to detect glycoproteins at a nanomolar concentration level. Therefore, the discrimination sensitivity of this sensing array platform is deduced to be 10 nmol/L. The sensing of large biological entities is of great importance in biomedical research. For example, detecting the presence of marker proteins is crucial for the early diagnosis and treatment of diseases. Glycoproteins in urine/serum are frequently regarded as significant biomarkers for disease prevention and treatment [7]. The discrimination ability of glycoproteins is not sacrificed in human urine/serum (Figs. 2E and F). Glycoproteins are easily clustered into seven groups regardless of the complexity of urine/serum composition. Thus, this array sensing platform exhibits the excellent stability, and is promising for early disease diagnosis in complex matrix environments.
Traditionally, cell discrimination by sensor array often relies on the diverse expression of total proteins, and these subtle changes result in the use of total protein-driven cell profile with a low sensitivity. Considering that some glycoproteins have been clinically used as cancer biomarkers, we envisioned that our BA-CDs array could be able to differentially interact with these representative components of cancer cell, which should potentially lead to the generation of fluorescent signals reflecting the interactions with overall glycoprotein biomarkers.
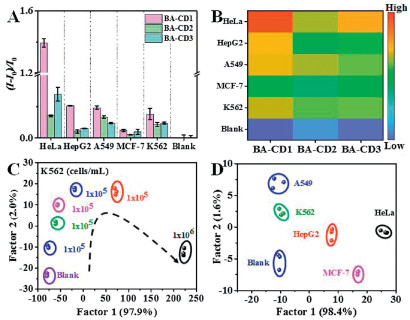
In order to assess the practicability of this array sensing platform in clinic diagnosis, we choose five different cancer cells (Table S4 in Supporting information) to evaluate this triple-channel array sensing platform. The dynamics curve of incubation at different times is plotted at the fluorescence intensity (Fig. S8 in Supporting information). To obtain the stable fluorescence response, 15 min was chosen as the optimal incubation time. After incubation with BA-CDs for 15 min, living cancer cells exhibited strong blue fluorescence as shown in Fig. S9 (Supporting information), indicating that BA-CDs could bind to cancer cells. Subsequently, we added the BA-CDs probes to different concentrations of the five cancer cells. We observed a concentration-dependent fluorescence increase with increasing the concentrations of all cancer cells ranging in 1 × 10³-1 × 10⁶ cells/mL (Fig. S10 in Supporting information). These results well suggest that this array sensing platform is sensitive enough for the quantitative detection of cancer cell at 103 cells/mL.
The distinct differences in FL response patterns for each cell line were observed (Figs. 3A and B, Table S5 in Supporting information). A score plot constructed using the canonical factors produced 6 non-overlapping clusters corresponding to the 5 cell lines and blank (Fig. 3D), indicating excellent discriminatory capability of this method. We use LDA to identify different numbers of one cell and different cell types of one concentration (Fig. 3C, Figs. S11 and S12 in Supporting information). The distinct and characteristic responses for each cell type demonstrate the sensitivity and selectivity of the BA-CDs sensor to cell, indicating effective FL response-based fingerprinting of cell types. Overall, the differential interaction of the sensor combined with the robust statistical analysis suggest the feasibility of FL response-based identification of diverse types of cells in a rapid, sensitive, and accurate manner. Table S6 (Supporting information) summarizes some of the commonly applied procedures for the discrimination of proteins and cells. It is noticeable that the present approach offers a favorable identification ability, which is the hitherto reported most sensitive approach for the distinguishing assay, along with favorable selectivity, which is highly important for practical applications in the assay of real biological samples/systems.

|
Download:
|
| Fig. 3. (A) Fluorescence response patterns of cancer cells on the sensor array; (B) Heat map derived from fluorescence response pattern; (C) Identification of K562 cells at various concentrations based on this sensor array; (D) Canonical plot for the first two factors of simplified fluorescence response patterns. The concentration of cells is 106 cells/mL. | |
In summary, a novel triple-channel nanoparticle sensing platform is constructed with three aggregated fluorescence enhancement BA-CDs to discriminate and detect glycoproteins and cells. The BA-CDs are prepared through a simple one-step method. Seven glycoproteins and five cancer cells are accurately discriminated and detected by the sensing platform at a low concentration of 10 nmol/L for glycoproteins and 1000 cells/mL for cancer cells, respectively. This work provides a simple, rapid, sensitive and low-cost method to determine glycoproteins and cells. Taking into account the facile synthesis method for BA-CDs, we anticipate that this new sensing platform would be widely utilized with satisfactory performance for proteome research, clinical diagnostics, and biomedical research in the future.
Declaration of competing interestThe authors report no declarations of interest.
AcknowledgmentsThis work is financially supported by the National Natural Science Foundation of China (Nos. 21922402, 21874017 and 21727811), Liaoning Provincial Program for Promoting Talents (Nos. XLYC1807005 and XLYC1802016), and the Key Laboratory of Data Analytics and Optimization for Smart Industry (Northeastern University, Ministry of Education, China, 111 Project, No. B16009). Special thanks are due to the instrumental analysis from Analytical and Testing Center, Northeastern University.
Appendix A. Supplementary dataSupplementarymaterial related to this article canbefound, in the online version, at doi:https://doi.org/10.1016/j.cclet.2021.03.060.
| [1] |
K. Ohtsubo, J.D. Marth, Cell 126 (2006) 855-867. DOI:10.1016/j.cell.2006.08.019 |
| [2] |
S.R. Stowell, T.Z. Ju, R.D. Cummings, Protein glycosylation in cancer, in: A.K. Abbas, S.J. Galli, P.M. Howley (Eds. ), Annual Review of Pathology: Mechanisms of Disease, Vol. 10, Annual Reviews, Palo Alto, 2015, pp. 473-510.
|
| [3] |
S.S. Pinho, C.A. Reis, Nat. Rev. Cancer 15 (2015) 540-555. DOI:10.1038/nrc3982 |
| [4] |
Z. Qiu, J. Shu, J. Liu, D. Tang, Anal. Chem. 91 (2019) 1260-1268. DOI:10.1021/acs.analchem.8b05455 |
| [5] |
S. Lv, K. Zhang, L. Zhu, D. Tang, Anal. Chem. 92 (2020) 1470-1476. DOI:10.1021/acs.analchem.9b04710 |
| [6] |
S. Lv, K. Zhang, Y. Zeng, D. Tang, Anal. Chem. 90 (2018) 7086-7093. DOI:10.1021/acs.analchem.8b01825 |
| [7] |
C. Reily, T.J. Stewart, M.B. Renfrow, J. Novak, Nat. Rev. Nephrol. 15 (2019) 346-366. DOI:10.1038/s41581-019-0129-4 |
| [8] |
C.A. West, M. Wang, H. Herrera, et al., J. Proteome Res. 17 (2018) 3454-3462. DOI:10.1021/acs.jproteome.8b00323 |
| [9] |
W. Tan, M.J. Donovan, J. Jiang, Chem. Rev. 113 (2013) 2842-2862. DOI:10.1021/cr300468w |
| [10] |
Y. Geng, W.J. Peveler, V.M. Rotello, Angew. Chem. Int. Ed. 58 (2019) 5190-5200. DOI:10.1002/anie.201809607 |
| [11] |
S. Xu, W. Li, X. Zhao, et al., Anal. Chem. 91 (2019) 13947-13952. DOI:10.1021/acs.analchem.9b03463 |
| [12] |
S. Tomita, S. Ishihara, R. Kurita, ACS Appl. Mater. Interfaces 11 (2019) 6751-6758. DOI:10.1021/acsami.8b18118 |
| [13] |
N.D.B. Le, G.Y. Tonga, R. Mout, et al., J. Am. Chem. Soc. 139 (2017) 8008-8012. DOI:10.1021/jacs.7b03657 |
| [14] |
M. De, S. Rana, H. Akpinar, et al., Nat. Chem. 1 (2009) 461-465. DOI:10.1038/nchem.334 |
| [15] |
M.M. Adams, E.V. Anslyn, J. Am. Chem. Soc. 131 (2009) 17068-17069. DOI:10.1021/ja908319m |
| [16] |
Z.W. Sun, S. Wu, J.H. Ma, et al., ACS Appl. Mater. Interfaces 11 (2019) 36316-36323. DOI:10.1021/acsami.9b10729 |
| [17] |
Y. Geng, J. Hardie, R.F. Landis, et al., Chem. Sci. 11 (2020) 8231-8239. DOI:10.1039/D0SC02792H |
| [18] |
Y. Geng, A.N. Chattopadhyay, X. Zhang, et al., Small 16 (2020) 2002084. DOI:10.1002/smll.202002084 |
| [19] |
H. Bai, Z. Liu, T. Zhang, et al., ACS Nano 14 (2020) 7552-7563. DOI:10.1021/acsnano.0c03404 |
| [20] |
S. Wu, Y. Han, L. Wang, et al., Anal. Chem. 91 (2019) 10772-10778. DOI:10.1021/acs.analchem.9b02381 |
| [21] |
H. Sugai, S. Tomita, S. Ishihara, R. Kurita, ACS Sens. 4 (2019) 827-831. DOI:10.1021/acssensors.9b00247 |
| [22] |
B. Nie, R. Huang, T. Yao, et al., Adv. Funct. Mater. 29 (2019) 1808786. DOI:10.1002/adfm.201808786 |
| [23] |
X. Lin, L.F. Gao, J.H. Wang, X.W. Chen, Chem. Commun. 55 (2019) 13673-13676. DOI:10.1039/C9CC07515A |
| [24] |
H. Song, X. Liu, B. Wang, Z. Tang, S. Lu, Sci. Bull. 64 (2019) 1788-1794. DOI:10.1016/j.scib.2019.10.006 |
| [25] |
Y. Ma, A.Y. Chen, Y.Y. Huang, et al., Carbon 162 (2020) 234-244. DOI:10.1016/j.carbon.2020.02.048 |
| [26] |
S. Lu, L. Sui, J. Liu, et al., Adv. Mater. 29 (2017) 1603443. DOI:10.1002/adma.201603443 |
| [27] |
W. Li, Y. Liu, B. Wang, et al., Chin. Chem. Lett. 30 (2019) 2323-2327. DOI:10.1016/j.cclet.2019.06.040 |
| [28] |
B. Wang, J. Li, Z. Tang, B. Yang, S. Lu, Sci. Bull. 64 (2019) 1285-1292. DOI:10.1016/j.scib.2019.07.021 |