 2021, Vol. 32


b Department of Critical Care Medicine, Shanghai Chest Hospital, Shanghai Jiao Tong University, Shanghai 200030, China;
c School of Microelectronics, Fudan University, Shanghai 200093, China;
d Shanghai Key Laboratory of Molecular Imaging, Shanghai University of Medicine and Health Sciences, Shanghai 201318, China;
e Department of Physics, Shanghai Normal University, Shanghai 200234, China
Carbon dots (CDs) with unique optical properties, good biocompatibility, and excellent chemical and light stability have shown great potential in the fields of bioimaging and optoelectronic devices [1]. Tremendous progress over the past few years has been made in the synthesis and mechanistic study of fluorescent CDs. Currently, it is possible to produce CDs emitting light from deep ultraviolet to near-infrared (NIR) wavelengths through the adjustment of precursor and reaction conditions [2-5]. Among various methods, hydro/solvothermal techniques represent ideal solutions to prepare multicolor CDs. Different solvents, including water, ammonia, organic solvents, and acidic solvents, have been utilized to realize multicolor emission [6, 7]. The hydro/solvothermal environment could influence the emission wavelength, quantum yield (QY) and decay lifetime of the CDs since some solvents are capable of introducing heteroatom dopants into the sp2 carbonic domains or chemical groups at the surface. Due to the "infinite" possibilities of structural tunability, extensive work has been carried out to explore the intrinsic relations between photoluminescence (PL) and surface states/heteroatom dopants of CD [8, 9].
To date, two dominant models, the graphitic core and surface states, have been proposed to explain the fluorescence of CDs. Apart from the typical quantum confinement effects, surface defects induced by dopants could effectively tune the emission wavelength by creating new energy levels between the HOMO and LUMO. The common heteroatoms (nitrogen and oxygen) have been utilized to alter PL in CDs [3, 10, 11]. The N dopant is in the form of amino, pyridinic, pyrrole and graphitic N, leading to different PL shifts. For example, pyridinic N has been found to be responsible for the blue-shift in PL emission, while red-shifted absorption and PL are associated with the increasing amount of graphitic N due to the generation of mid-gap states [10-12]. Formamide and N, N-dimethyl-formamide (DMF) have been widely used as solvent and nitrogen sources in preparing CDs, and most of the prepared CDs emit blue to green PL [11, 13]. Oxygen functional groups also play important roles in regulating the light absorption and PL of CDs by triggering unequal distribution of the electron density and decreasing electron localization [14-17]. In some cases, carbonyl groups show superior performance in inducing long-wavelength emission of CDs by increasing the strength of frontier orbital hybridization and narrowing the bandgap [9, 16].
Several studies have shown successful tuning of CD PL across the whole visible spectrum via nitrogen/oxygen substitutions and introduction of functional groups [18-21]. Ding et al. reported a series of CDs with tunable PL from blue to red by adjusting the solvent used, attributed to synergistic effect among the π-electron system, graphitic N, and oxygen-related surface states [18]. Yang et al. prepared blue and red emissive CDs by changing the reaction conditions and suggested that graphitic N and carbonyl improved the red emission [20]. These studies provide insight into the structure-fluorescence relationship and the PL mechanism of CDs. However, most of the proposed PL mechanisms depend on multiple factors, such as particle size/surface states/heteroatom dopants, that can have different effects. Adequate methods to systematically control the surface structure of CDs are still lacking. In addition, the generation of white-light emission is usually obtained by elaborately adjusting the weight ratio among blue, green, and red luminescent CDs or relying on aggregation behaviors [3, 4]. Few studies have been devoted to developing a one-step route for preparing white emissive CDs (W-CDs) with QY above 10%.
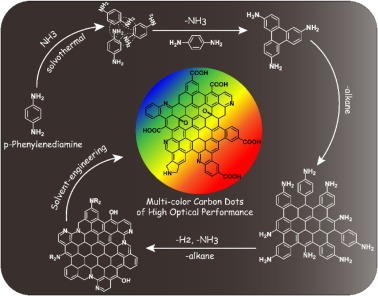
Herein, highly luminescent CDs with different colors and white light emission were successfully synthesized via a facile one-pot solvothermal approach. p-Phenylenediamine (PPD) was utilized as the carbon source, and amides (formamide, DMF, dimethylacetamide) were mixed with NaOH as the solvent. The PLQYs of the different CDs with blue, green, red and white emission reached 61.6%, 41.3%, 29.1% and 19.7%, respectively. X-ray photoelectron spectroscopy (XPS) measurements together with density functional theory (DFT) calculations revealed that the different colors are related to the synergistic effect between nitrogen/oxygen substitutions and surface defects. The defects either decreased the energy levels of the LUMO or increased the energy levels of the HOMO, thus tuning the energy bandgap and PL emission wavelength. In addition, the CDs were demonstrated in bioimaging and white-light emitting diode (WLED) applications.
The synthesis of different colored CDs involved solvothermal treatment of PPD as the carbon source in four different solvents at 180 ℃ for 12 h. The four types of CDs obtained in formamide, DMF, DMAC and the mixed solvent (formamide and DMF in a volume ratio of 3:1) demonstrated blue, green, red and white emission and are labeled as B-CDs, G-CDs, R-CDs and W-CDs, respectively. PPD compounds composed of benzene rings and amino groups could promote a rigidπ-conjugated carbonic skeleton through polycondensation, as shown in Fig. 1 [10, 22].

|
Download:
|
| Fig. 1. Schematic illustration of the preparation of tricolor and white emissive CDs. | |
Fig. 2 shows the TEM, high-resolution transmission electron microscopy (HRTEM) and size distributions of the four CDs. The images reveal that B-, G-, R-, and W-CDs were well dispersed and homogeneous, with average diameters of approximately 2.7, 3.4, 3.5, and 4.0 nm, respectively. The results indicated that the B-CDs prepared in formamide are relatively small, while the sizes of the G-CDs and R-CDs are nearly the same. The HRTEM images show well-resolved lattice spacing of 0.21 nm in the four types of CDs, attributed to the typical (100) crystal plane of graphitic carbon [18]. Atomic force microscopy (AFM) images indicate that the four types of CDs have similar thicknesses of 0.4~1.2 nm, corresponding to 1~3 layers of graphene, as shown in Fig. S1 (Supporting information) [23].

|
Download:
|
| Fig. 2. TEM, HRTEM images and size distribution diagrams of (a) B-CDs, (b) G-CDs, (c) R-CDs, and (d) W-CDs. The inserted photos are the corresponding CDs under UV light. | |
X-Ray diffraction (XRD) patterns exhibit a sharp peak at 26.8° for all CDs, which is attributed to the (002) diffraction peak of graphite (Fig. S2a in Supporting information) [18]. The appearance of this peak implies that the highly conjugated sp2 domain was closely packed within the carbonic cores of the CDs, consistent with the HRTEM images. In addition, there is a slight increase in the relative intensity of the diffraction peak from B-CDs to G-CDs, while the intensities remained similar for G-CDs, R-CDs and W-CDs. The results indicate that B-CDs possess a shorter effective conjugation length than the other three CDs [24, 25]. Raman spectra of the four samples (Fig. S2b in Supporting information) show two peaks at 1348 and 1585 cm−1, corresponding to the disordered structure or defect (D band) and the graphitic carbon domain (G band), respectively. The intensity ratios between ID and IG of the B-, G-, R-, and W-CDs were 0.981, 0.985, 0.987, and 1.000, respectively. This value is generally used to characterize the degree of structural order of carbon materials. A small ID/IG ratio indicates better crystallinity [26]. The functional groups on the surface of the CDs were characterized by FTIR spectroscopy. As shown in Fig. S2c (Supporting information), a broad peak located in the range of 3400−3000 cm−1 of the FTIR spectrum is observed and assigned to the stretching vibrations of O-H/N-H. Two weaker peaks at 2926 cm−1 and 2864 cm−1 are attributed to the symmetrical stretch vibration of −CH3 and −CH2. Another band at 1563 cm−1 corresponds to the stretch vibration of C = C [27]. From B-, G- to R-CDs, the peaks at ~1267 cm−1 due to C-N stretch gradually decreased [28]. The number of C-N bonds in G-CDs seems to be substantially reduced based on the disappearance of the 1267 cm−1 peak. Moreover, two peaks at 1660 cm−1 and 1089 cm−1 are observed and attributed to C = O and C-O stretch, respectively [29]. These results confirm the existence of nitrogen and oxygen functional groups in the structure.
The optical properties of the CDs were then characterized by UV–vis and PL spectra. The UV–vis absorption spectra of the four types of CDs are shown in Fig. 3a and Fig. S2 (Supporting information). All four samples have strong absorption around 270nm, assigned to the π-π* transition of C = C bonds. Another band peaked ~350 nm is attributed to the n-π* transition of C = O [30]. In addition, some weaker absorption bands appear in the 400–620 nm range for the G- and R-CD samples, which could be attributed to the n-π* transitions of the aromatic sp2 structure containing C = N/C = O bonds [19, 20, 31]. The emission bands of B-, G- and R-CDs are peaked at 458, 538, and 628 nm, respectively, while the PL spectra of W-CDs exhibited two peaks at 453 and 493 nm with a shoulder peak at 587nm (Fig. 3b), covering most of the visible region. The PLQYs of the B-, G-, R, and W-CDs reached 61.6%, 41.3%, 29.1% and 19.7%, respectively. Generally, the key to improving PLQY is to promote radiation transition and suppress nonradiative transitions, which could be realized by controlling the electronic transition process of surface states [32, 33]. Electron-donating species in the structure usually improves PLQY. Otherwise, the PLQY yield will be suppressed by electron-withdrawing species [9, 16]. Therefore, a high percentage of C-N configurations in B-CDs as electron-donating species improves the PLQY by inhibiting nonradiative transitions. In contrast, the obtained R-CDs exhibit low PLQYs, possibly due to the presence of large amounts of electron-withdrawing carbonyl functional groups acting as nonradiative trap centers [34, 35].

|
Download:
|
| Fig. 3. (a) Absorption spectra, (b) normalized PL spectra, (c) time-resolved PL spectra, (d) 2D EEM fluorescent spectra, and (e) CIE color coordinates of the four types of CDs. | |
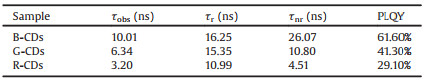
Time-resolved PL (TRPL) was used to study the excited-state radiative relaxation dynamics of the three types of CDs. As shown in Fig. 3c, the TRPL decay profiles were fitted with a double exponential function, with a lifetime τ of ~10.01 ns for B-CDs, 6.34 ns for G-CDs, and ~2.67 ns for R-CDs) (Table S1 and Fig. S3 in Supporting information). The PL dynamics are a combination of trap-assisted (slower early time) and non-trap-assisted (shorter time) charge-carrier recombination [36]. Theτ1 are calculated to be 10.23, 8.93 and 5.69 ns from B-, G- to R-CDs. The decrease of longer time component (τ1) indicated gradually increased density of traps in the three CDs, which is similar with the descending trend of average PL lifetime. On the other hand, the slower component (τ2) can be attributed to non-trap-assisted charge-carrier recombination pathways, which are similar in the three samples. This result in addition to measured PLQY deciphers the key effect of surface properties on non-radiative decay processes [16, 36, 37]. Fig. S3 then presents the time-resolved PL lifetime decay of W-CDs at different emissions. The average lifetimes are 9.9, 6.87 and 3.87 ns for emission at 463, 493 and 587 nm, which agree with the higher percentage of short-wavelength light shown in the PL spectrum.
Using the PLQY and observed average lifetime, we then calculated the key photophysical parameters, including the radiative and non-radiative lifetime, shown in Eqs. 1 and 2 [36].

|
(1) |
where (τobs), (τr), and (τnr) are the average PL lifetime, radiative lifetime, and non-radiative lifetime, respectively. The relationship between observed PL lifetime (τobs), radiative lifetime (τr), and PLQY is shown in Eq. 2.

|
(2) |
Using the two equations, the τr and τnr are calculated for the three CDs and listed in Table 1. The τnr significantly decreased, which is similar to what observed for the average PL lifetime (τobs) and PLQY. It has been reported previously that higher possibility of non-radiative recombination can be resulted from higher density of trap states, leading to shorter τnr [36]. However, τr did not exhibit strong dependence to the core size, as it decreased by increasing the CD size. These results suggest the key role of non-radiative recombination caused by surface defects on PL dynamics.
|
|
Table 1 Calculated radiative and non-radiative lifetime for CDs. |
Fig. 3d shows the three-dimensional (3D) excitation-emission maps of the four types of CDs. For B-CDs, the emission peaks were mainly from 450 nm to 470 nm with excitation wavelengths ranging from 330nm to 420 nm. For G-CDs, the emission peaks changed from 518nm to 536nm as the excitation wavelength shifts from 390 nm to 450 nm. In the case of R-CDs, the maximum peak was located at approximately 640 nm when the excitation wavelength shifted from 460nm to 540 nm. The results demonstrated that both B-CDs and R-CDs exhibited excitation-independent emission properties, while the G-CDs exhibited excitation-dependent emission [25]. Impressively, the map of W-CDs showed a comparatively wider emission range, which is derived from the multiple emission centers in CDs with different surface dopants. The single area of optical space also confirmed that the white emission originated from single CDs rather than different components [37]. The PL spectra of the four types of CDs under the excitation of different wavelengths are shown in Fig. S4 (Supporting information). The B-CDs displayed weak excitation-dependent emission properties, while the G-, R-, and W-CDs exhibited obvious excitation-dependent emission properties. The results are consistent with the 2D EEM spectra. Moreover, the intensity of the light emissions gradually decreased from B-, G-, R- to W-CDs, consistent with their PLQYs.
The CIE color coordinates of the CDs were then calculated from their emission spectra, as shown in Fig. 3e. The CIE coordinates of the samples appeared at (0.151, 0.093) for B-CDs, (0.237, 0.718) for G-CDs, (0.722, 0.278) for R-CDs, and (0.293, 0.312) for W-CDs. The CIE coordinate of W-CDs is close to that of pure white light (0.33, 0.33), exhibiting good white-light performance [38]. A previous study indicated that the increasing size of CDs equating to graphitization can lead toπ electron delocalization within the sp2 domain, which narrows the bandgap and causes the emission redshift [39]. In our case, however, G-CDs and R-CDs are nearly identical in size and larger than B-CDs. This indicates that the particle size does not play a vital role in the PL redshift by comparing those of the G-CDs and R-CDs. The narrowing of energy gaps and the PL shifts were dominantly dependent on the underlying oxygen-related surface defect sites in both the basal plane and edge sites of the CDs [16].
The surface defect states of the four types of CDs were then studied by XPS spectra. The CDs are composed of C, N, and O elements, with ratios different for B-CDs compared to W-CDs, as seen from the full XPS survey (Fig. S5 in Supporting information). According to the XPS results, the ratio of N/C changed from 0.30, 0.12, 0.16 and 0.38, while the ratio of O/C changed from 0.06, 0.23, 1.26 and 0.14, as shown in Table S2 (Supporting information). The significant difference indicated a decrease in nitrogen content and an increase in oxygen content, which greatly influenced the surface defect states. The high-resolution C 1s, N 1s and O 1 s spectra of the four types of CDs are shown in Fig. 4a. The percentages of different bonding compositions calculated by the XPS analysis in Fig. 4a are listed in Table S3 (Supporting information).

|
Download:
|
| Fig. 4. (a) High-resolution C 1s, N 1 s, and O 1s XPS spectra. (b) Nitrogen content (light blue column) and pyridinic N ratios (yellow line) of the four types of CDs. (c) Oxygen content (red column) and C = O ratios (blue line) of the four types of CDs. | |
The C 1s band can be deconvolved into three kinds of carbon species, namely, sp2 C (C-C/C = C) at 284.4 eV, sp3 C (C-N/C-O) at 286 eV, and -C = O at 287.6 eV. The decrease in the percentage of sp2 C from B-, G- to R-CDs suggested a decreasing degree of graphitization in the surface structure of CDs, which was apparently the consequence of additional surface defect sites. In the N 1s high-resolution XPS spectra, the N 1 s band can be deconvolved into two peaks, which represent pyridinic nitrogen (399.2 eV) and pyrrolic nitrogen (400.1 eV) [11, 40, 41]. The relative content of pyridinic nitrogen affects the total nitrogen content in CDs (Fig. 4b, Table S3), which reached the highest value in B-CDs and decreased greatly in G- and R-CDs. The O 1s band contained two components of C = O at 530.7 eV and C-O at 531.7 eV for C = O [15, 40, 42]. The relative content of C = O influenced the total oxygen content in the CDs (Fig. 4c, Table S3), which increased obviously from B-, G- to R-CDs. The above structural characterization results clearly demonstrated that the four types of CDs contain π-conjugated domains with nitrogen/oxygen-related surface defect sites. From B-CDs and G-CDs to R-CDs, the nitrogen content decreased while the oxygen content increased, which further tuned the energy gap and optical properties. In addition, the contents of nitrogen and oxygen in the W-CDs are between those of the B-CDs and G-CDs, which implies that the white emission is a result of different surface emission centers. Fig. S6 (Supporting information) shows the zeta potential values of the four types of CDs. The zeta potential values of B-, G-, R- and W-CDs in water were measured to be –15.87, –22.48, –52.25, and –32.41 mV, respectively. The negatively charged CDs indicated the presence of negatively charged groups (such as carboxyl groups) on their surfaces.
The distinct surface states of the tricolor CDs effectively tuned the fluorescence by modulating their energy gap, which was also reflected in the UV–vis spectra. The energy gap of CDs could be obtained utilizing the equation Eg = hc/λAbs, where λAbs is the UV cutoff wavelength (Fig. S7 in Supporting information). From blue to red, the energy gap changed from 2.90 eV, 2.40 eV to 1.98 eV, which was a comprehensive result of different graphitization degrees and surface defect species. The defects either decreased the energy levels of the LUMO or increased the energy levels of the HOMO to reduce the energy gap. To elucidate the specific influence, the HOMO levels of the B-, G- and R-CDs were determined by means of ultraviolet photoelectron spectroscopy (UPS) and are −8.01, −8.04 and −8.05 eV, respectively (Fig. S8 in Supporting information). The LUMO levels of the tricolor CDs were deduced from the energy gap and HOMO level, resulting in values of −5.11, −5.64, and −6.07 eV for blue, green and red CDs, respectively. According to the data in Table S4, the energy level distribution diagram of the tricolor CDs is demonstrated in Fig. 5a. Due to the strong electron negativity of oxygen atoms, the presence of oxygen-related functional groups with electron-accepting properties (i.e., −C = O) would lower the LUMO energy level [15, 16]. Moreover, the existence of pyridinic and pyrrolic nitrogen could cause a blueshift of PL emission via the donation of electrons to the occupied π orbitals [43]. The two factors both contributed to the decline in energy gaps and redshifted PL emission from B-, G-, to R-CDs, while the white emission was the synergistic result of N- and O-related surface defects.

|
Download:
|
| Fig. 5. (a) Illustration of the tricolor and white-light emissions from CDs. (b) Time-dependent density functional theory calculation results: structure model CDs consisting of 9 fused benzene rings and the calculated HOMO and LUMO. (c) PL and UV spectra of CDs-1, CDs-2 and CDs-3. | |
To determine the energy levels and optical properties of CDs with different substitutions or functionalizations, we performed DFT calculations, where three feasible 9-membered benzene ring models were constructed corresponding to the CDs of low, medium and high degrees of oxidation (Fig. 5b). The Vienna Ab initio simulation software package (VASP) was used to track the energy gap changes in CDs with different amounts of defect sites. Wavefunction analysis was carried out with the Multiwfn program [44]. According to the calculation results, the LUMO energy levels changed from ‒3.039 eV, ‒3.607 eV to ‒4.192 eV, corresponding to CDs with low oxidation and high nitrogen substitution (CDs-1), medium modification (CDs-2), and high oxidation and low nitrogen substitution (CDs-3). Moreover, their HOMO energy levels remained largely unchanged (‒6.124 eV, ‒6.105 eV, ‒6.114 eV).
The different energy levels are mainly attributed to the varied amounts of oxygen- and nitrogen-defective species. Firstly, the attached oxygen functional groups on the basal plane and edge sites of CDs change the conformation from planar to bow-like. The decrease in the geometric stiffness of CDs tended to produce greater redistribution of electrons, and the changed geometry was a key feature that induced the small spatial orbital overlap between the HOMO and LUMO [16, 45]. The electron density increased in the LUMO around the carbonyl oxygen atoms because the existence of carbonyl reduced the LUMO energy level by withdrawing electrons from theπ-conjugated skeletons [43]. Moreover, with an increase in the number of carbonyl groups, a larger electron redistribution is produced, resulting in a decrease in energy gaps and a PL red-shift [46]. On the other hand, pyridinic and pyrrolic nitrogens mainly function as electron donors in the electron delocalization system, thus inducing the blueshift of PL emission [29]. Furthermore, the calculated energy gaps and optical properties of CDs-1, CDs-2 and CDs-3 corresponding to the three models were 3.085 eV (PL emission peak 451 nm, absorption peak 387 nm), 2.498 eV (PL emission peak 533 nm, absorption peak 468 nm) and 1.922 eV (PL emission peak 634 nm, absorption peak 536 nm), respectively. The results are consistent with the experimental observations, which confirm the importance of the synergistic effect between nitrogen- and oxygen-related defects on fluorescence tuning.
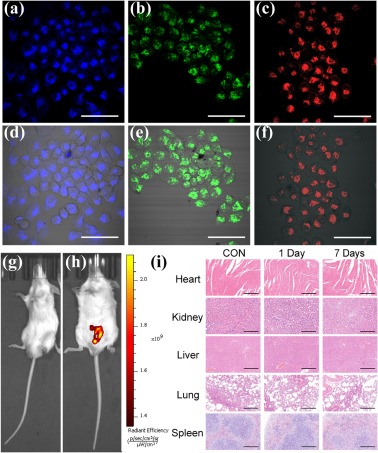
The CDs were utilized as in vivo and in vitro fluorescent probes. A standard 3-(4, 5-dimethylthiazole-2-yl)-2, 5-diphenyltetrazolium bromide (MTT) assay was performed to test the cytotoxicity of the CDs on HepG2 cells (Fig. S9 in Supporting information). The assay showed that the cell viabilities hardly decreases and were still above 92% after 24 h of incubation in the tricolor CD solution, even when the concentration of the CDs was 500 μg/mL. The cell viability assays proved that the obtained CDs have good water/serum solubility and dispersibility and low cytotoxicity [47, 48]. The cell imaging ability was then studied by incubating HepG2 cells with the CDs and irradiating them under a confocal microscope (Figs. 6a-f). HepG2 cells took up the CDs, and the three batches emitted blue, green and red fluorescence in their cytoplasm. The images indicated that the tricolor CDs all penetrated into the cells and could maintain a steady and clear fluorescent signal [49, 50]. Then the obtained R-CDs were further evaluated for possible applications in future clinical research by studying their toxicity andin vivo imaging. In Figs. 6g and h, with an excitation wavelength of 560 nm and an emission filter at 620 nm, a strong fluorescent image with a good signal-to-noise ratio at the injection site was observed. This indicated that red fluorescence can effectively penetrate healthy mouse skin and tissue. During the experiment, no animals showed any signs of an acute toxicological reaction. Samples from five parts were also collected. The tissues were cut into thin sections, stained with hematoxylin and eosin (HE) and then carefully observed under a microscope to analyze the R-CD group for any pathological changes. Compared with the data obtained from the histological analysis (Fig. 6i), it can be concluded that no significant differences or histological abnormalities occurred in any organ between the blank and treated groups. The above results verified that the red CDs of strong fluorescence could be applied as a safe and effective fluorescent probe for both in vitro and in vivo bioimaging. Besides, a WLED film was fabricated by the mixing the W-CDs with PVA, shown in Fig. S10 (Supporting information). The obtained composite film is expected to be a promising material for lighting equipment.

|
Download:
|
| Fig. 6. Confocal fluorescence images of HepG2 cells and the merged images with their corresponding bright-field images treated with (a, d) B-GQDs, (b, e) G-GQDs, and (c, f) R-GQDs. Scale bar: 35μm.In vivo images of nude mice (22–25g) (g) before and (h) after subcutaneous injection of 100μL of PBS solution of R-CDs (1mg/mL). (i) Histological evaluation of thein vivo toxicity of R-CDs: heart, kidney, liver, lung, and spleen collected from control untreated mice (CON) and CD-treated mice (1 day and 7 days). Scale bar: 50μm. The animal protocols were approved to be appropriate and humane by the institutional animal care and use committee of the Chinese Academy of Sciences. | |
In summary, we have demonstrated a new approach to tune the bandgap and color of light emission of CDs through nitrogen substitution and oxidation in a one-step facile reaction. The PLQYs of the different CDs with blue, green, red and white emission reached 61.6%, 41.3%, 29.1% and 19.7%, respectively. XPS measurements suggested that oxygen-related surface defects are mainly responsible for the red PL due to lowered LUMO energy levels, while nitrogen substitution (pyridinic/pyrrolic nitrogen) results in blue-shifted PL. DFT calculations reveal that the carbonyl group attracts electrons from the π-conjugated skeletons and produced larger electron delocalization, eventually resulting in decreased bandgaps. Moreover, the CDs are shown to be biocompatible and useful as a bioimaging probe for both in vitro and in vivo assays. The one-step-prepared W-CDs also showed excellent performance in WLED devices.
Declaration of competing interestThe authors report no declarations of interest.
AcknowledgmentsWe greatly appreciate the financial support from the Chenguang Scholar Project of Shanghai Education Commission (Nos. 19CG52, 19CG53), National Natural Science Foundation of China (No. 62071300), Science and Technology Commission of Shanghai Municipality (Nos. 19ZR1435200, 20490761100), Program of Shanghai Academic/Technology Research Leader (No. 19XD1422900), Cross-program of Medical & Engineering (University of Shanghai for Science and Technology) and Foundation of State Key Laboratory of High-efficiency Utilization of Coal and Green Chemical Engineering (No. 2021-K33).
Appendix A. Supplementary dataSupplementary material related to this article can befound, in the online version, at doi:https://doi.org/10.1016/j.cclet.2021.03.051.
| [1] |
C. Hu, M. Li, J. Qiu, Y.P. Sun, Chem. Soc. Rev. 48 (2019) 2315-2337. DOI:10.1039/c8cs00750k |
| [2] |
D. Ghosh, K. Sarkar, P. Devi, K.H. Kim, P. Kumar, Renew. Sust. Energ. Rev. 135 (2021) 110391. DOI:10.1016/j.rser.2020.110391 |
| [3] |
K. Hola, Y. Zhang, Y. Wang, et al., Nano Today 9 (2014) 590-603. DOI:10.1016/j.nantod.2014.09.004 |
| [4] |
B. Lyu, H.J. Li, F. Xue, et al., Chem. Eng. J. 388 (2020) 124285. DOI:10.1016/j.cej.2020.124285 |
| [5] |
S. Lu, L. Sui, J. Liu, et al., Adv. Mater. 29 (2017) 1603443. DOI:10.1002/adma.201603443 |
| [6] |
H. Song, X. Liu, B. Wang, Z. Tang, S. Lu, Sci. Bull. 64 (2019) 1285-1292. DOI:10.1149/1.3570114 |
| [7] |
H. Song, X. Liu, B. Wang, Z. Tang, S. Lu, Sci. Bull. 64 (2019) 1788-1794. DOI:10.1016/j.scib.2019.10.006 |
| [8] |
W. Li, Y. Liu, B. Wang, et al., Chin. Chem. Lett. 30 (2019) 2323-2327. DOI:10.1016/j.cclet.2019.06.040 |
| [9] |
H. Ding, X.X. Zhou, J.S. Wei, et al., Carbon 167 (2020) 322-344. DOI:10.1016/j.carbon.2020.06.024 |
| [10] |
H. Jia, Z. Wang, T. Yuan, et al., Adv. Sci. 6 (2019) 1900397. DOI:10.1002/advs.201900397 |
| [11] |
H. Tetsuka, Chem. Rec. 20 (2020) 429-439. DOI:10.1002/tcr.201900063 |
| [12] |
K. Hola, M. Sudolska, S. Kalytchuk, et al., ACS Nano 11 (2017) 12402-12410. DOI:10.1021/acsnano.7b06399 |
| [13] |
D. Qu, M. Zheng, J. Li, Z. Xie, Z. Sun, Light-Sci. Appl. 4 (2015) 364. DOI:10.1038/lsa.2015.137 |
| [14] |
J.E. Gautrot, P. Hodge, D. Cupertino, M. Helliwell, New J. Chem. 30 (2006) 1801. DOI:10.1039/B608628D |
| [15] |
J. Feng, H. Dong, L. Yu, L. Dong, J. Mater. Chem. C 5 (2017) 5984-5993. DOI:10.1039/C7TC00631D |
| [16] |
M. Park, H.S. Kim, H. Yoon, et al., Adv. Mater. 32 (2020) 2000936. DOI:10.1002/adma.202000936 |
| [17] |
H.A. Nguyen, I. Srivastava, D. Pan, M. Gruebele, ACS Nano 14 (2020) 6127-6137. DOI:10.1021/acsnano.0c01924 |
| [18] |
H. Ding, J.S. Wei, P. Zhang, et al., Small 14 (2018) 1800612. DOI:10.1002/smll.201800612 |
| [19] |
X. Miao, D. Qu, D. Yang, et al., Adv. Mater. 30 (2018) 1704740. DOI:10.1002/adma.201704740 |
| [20] |
S. Lu, L. Sui, J. Liu, et al., Adv. Mater. 29 (2017) 1603443. DOI:10.1002/adma.201603443 |
| [21] |
K. Yuan, X. Zhang, R. Qin, et al., J. Mater. Chem. C 6 (2018) 12631-12637. DOI:10.1039/c8tc04468f |
| [22] |
F. Yuan, T. Yuan, L. Sui, et al., Nat. Commun. 9 (2018) 1-11. DOI:10.1155/2018/4957917 |
| [23] |
P. Nemes-Incze, Z. Osváth, K. Kamarás, L. Biró, Carbon 46 (2008) 1435-1442. DOI:10.1016/j.carbon.2008.06.022 |
| [24] |
S. Zhang, X. Yu, H. Yu, et al., ACS Appl. Mater. Inter. 6 (2014) 21880-21885. DOI:10.1021/am5061036 |
| [25] |
J. Di, J. Xiong, H. Li, Z. Liu, Adv. Mater. 30 (2018) 1704548. DOI:10.1002/adma.201704548 |
| [26] |
J. Schwan, S. Ulrich, V. Batori, H. Ehrhardt, S. Silva, J. Appl. Phys. 80 (1996) 440-447. DOI:10.1063/1.362745 |
| [27] |
Y. Jiang, B. Wang, F. Meng, Y. Cheng, C. Zhu, J. Colloid Interf. Sci. 452 (2015) 199-202. DOI:10.1016/j.jcis.2015.04.016 |
| [28] |
K. Jiang, Y. Wang, X. Gao, C. Cai, H. Lin, Angew Chem. Int. Ed. 57 (2018) 6216-6220. DOI:10.1002/anie.201802441 |
| [29] |
Z. Han, Y. Ni, J. Ren, et al., Nanoscale 11 (2019) 11577-11583. DOI:10.1039/c9nr03448j |
| [30] |
T. Zhang, J. Zhu, Y. Zhai, et al., Nanoscale 9 (2017) 13042-13051. DOI:10.1039/C7NR03570E |
| [31] |
Y. Chen, M. Zheng, Y. Xiao, et al., Adv. Mater. 28 (2016) 312-318. DOI:10.1002/adma.201503380 |
| [32] |
X. Li, S. Zhang, S.A. Kulinich, Y. Liu, H. Zeng, Sci. Rep. 4 (2014) 4976. |
| [33] |
Y.H. Yuan, Z.X. Liu, R.S. Li, et al., Nanoscale 8 (2016) 6770-6776. DOI:10.1039/C6NR00402D |
| [34] |
R. Das, S. Parveen, A. Bora, P. Giri, Carbon 160 (2020) 273-286. DOI:10.1016/j.carbon.2020.01.030 |
| [35] |
K. Yuan, X. Zhang, X. Li, et al., Chem. Eng. J. 397 (2020) 125487. DOI:10.1016/j.cej.2020.125487 |
| [36] |
S.B. Naghadeh, B. Luo, Y.C. Pu, et al., J. Phys. Chem. C 123 (2019) 4610-4619. DOI:10.1021/acs.jpcc.9b00711 |
| [37] |
D. Qu, D. Yang, Y. Sun, X. Wang, Z. Sun, J. Phys. Chem. Lett. 10 (2019) 3849-3857. DOI:10.1021/acs.jpclett.9b01575 |
| [38] |
W. Li, H. Guo, G. Li, et al., Nanoscale Horiz. 5 (2020) 928-933. DOI:10.1039/d0nh00053a |
| [39] |
M.A. Sk, A. Ananthanarayanan, L. Huang, K.H. Lim, P. Chen, J. Mater. Chem. C 2 (2014) 6954-6960. DOI:10.1039/C4TC01191K |
| [40] |
L. Wang, X. Zhang, K. Yang, L. Wang, C.S. Lee, Carbon 160 (2020) 298-306. DOI:10.1016/j.carbon.2020.01.029 |
| [41] |
B. Wang, J. Yu, L. Sui, et al., Adv. Sci. 8 (2020) 2001453. |
| [42] |
H. Li, S. Ye, J.Q. Guo, et al., Mater. Chem. C 7 (2019) 10605-10612. DOI:10.1039/c9tc03481a |
| [43] |
M. Sudolská, M. Otyepka, Appl. Mater. Today 7 (2017) 190-200. DOI:10.1016/j.apmt.2017.03.004 |
| [44] |
T. Lu, S. Manzetti, Struct. Chem. 25 (2014) 1521-1533. DOI:10.1007/s11224-014-0430-6 |
| [45] |
J.K. Cooper, C.D. Grant, J.Z. Zhang, J. Phys. Chem. A 117 (2013) 6043-6051. DOI:10.1021/jp312492v |
| [46] |
J. Liu, D. Li, K. Zhang, et al., Small 14 (2018) 1703919. DOI:10.1002/smll.201703919 |
| [47] |
S.A. Hill, S. Sheikh, Q. Zhang, et al., Nanoscale Adv. 1 (2019) 2840-2846. DOI:10.1039/c9na00293f |
| [48] |
H. Wang, M. Zhang, Y. Ma, et al., ACS Appl. Mater. Interfaces 12 (2020) 41088-41095. DOI:10.1021/acsami.0c11735 |
| [49] |
H.J. Li, X. Sun, F. Xue, et al., ACS Sustain. Chem. Eng. 6 (2018) 1708-1716. DOI:10.1021/acssuschemeng.7b02941 |
| [50] |
D. Li, P. Jing, L. Sun, et al., Adv. Mater. 30 (2018) 1705913. DOI:10.1002/adma.201705913 |