 2021, Vol. 32


b School of Chemistry and Chemical Engineering, Shanxi University, Taiyuan 030006, China;
c Key Laboratory of Chemical Biology and Molecular Engineering of Ministry of Education, Institute of Molecular Science, Shanxi University, Taiyuan 030006, China;
d Scientific Instrument Center, Shanxi University, Taiyuan 030006, China
Nowadays, with the in-depth study of life science, people have gradually realized the importance of many active small molecules in life processes, but how to accurately monitor the concentration and metabolic process of these active small molecules has always been a challenging scientific problem. As an important part of active small molecules, biothiols such as glutathione (GSH), cysteine (Cys) and homocysteine (Hcy) play a crucial role in various physiological and pathological processes [1-3]. GSH, which is the most abundant thiol in cells, plays a major anti-oxidation role in maintaining intracellular redox activities and regulating genes in cellular functions, and its abnormal concentration can cause atherosclerosis, lung damage, Alzheimer's disease and cancer [4-8]. As a precursor of GSH synthesis, Cys participates in protein synthesis, detoxification and metabolism [9, 10], and its abnormal level can give rise to hematopoietic dysfunction, neurotoxicity, lethargy and AIDS [11-15]. Hcy is an intermediate product in methionine metabolism to produce Cys, and it can directly or indirectly accelerate thrombosis so that high level of Hcy can lead to cardiovascular disease, osteoporosis, inflammatory bowel disease, pregnancy complications [16-18]. Therefore, each biothiol can be regarded as a marker of disease, and their differential detection and metabolic process monitoring are of great value for the diagnosis and treatment of related diseases.
Compared with the traditional analytical methods, fluorescent probes have been proved to be a very effective tool for detecting and visualizing small biological molecules in cells due to their advantages of high spatial and temporal resolution, non-invasiveness, high sensitivity and wide dynamic response range [19-22]. So far, many multi-signal fluorescent probes have been reported in discriminatively detecting different biothiols, and applied to multicolor imaging of cells or living tissues by means of confocal fluorescence imaging technology [23-34]. However, due to the similar structures and properties of different biothiols, especially only a single methylene unit difference in the structure of Hcy and Cys, and the concentration of Cys and Hcy far lower than the level of GSH in biological body [35-37], it is greatly difficult to distinguish Hcy and Cys, or Hcy/Cys and GSH, resulting in the reported fluorescent probes possessing the ability to simultaneously distinguish GSH, Hcy and Cys were extremely limited [38-40]. Therefore, the development of fluorescent probes that can distinguish GSH, Hcy and Cys is still a hot topic for researchers in this field.
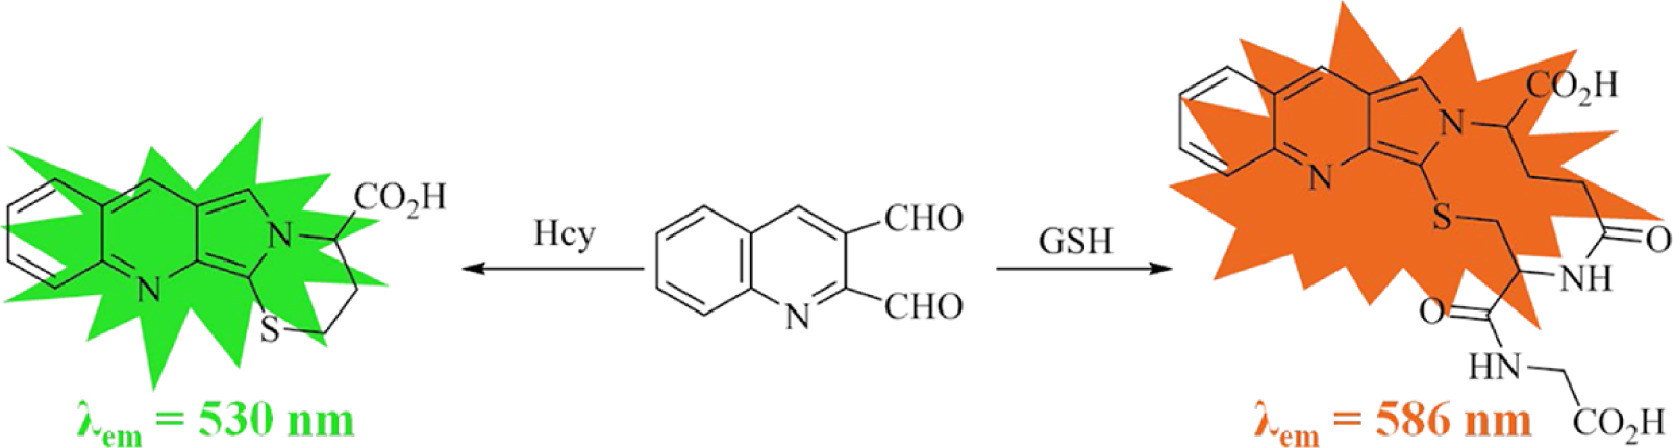
As early as 1989, the Neuschochocho-Tetri group had reported that o-phthaldialdehyde (OPA) reacted with GSH to generate a highly fluorescent cyclized adduct, and established a HPLC separation and fluorometric detection method for GSH [41]. Later, the Orwar group developed a 2, 3-naphthalenedicarboxaldehyde- based fluorescence detection method for GSH, and realized quantitative detection of GSH in single cells [42]. After decades of development, many GSH detection methods based on this strategy and their applications in food and biological samples have been reported. In 2018, our group, in cooperation with the Yoon group, reported the Naphthalene dicarboxaldehyde-based fluorescence probes for GSH and their applications in the diagnosis and mortality prediction of patients with sepsis [43]. In this work, we designed and synthesized a fluorescent probe based on quinoline-2, 3-dicarboxaldehyde (QDA). Different from the previously reported o-dialdehyde probes, QDA can not only generate cyclized adduct emitting orange fluorescence at 586 nm with GSH, but also produce another cyclized adduct emitting green fluorescence at 530 nm with Hcy. Therefore, QDA can realize the selective differentiation of GSH and Hcy in living cells at different signal channels, which has important guiding significance for the early diagnosis of diseases related to different biothiols.
The synthetic route of QDA was depicted in Scheme 1. QDA was prepared following the methods in the literature [44] and its structure was confirmed by NMR and MS analysis (Fig. S1 in Supporting information).

|
Download:
|
| Scheme 1. The synthetic route of QDA. | |
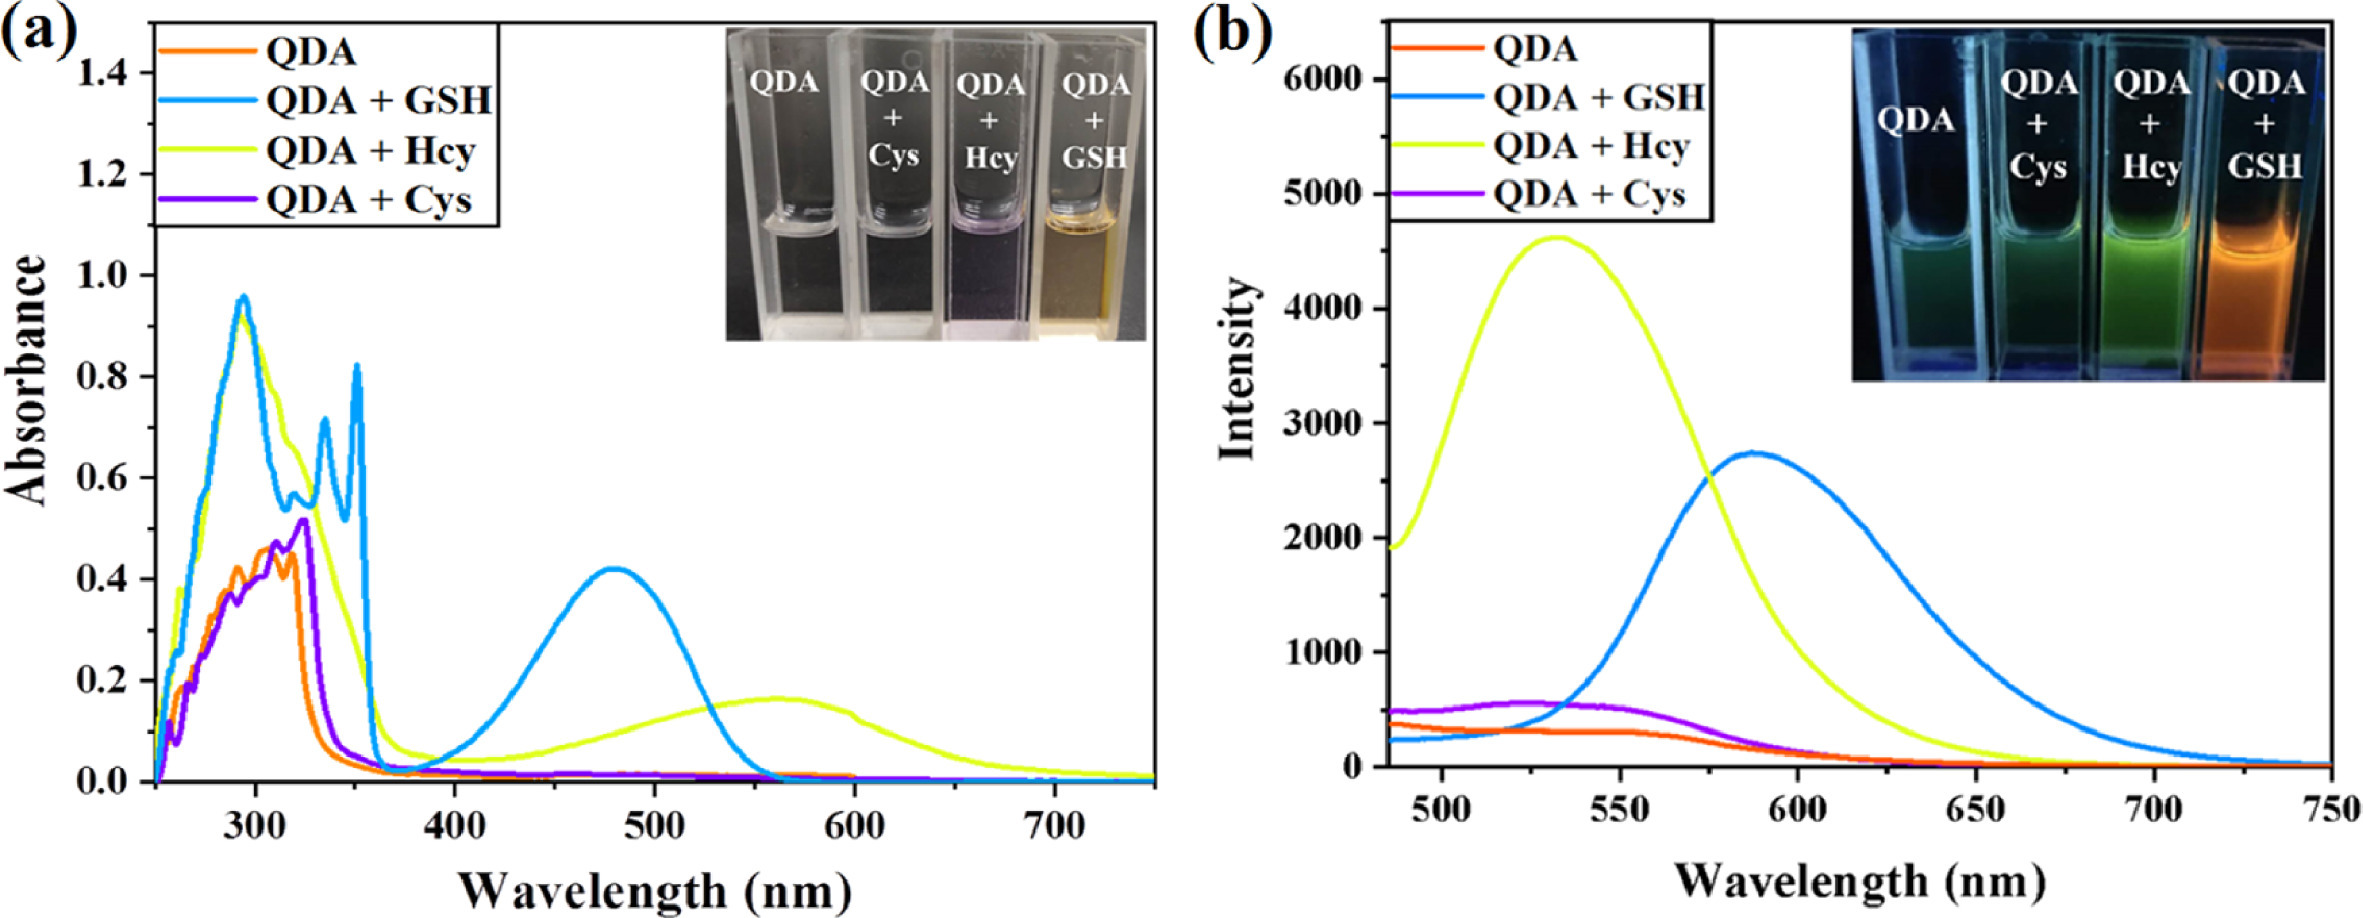
At the beginning, we measured the spectroscopic responses of QDA to different biothiols including GSH, Cys and Hcy in DMSO-PBS (1/1, v/v, pH 7.4). The solution of QDA was colorless and had a moderate absorption in 290–320 nm. The addition of GSH caused several strong absorptions in 294–351 nm and 470 nm, and the color of the solution changed to light orange. Likewise, Hcy also produced a strong absorption in 292 nm and a weak absorption in 558 nm, but the addition of Cys did not change the absorption spectrum of QDA (Fig. 1a). These results indicated that QDA was almost inert to Cys, and reacted with GSH and Hcy to generate different species. Subsequently, the fluorescent responses of QDA to different biothiols were carried out. As represented in Fig. 1b, QDA itself had little fluorescence at excitation of 470 nm. There was a unique orange fluorescent emission appearing at 586 nm upon addition of GSH (null = 0.033), while the addition of Hcy could produce a strong green fluorescence at 530 nm (null = 0.086), and no fluorescence was observed with the treatment of Cys, which showed that QDA could distinguish GSH and Hcy by means of fluorescence method. Here we explained the reason why 470 nm was selected as the excitation wavelength in the fluorescence spectrum of QDA to Hcy, because it could be seen from the excitation spectrum that 470 nm was the best excitation wavelength (Fig. S2 in Supporting information). To see how the three biothiols compete with one another in the reaction with QDA, the fluorescent spectrum of QDA upon addition of a mixture of the physiological concentration of three biothiols was measured, and the result showed that a new fluorescence emission peak at 572 nm appeared, which was actually a superposition of the fluorescence emission peaks at 530 nm and 586 nm (Fig. S3 in Supporting information). This indicated that both Hcy and GSH in the mixed system could respond to QDA simultaneously.

|
Download:
|
| Fig. 1. UV–vis (a) and fluorescent (b) spectra of QDA (30 μmol/L) upon the addition of GSH, Hcy and Cys (10 equiv.) in DMSO-PBS (1/1, v/v, pH 7.4). λex = 470 nm, slit: 5 nm/10 nm. Inset: visual (a) and fluorescent (b) color change of QDA after adding GSH, Hcy and Cys under ambient light (a) and 365 nm UV lamp light (b). | |
To further explore the sensitivity of QDA to GSH and Hcy, fluorescent titration experiments were studied in detail. It could be seen from Fig. S4 (Supporting information) that the fluorescent intensity at 586 nm gradually enhanced as the concentration of GSH increased, and there was a good linear relationship (R2 = 0.9979) when the concentration of GSH was between 0 and 200 μmol/L, and the detection limit was measured to be 0.25 μmol/L. For Hcy, in the same way, a good linear relationship (R2 = 0.9976) was also obtained between the fluorescence intensity at 530 nm and the concentration of Hcy (0–200 μmol/L) with the detection limit of 0.35 μmol/L (Fig. S5 in Supporting information). The above results displayed that QDA could specifically and quantitatively detected GSH and Hcy.
To gain the optimum detection conditions of QDA to GSH and Hcy, time-dependent and pH-selective fluorescence experiments were performed. Fig. S6a (Supporting information) showed that the fluorescent signal at 586 nm reached the maximum within 8 min in the presence of GSH (10 equiv.), and the intensity was basically stable for a long period of time. QDA reacted slightly slower with Hcy (10 equiv.) than GSH, and the fluorescent signal at 530 nm was maximized within 30 min (Fig. S6b in Supporting information). Therefore, in the spectroscopic test experiments, the response times of QDA to GSH and Hcy were set at 8 min and 30 min, respectively. Furthermore, the fluorescent responses of QDA to GSH and Hcy at different pH values (2.0–10.0) were carried out (Fig. S7 in Supporting information). In the absence of GSH or Hcy, QDA had basically no fluorescence, and the fluorescent intensity of QDA was almost unchanged in the entire pH range. However, in the presence of GSH or Hcy, there was a significant fluorescent enhancement in the pH range of 6.0 to 10.0. In addition, the mixture solution had the strongest fluorescent intensity around pH 7.4 compared to other pH. The results indicated that QDA had the ability to detect GSH and Hcy under physiological environment.
In order to expand the application of QDA in biological systems, it is necessary to verify the specific selection of QDA to GSH and Hcy in a complex environment. We have researched the fluorescent response of QDA towards various biologically relevant species, including amino acids (Ala, Glu, Asp, Leu, Ile, Lys, Gly, Gln, Tyr, His, Trp, Thr, Phe, Asn, Met, Val, Pro, Ser, Arg) and some common ions (Na+, Ca2+, Mg2+, K+, Cu2+, Mn2+, Zn2+, PO43−, HSO3−, HS−, Cl−, I−, Br−, SO42−, CO32−). As shown in Fig. S8 (Supporting information), only GSH and Hcy could cause drastic fluorescent emission (586 nm for GSH, 530 nm for Hcy), while other amino acids and ions had almost no effect on the fluorescent spectrum of QDA. In addition, the competitive experiments also displayed that other analytes did not interfere with the detection of QDA to GSH and Hcy (Fig. S9 in Supporting information), which proved that QDA had high selectivity to GSH and Hcy and the potential to be applied in complex biological systems.
The response mechanism of QDA to GSH and Hcy was assumed as represented in Scheme 2. According to the reported reaction mechanism of OPA and GSH [45], we speculated that QDA could react with GSH or Hcy to form thiazino[3′, 2′: 1, 2]pyrrolo[3, 4-b]quinoline derivatives due to amino and sulfhydryl functional group of GSH or Hcy possessing the reactivity with aldehyde, and the supposed mechanism was further confirmed by1H NMR and MS analysis of adduct of QDA and GSH (or Hcy). As shown in Fig. S10 (Supporting information), the protons of aldehyde groups of QDA appeared at 10.67 and 10.26 ppm in 1H NMR spectrum. When GSH or Hcy was added to the DMSO‑d6 solution of QDA, the proton signals of aldehyde groups disappeared and new proton signals appeared at 6.54–6.11 ppm, which indicated that both aldehyde groups of QDA were involved in the reaction. Moreover, MS analysis of the adduct of QDA with GSH also supported the generation of thiazino[3′, 2′: 1, 2]pyrrolo[3, 4-b]quinoline derivative, the peak at m/z 457.1199 was observed (Fig. S11 in Supporting information), corresponding to [QDA-GSH + H]+, calcd. for C21H21N4O6S: 457.1176. Similarly, a peak of m/z 285.0705 was observed from MS spectrum of the adduct of QDA with Hcy (Fig. S12 in Supporting information), corresponding to [QDA-Hcy + H]+, calcd. for C15H13N2O2S: 285.0692. Therefore, the speculated mechanism was correct and supported the spectral experimental results.

|
Download:
|
| Scheme 2. The response mechanism of QDA to GSH and Hcy. | |
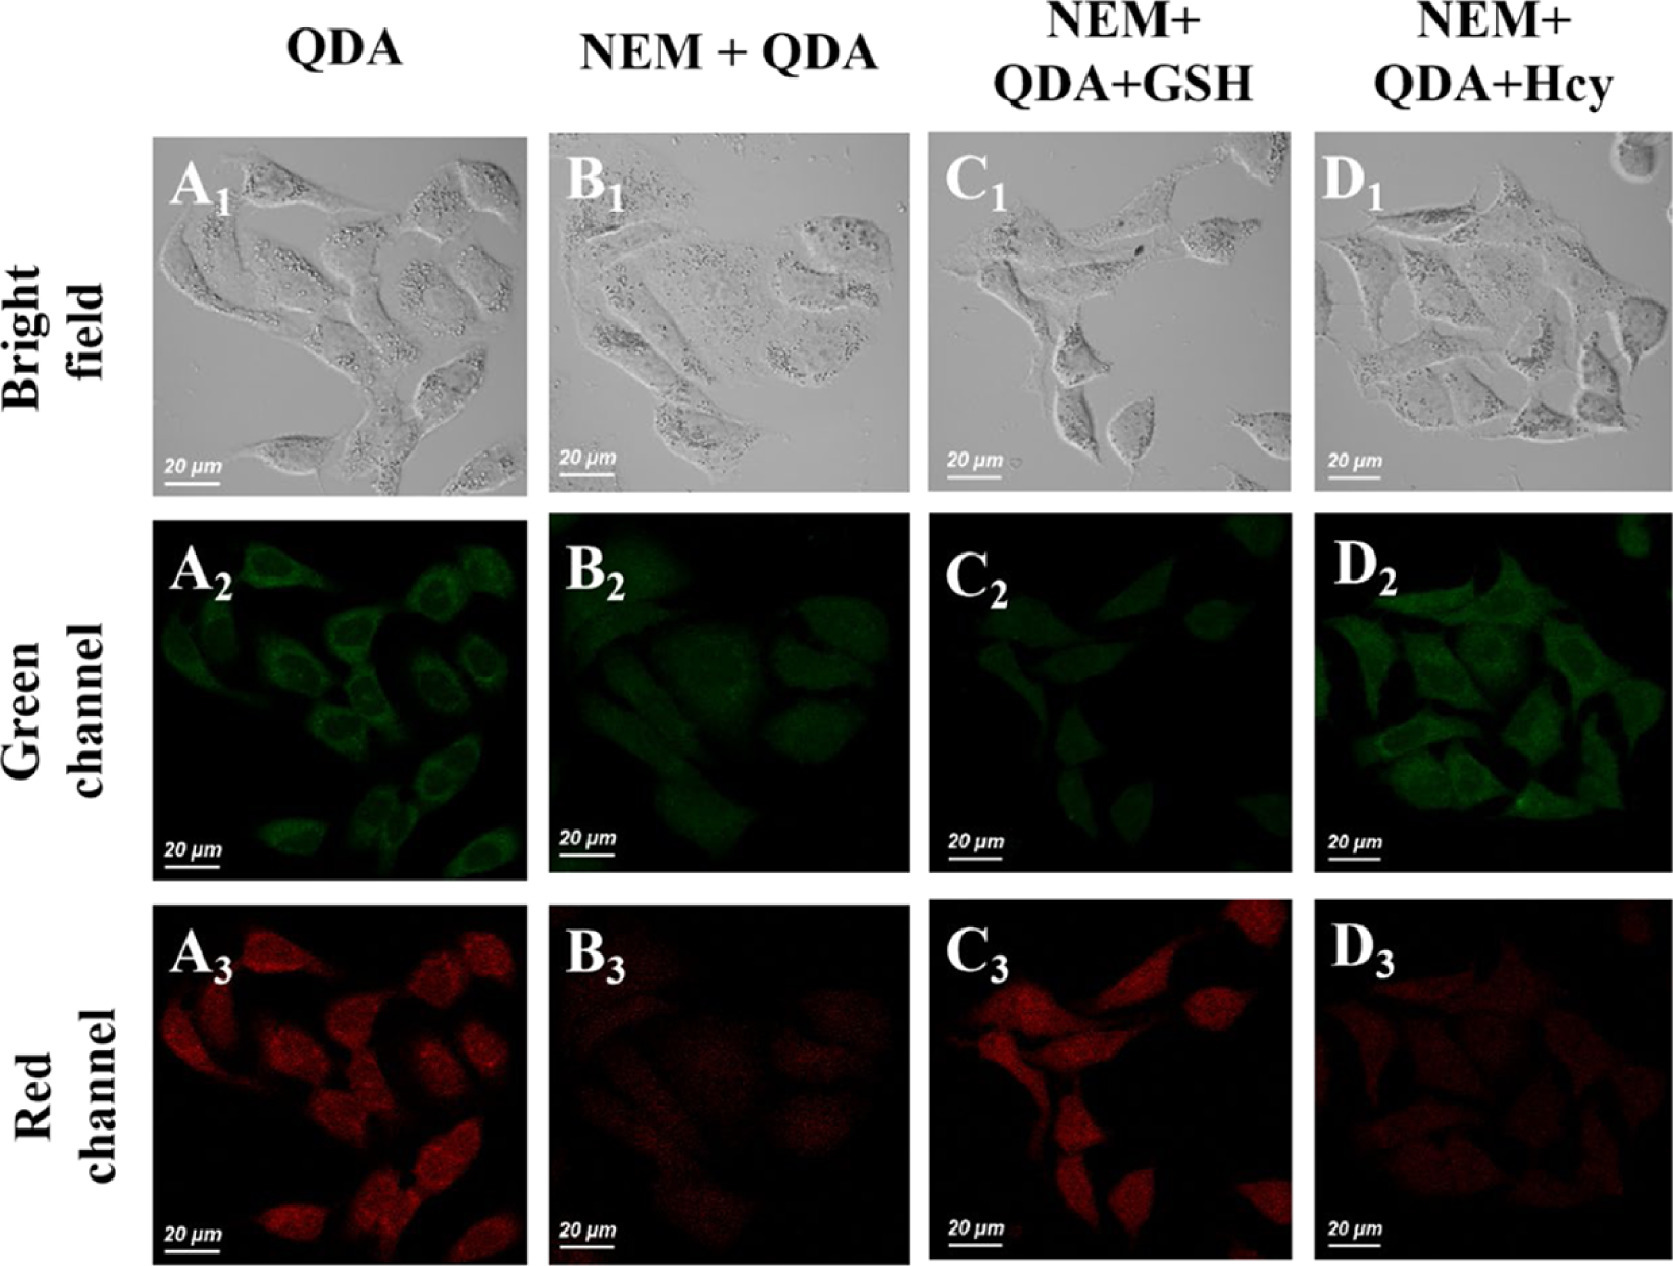
Inspired by excellent performance of QDA in distinguishing GSH and Hcy in vitro, we further evaluated the applicability of QDA in biological systems. First, the toxicity of QDA was tested by methyl thiazolyl tetrazolium (MTT) assay [46], and the results demonstrated that QDA was low cytotoxic to A549 cells below 20 μmol/L concentration within 10 h (Fig. S13 in Supporting information). Next, the confocal images of QDA to GSH and Hcy in A549 cells were investigated. As shown in Fig. 2, the cells were incubated with QDA (20 μmol/L) for 20 min, there was conspicuous fluorescence in green channel and red channel. Moreover, the cells were pretreated with NEM (1 mmol/L) for 30 min and incubated with QDA (20 μmol/L) for 20 min, the fluorescent intensity of green channel and red channel became weak. However, the cells pre-treated with NEM were incubated with GSH (20 μmol/L, 30 min) and QDA (20 μmol/L, 20 min), a significant fluorescence enhancement in red channel was observed. Likewise, the cells pre-treated with NEM were incubated with Hcy (20 μmol/L, 30 min) and QDA (20 μmol/L, 20 min), a significant fluorescence enhancement in green channel was observed. The above experimental results showed that red fluorescence emission was generated by the adduct of QDA with intracellular GSH, and green fluorescence emission was attributed to intracellular Hcy. Hence, QDA could distinguish the imaging of GSH and Hcy inside cells in different fluorescent channels.

|
Download:
|
| Fig. 2. Confocal images of QDA responding to endogenous and exogenous GSH and Hcy in A549 cells. (A1–A3) A549 cells incubated with QDA (20 μmol/L) for 20 min. (B1–B3) A549 cells pretreated with NEM (1 mmol/L) for 30 min and then incubated with QDA (20 μmol/L) for 20 min. (C1–C3) A549 cells pretreated with NEM (1 mmol/L) for 30 min, then incubated with GSH (20 μmol/L) for 30 min, and finally incubated with QDA (20 μmol/L) for 20 min. (D1–D3) A549 cells pretreated with NEM (1 mmol/L) for 30 min, then incubated with Hcy (20 μmol/L) for 30 min, and finally incubated with QDA (20 μmol/L) for 20 min. Green channel: λem = 510–550 nm (λex = 458 nm); red channel: λem = 600–630 nm (λex = 488 nm). Scale bar: 20 μm. | |
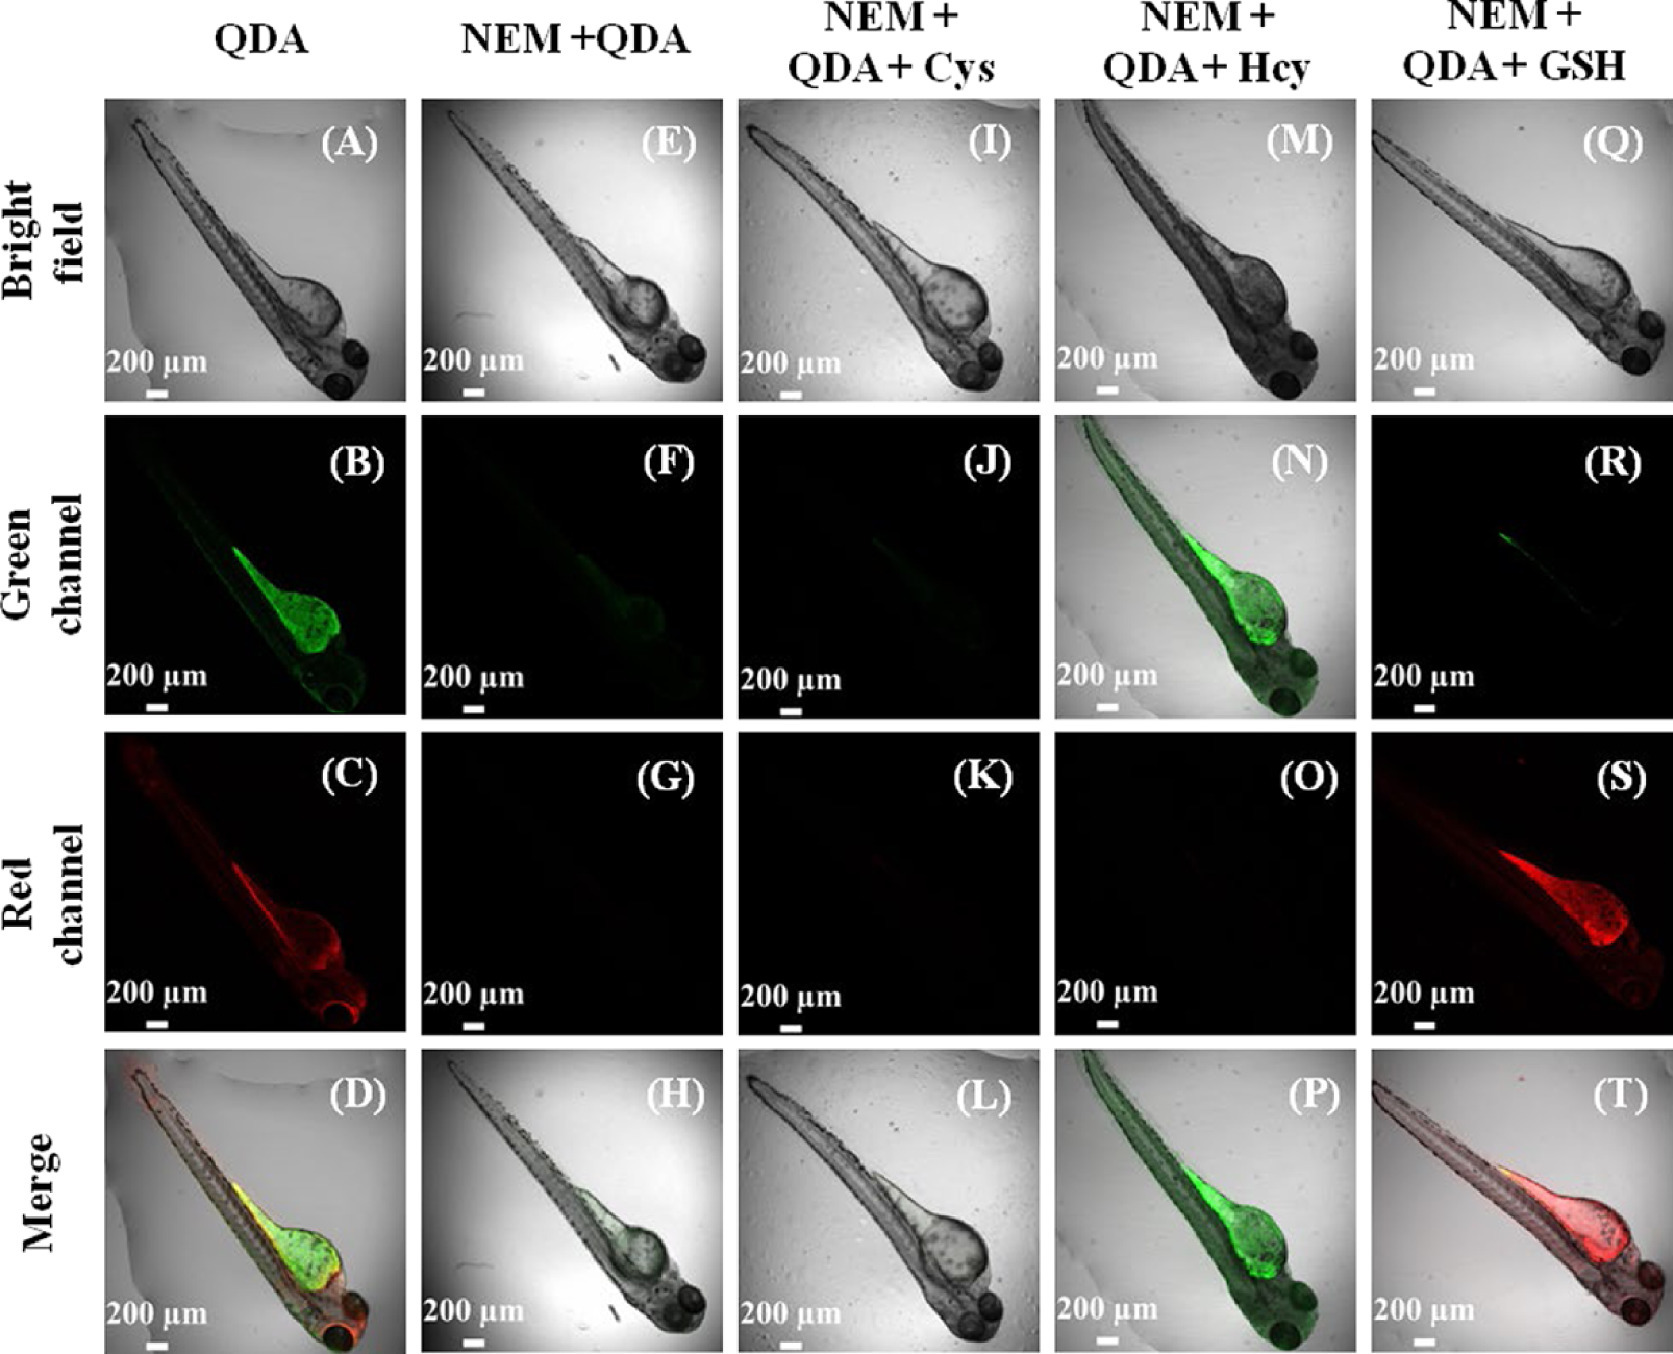
Based on the excellent imaging results of QDA to intracellular GSH and Hcy, QDA was further used for zebrafish imaging. As shown in Fig. 3, a significant fluorescence was observed in green channel and red channel after zebrafish was incubated with QDA (20 μmol/L) for 30 min. Nevertheless, zebrafish pretreated with NEM (200 μmol/L) was loaded with QDA (20 μmol/L) for 30 min, there was no fluorescence emission in green channel and red channel, which displayed that the fluorescence emission shown in Figs. 3B-D was caused by the adducts of QDA and biothiols in zebrafish. When zebrafish pretreated with NEM (200 μmol/L, 30 min) and Cys (20 μmol/L, 30 min) was loaded with QDA (20 μmol/L, 30 min), all the same no fluorescence was observed. However, zebrafish pretreated with NEM (200 μmol/L, 30 min) and Hcy (20 μmol/L, 30 min) was loaded with QDA (20 μmol/L, 30 min), only green fluorescence emission was observed in green channel. Similarly, only red fluorescence emission was observed in red channel after zebrafish was continuously loaded with NEM (200 μmol/L, 30 min), GSH (20 μmol/L, 30 min) and QDA (20 μmol/L, 30 min). These results indicated that QDA could be used to differentiate imaging of Hcy and GSH of living bodies through different fluorescent channels.

|
Download:
|
| Fig. 3. Confocal images of QDA responding to endogenous and exogenous Hcy and GSH in zebrafish. (A-D) Zebrafish pretreated with QDA (20 μmol/L, 30 min). (E-H) Zebrafish pretreated with NEM (200 μmol/L, 30 min) and then incubated with QDA (20 μmol/L, 30 min). (I-T) Zebrafish pretreated with NEM (200 μmol/L, 30 min), and then respectively incubated with Cys, Hcy and GSH (20 μmol/L, 30 min), and finally incubated with QDA (20 μmol/L, 30 min). Green channel: λem = 510–550 nm (λex = 458 nm); red channel: λem = 600–630 nm (λex = 488 nm). Scale bar: 200 μm. | |
In conclusion, we designed and synthesized a based on o-dialdehyde fluorescent probe, quinoline-2, 3-dicarbaldehyde (QDA), and proved that QDA reacted with GSH to form a thiazino[3′, 2′: 1, 2]pyrrolo[3, 4-b]quinoline derivative emitting orange fluorescence, but generated another thiazino[3′, 2′: 1, 2]pyrrolo[3, 4-b]quinoline derivative emitting green fluorescence with Hcy. This speciality could be used to differentiate GSH and Hcy, which was different from the previous reported o-dialdehyde probes specifically detecting GSH. Moreover, QDA had the advantage of high selectivity, low limits of detection and low cytotoxicity to suit the applications in biological systems. Furthermore, cells and zebrafish imaging experiments revealed QDA could distinctively image endogenous GSH and Hcy through different fluorescent channels, which was helpful for diagnosis study of the related diseases to GSH and Hcy.
Declaration of competing interestThe authors declare no conflict of interest.
AcknowledgmentsWe thank the National Natural Science Foundation of China (Nos. 21672131, 21775096, 21907062), One Hundred People Plan of Shanxi Province, Shanxi Province "1331 Project" Key Innovation Team Construction Plan Cultivation Team (No. 2018-CT-1), 2018 Xiangyuan County Solid Waste Comprehensive Utilization Science and Technology Project (No. 2018XYSDJS-05), the Shanxi Province Foundation for Selected (2019), Innovative Talents of Higher Education Institutions of Shanxi (2019), Scientific and Technological Innovation Programs of Higher Education Institutions in Shanxi (No. 2019L0031), Key R&D Program of Shanxi Province (No. 201903D421069), Natural Science Foundation of Shanxi Province of China (No. 201901D111015), Shanxi Province Foundation for Returness (No. 2017-026), Program for the Innovative Talents of Higher Education Institutions of Shanxi (2019), Shanxi Collaborative Innovation Center of High Value-added Utilization of Coalrelated Wastes (No. 2015-10-B3) and Scientific Instrument Center of Shanxi University (No. 201512).
Supplementary materialsSupplementary material associated with this article can be found, in the online version, at doi:10.1016/j.cclet.2021.05.016.
| [1] |
R.W.G. Watson, O.D. Rotstein, A.B. Nathens, A.P.B. Dackiw, Surgery 120 (1996) 150-158. |
| [2] |
Q. Miao, Q. Li, Q. Yuan, et al., Anal. Chem. 87 (2015) 3460-3466. |
| [3] |
C.X. Yin, F.J. Huo, J.J. Zhang, et al., Chem. Soc. Rev. 42 (2013) 6032-6059. |
| [4] |
D.M. Townsend, K.D. Tew, H. Tapiero, Biomed. Pharmacother. 57 (2003) 145-155. |
| [5] |
C.B. Pocernich, D.A. Butterfield, BBA Mol. Basis Dis. 1822 (2012) 625-630. |
| [6] |
I. Rahman, S.K. Biswas, L.A. Jimenez, M. Torres, H.J. Forman, Antioxid. Redox Signaling 7 (2005) 42-59. |
| [7] |
J.M. Estrela, A. Ortega, E. Obrador, Crit. Rev. Clin. Lab. Sci. 43 (2006) 143-181. |
| [8] |
S. Lee, J. Li, X. Zhou, J. Yin, J. Yoon, Coord. Chem. Rev. 366 (2018) 29-68. |
| [9] |
E. Weerapana, C. Wang, G.M. Simon, et al., Nature 468 (2010) 790-795. |
| [10] |
E.C. Lien, C.A. Lyssiotis, A. Juvekar, et al., Nat. Cell Biol. 18 (2016) 572-578. |
| [11] |
P. Allain, A. Lebouil, E. Cordillet, et al., Neurotoxicology 16 (1995) 527-529. |
| [12] |
Y.M. Go, D.P. Jones, Free Radical Biol. Med. 50 (2011) 495-509. |
| [13] |
B.D. Paul, J.I. Sbodio, R. Xu, et al., Nature 509 (2014) 96-100. |
| [14] |
Y.K. Yue, F.J. Huo, P. Ning, et al., J. Am. Chem. Soc. 139 (2017) 3181-3185. |
| [15] |
R. Zhang, J.X. Yong, J.L. Yuan, Z.P. Xu, Coord. Chem. Rev. 408 (2020) 213182. |
| [16] |
B. Hooshmand, T. Polvikoski, M. Kivipelto, et al., Brain 136 (2013) 2707-2716. |
| [17] |
Kaluzna-Czaplinska J., E. Zurawicz, M. Michalska, J. Rynkowski, Acta Biochim. Pol. 60 (2013) 137-142. |
| [18] |
H.Y. Lee, Y.P. Choi, S. Kim, et al., Chem. Commun. 50 (2014) 6967-6969. |
| [19] |
J.L. Kolanowski, F. Liu, E.J. New, Chem. Soc. Rev. 47 (2018) 195-208. |
| [20] |
D. Wu, A.C. Sedgwick, T. Gunnlaugsson, et al., Chem. Soc. Rev. 46 (2017) 7105-7123. |
| [21] |
A.C. Sedgwick, L. Wu, H.H. Han, et al., Chem. Soc. Rev. 47 (2018) 8842-8880. |
| [22] |
L. Wu, A.C. Sedgwick, X. Sun, et al., Acc. Chem. Res. 52 (2019) 2582-2597. |
| [23] |
X.F. Yang, Y.X. Guo, R.M. Strongin, Angew. Chem. Int. Ed. 50 (2011) 10690-10693. |
| [24] |
J. Liu, Y.Q. Sun, Y.Y. Huo, et al., J. Am. Chem. Soc. 136 (2014) 574-577. |
| [25] |
L.Y. Niu, Y.Z. Chen, H.R. Zheng, et al., Chem. Soc. Rev. 44 (2015) 6143-6160. |
| [26] |
Y.K. Yue, F.J. Huo, X.Q. Li, et al., Org. Lett. 19 (2017) 82-85. |
| [27] |
C.X. Yin, K.M. Xiong, F.J. Huo, J.C. Salamanca, R.M. Strongin, Angew. Chem. Int. Ed. 56 (2017) 13188-13198. |
| [28] |
X.L. Liu, L.Y. Niu, Y.Z. Chen, Y.X. Yang, Q.Z. Yang, Biosens. Bioelectron. 90 (2017) 403-409. |
| [29] |
Y. Yang, Y. Feng, F.Z. Qiu, et al., Anal. Chem. 90 (2018) 14048-14055. |
| [30] |
S.V. Mulay, Y. Kim, M. Choi, et al., Anal. Chem. 90 (2018) 2648-2654. |
| [31] |
K.M. Xiong, F.J. Huo, J.B. Chao, Y.B. Zhang, C.X. Yin, Anal. Chem. 91 (2019) 1472-1478. |
| [32] |
Y.K. Yue, F.J. Huo, F.Q. Cheng, et al., Chem. Soc. Rev. 48 (2019) 4155-4177. |
| [33] |
Y.F. Kang, L.Y. Niu, Q.Z. Yang, Chin. Chem. Lett. 30 (2019) 1791-1798. |
| [34] |
Y.F. Huang, Y.B. Zhang, F.J. Huo, Y. Wen, C.X. Yin, Sci. China Chem. 63 (2020) 1742-1755. |
| [35] |
J. Shao, H. Sun, H. Guo, et al., Chem. Sci. 3 (2012) 1049-1061. |
| [36] |
Y.K. Yue, F.J. Huo, P. Yue, et al., Anal. Chem. 90 (2018) 7018-7024. |
| [37] |
Y.B. Zhang, Y. Zhang, Y.K. Yue, et al., Sens. Actuators B 320 (2020) 128348. |
| [38] |
G.X. Yin, T.T. Niu, Y.B. Gan, et al., Angew. Chem. Int. Ed. 57 (2018) 4991-4994. |
| [39] |
G.X. Yin, T.T. Niu, T. Yu, et al., Angew. Chem. Int. Ed. 58 (2019) 4557-4561. |
| [40] |
Y.F. Huang, Y.B. Zhang, F.J. Huo, et al., J. Am. Chem. Soc. 142 (2020) 18706-18714. |
| [41] |
B.A. Neuschwander-Tetri, F.J. Roll, Anal. Biochem. 179 (1989) 236-241. |
| [42] |
O. Orwar, H.A. Fishman, N.E. Ziv, R.H. Scheller, R.N. Zare, Anal. Chem. 67 (1995) 4261-4268. |
| [43] |
J. Li, Y. Kwon, K.S. Chung, et al., Theranostics 8 (2018) 1411-1420. |
| [44] |
S.P. Chavan, K. Pasupathy, S. Rasapalli, M.S. Venkatraman, Synth. Commun. 34 (2004) 3099-3110. |
| [45] |
O. Orwar, M. Sandberg, I. Jacobson, M. Sundahl, S. Folestad, Anal. Chem. 66 (1994) 4471-4482. |
| [46] |
J.C. Stockert, R.W. Horobin, L.L. Colombo, A. Blázquez-Castro, Acta Histochem 120 (2018) 159-167. |