 2021, Vol. 32


Due to the prohibition of brominated flame retardants and the rapid development of demand for flame retardants, organophosphate esters (OPEs) reached 20% of the market share of flame retardants in Europe in 2006 [1]. To date, OPEs have been detected in a variety of environmental media worldwide, such as surface water [2-4], sea water [5], lake [6], urban and indoor environment [7, 8], road greening belt [9], organisms [10, 11] and human beings [12]. Unfortunately, some OPEs have been confirmed to have obvious neurotoxicity, reproductive toxicity, carcinogenicity and genotoxicity [13]. In addition, TCEP, TCPP and TDCPP have been identified as persistent organic compounds [14]. China, with its large population, may become a large consumer of OPEs in the future.
Many studies have reported surveys of OPEs in surface water and sediment [15, 16], while little studies have investigated the partitioning behavior of OPEs in water-suspended particulate matter (SPM)-sediment. However, Brandsma et al. (2015) [17] found that the concentration of OPEs in SPM was 2–12 times higher than that in sediment in the water body in the Western Schelde Estuary of the Netherlands. Therefore, SPM is an important carrier of pollutants in the water phase, which needs to be paid attention to by researchers. This has also been confirmed by Zhang et al. [15]. As we know, the structural differences among OPEs lead to a variety of chemical and physical properties that result in differences in their environmental behavior. TBEP and halogenated OPEs have higher solubility and their octanol-water partition coefficient (logKOW) values < 4 which would lead to redistribution between different media during migration and enrichment in high-organic-carbon sediments [18]. Chlorinated OPEs are more resistant to biodegradation than alkyl and aryl phosphates [19, 20]. To date, the partitioning behavior of OPEs in the aquatic environment and their key influencing factors were significantly different in the very limited researches. Wang et al. (2018) [16] studied the partition of OPEs in the water and sediment of Taihu Lake and found that calculated organic carbon normalized partition coefficients (logKOC) of OPEs displayed significant correlation with their logKOW in distribution of water and sediment. Cao et al. (2017) [21] estimated the partition of OPEs between particles and pore water of sediment using an equilibrium model and found that OPEs were predicted to largely vary in their distribution in porewater and particles. Therefore, extensive researches are necessary to fully understand the influence of physical-chemical properties of OPEs on their partitioning behaviors in different aqueous environments.
The Minjiang River is the largest tributary of the Yangtze River, with a length of 1279 km, an area of 133, 500 square kilometers and an annual average runoff of over 900 billion cubic meters, passing through 36 counties and 8 cities whose population accounts for approximately 15% of the total population of Sichuan Province. Along the main stream of the Minjiang River, the towns are dense, and arable land is concentrated in the hilly basin area below Pengshan. The main industrial cities include Chengdu, Leshan and Yibin, among which Chengdu is the center of economy, culture, information and transportation in western China, which are possible sources of OPEs in the Minjiang River. It is worth noting that there are dozens of paper mills in the Pengshan-Qingshen section and many metallurgical, building material and paper-making enterprises in the Jinkou-Shawan section of the middle and lower reaches of the Dadu River, and the sections of the Dadu River from Leshan to Yibin and from Shawan to Leshan are the main transportation channels in Sichuan Province, which may be point sources of OPEs in the Minjiang River. It was reported that several perfluoroalkyl and polyfluoroalkyl substances (PFASs) were present in the water and sediment of the Minjiang River and the annual emission flux was 1.443 t/a [22], which means the Minjiang River has been polluted by the organic pollutants. But the study of the level, distribution and partitioning behavior of emerging organic pollutant–OPEs in the Minjiang River is blank. This paper aims to (1) investigate the occurrence and levels of OPEs in the main stream of the Minjiang River; (2) assess the distribution rule of OPEs in the surface water-SPM-sediment matrix; and (3) analyze the main sources and influencing factors of OPEs in the Minjiang River.
The main reagents, such as ethyl acetate, acetone, hexane and acetonitrile, were high-performance liquid chromatography (HPLC) grade (Kelon Chemical Corp., China). The standard solution (Sigma Aldrich Corp., U. S. A.) included tri-n-butyl phosphate (TnBP), tris-(2-ethylhexyl)-phosphate (TEHP), tris-(2-butoxyethyl)-phosphate (TBEP), triphenyl phosphate (TPhP), tris-(2-chloroethyl)-phosphate (TCEP) and tris-(2-chloroisopropyl)-phosphate (TCPP). Copper, aluminium oxide, silica gel, Na2SO4 and other chemicals were purchased from Kelon Chemical Corp., China. Deionized water was obtained from Milli-Q equipment.
The sampling sites were set along the Dujiang Yan (A1) -Chongzhou (A2) -Xinjin (A3) -Chengdu (A4) -Pengshan (A5) -Meishan (A6, A7) -Leshan (A8-A11) -Yibin (A12) sections, through which the Minjiang River passes from north to south. Site A10 is located at approximately 200 m below the confluence of the Dadu River, Qingyi River and Jinjiang River. Site B1 and Site B2 are located at the Qingyi River and the Dadu River, respectively. No suspicious point source was observed around the sampling sites. In October 2016, 14 surface water samples were collected. In November 2017, 14 water samples and 10 sediment samples were collected. Ten sediment samples were collected at sites A4–A6, A8–A12, B1 and B2 because it was not possible or easy to obtain sediment samples at other sites. A 3 L stainless steel water sampler was used to collect surface water samples 0.5 m below the water surface in the middle of a bridge spanning the river, according to the river width and vertical depth. Parallel samples were collected at each site.
The procedures for extraction and clean-up of the water and sediment samples followed a previously described method with minor modifications [23]. Each sample was pretreated after spiking with a surrogate standard (100 ng of triphenyl phosphate-d15 (TPhP-d15)). The surface water sample was passed through a 0.45 μm quartz filter to obtain SPM and water samples. Solid-phase extraction with a C18 column was used to enrich the target substances in the water samples. The C18 column was eluted with 10 mL hexane for removal of impurities and then with 10 mL ethyl acetate/acetone (v/v, 4:3) for elution of the target substances. The eluent was concentrated with vacuum-condensing equipment after drying with anhydrous sodium sulfate. The final volume was adjusted to 100 μL for gas chromatography-mass spectrometry (GC–MS) analysis.
The SPM samples were freeze-dried, soaked in 20 mL ethyl acetate/acetone (v/v, 3:2) for 12 h, and ultrasonically extracted twice for 30 min. Then, they were concentrated to approximately 1 mL with vacuum-condensing equipment and loaded onto an activated aluminium oxide/silica gel (v/v, 3:1) column. The column was first eluted with 20 mL hexane to remove impurities, then with 20 mL ethyl acetate/acetone (v/v, 3:2), and the eluate (ethyl acetate/acetone) was collected. The solvent extracts were concentrated to 100 μL for GC–MS analysis.
Organic compounds in SPM (particulate organic carbon, POC): Some of the filter samples were freeze dried, and then 8 mm2 portions were cut with a circular cutter and placed in a sample slot. Under pure helium and oxygen-free conditions, the organic carbon was volatilized via a temperature program. Helium-oxygen mixed gas entered the system. The elemental carbon was converted to CO2 in an oxidation furnace. All the gas entered the reduction furnace and reacted to form CH4. A hydrogen flame ionization detector (FID) was used to quantify its content. The methane peak was calibrated with standard gas (CH4). The measured data were multiplied by 1.724 to obtain the quantity of organic matter in the SPM.
By measuring the content of OPEs in surface water, SPM and sediments, as well as the content of organic matter in SPM and sediments, the water-SPM and water-sediment distribution coefficients were calculated. The distribution coefficients were calculated as follows (Eqs. 1 and 2):

|
(1) |
Kd: equilibrium coefficient between water-sediment/SPM (cm3/g), Cs: the content of OPEs in sediment/SPM at equilibrium (ng/g), Cw: the content of OPEs in surface water at equilibrium (ng/L).

|
(2) |
KOC: standardized partition coefficient of organic carbon (cm3/g), fOC: content of organic carbon in sediment/suspended particulate matter (%)
Detailed analytical parameters were similar with those in Wu et al. (2019) [23] and Yin et al. (2020) [24]. The GC was equipped with a SH-Rxi-5Sil MS capillary column (30 m × 0.25 μm × 0.25 mm, Shimadzu, Japan) and operated with a 280℃ inlet temperature using splitless injection. The MS source was electron impact (EI), and it was operated in selected ion monitoring (SIM) mode. The GC oven temperature was held at 50℃ for 1 min, increased to 200℃ at 15 ℃/min and held for 1 min, increased to 250℃ at 4.00 ℃/min, and then increased to 300℃ at 20 ℃/min and held for 4 min. The interface temperature was 280℃, and the ion source temperature was 200℃.
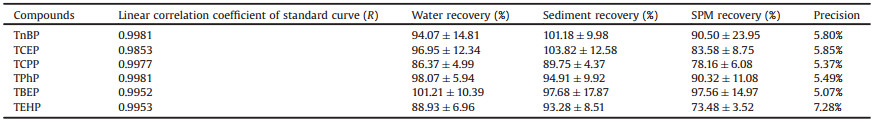
Thorough QA/QC procedures for OPE analysis were conducted to ensure data quality. To evaluate the recovery efficiencies of the analytical procedures, all samples were spiked with an internal standard (TPhP-d15), and the accuracy was evaluated by their recoveries. The concentrations of 6 OPEs were determined by an external standard method. The correlation coefficients of the standard curves of the six OPE monomers were all greater than 0.985. The recoveries of six OPEs in spike experiments and the internal standard in all samples were favorable (Table 1). For instrumental analysis, a standard sample was tested every day before actual samples were introduced. Actual sample analysis was carried out only when the response difference between the standard sample for that day and that for the previous day was less than 15%. The instrument detection limits for the target OPEs were 0.07−0.41 ng, and the instrument precision was 5.07%–7.28%, which was in accordance with the quantitative requirements of the laboratory. To test the potential background contamination, procedure blanks and matrix blanks were conducted. Only TnBP was detected in the blanks, and the level of TnBP found in the blanks was < 5% of the concentrations measured in all samples, which meant it was negligible.
|
|
Table 1 Linear correlation coefficients, recoveries and instrument precision in the present study. |
Statistical analyses were performed using statistical package for the social sciences (SPSS) Version 18.0 for Windows. Analysis of variance (ANOVA) was used to investigate significant differences in OPE concentrations between groups of sampling locations. Pearson's correlation analysis was used to investigate the relationships between OPEs. Statistical significance was set at P < 0.05.
Each OPE was detected in all water, SPM and sediment samples (Fig. 1). The average concentrations of Σ6OPEs in Minjiang River surface water, SPM and sediments were 199.32±124.95 ng/L, 38463.79±45641.89 ng/g dw, 76.45±28.00 ng/g dw, respectively. The concentration of OPEs in SPM was 2–3 orders of magnitude higher than those in water and sediment, which indicated that OPE pollution in SPM should be addressed rather than ignored.

|
Download:
|
| Fig. 1. Concentrations of ∑6OPEs in surface water, SPM and sediments. | |
The Σ6OPE levels in water samples in the present study were lower than those in urban surface water samples in Beijing, China (3.24−10945 ng/L) [25], the Songhua River, China (5−3700 ng/L) [26], the Pearl River Estuary, China (1100−2500 ng/L) [27]), 40 major rivers entering into the Bohai Sea, China (9.6−1549 ng/L, mean: 300 ng/L) [28] and rivers in Australia (maximum concentration: 500 ng/L) [29], but higher than those from Italy (average: 165 ng/L) [30]. To date, there have been few studies about OPEs in SPM. The median level of Σ11OPEs in SPM from the Pearl River Delta was 54.6 ng/g dw [15]. In a pelagic and benthic food web of the Western Scheldt Estuary, the OPE levels in SPM, ranging from 1.2±0.9 ng/g dw to 28±34 ng/g dw, were 3–32 times higher than those in sediment [17]. Compared with these data, higher concentrations of OPEs in SPM were found in this study. In sediment samples, the ΣOPE levels from Taihu, China (Σ7OPEs: 3.83–14.25 ng/g) [31], the European Evrotas River Basin (Σ14OPEs: 0.31–31.0 ng/g dw) [32], the Western Scheldt Estuary (Netherlands) (< 0.1–19.6 ng/g dw) [17] and Bui Dau (Vietnam) (n.d.–4.5 ng/g dw) [33] were lower than those in the current study, while the OPE levels in sediments from Chicago Canal (470−2800 ng/g dw), United States [34], Tangxi River, China (10.81–131.96 ng/g) [35], and the European Adige River Basin (Σ14OPEs: 11.5−549 ng/g dw) [32] were much higher than that in the Minjiang River (76.45 ng/g dw). However, the values were comparable with the ΣOPE levels in studies from the Pearl River Delta, China (8.3−470 ng/g) [36], and the Sava River Basin in Europe (Σ14OPEs: 10.5−248 ng/g dw) [32].
In the study area, samples from three tributaries of the Minjiang River were collected. The concentrations of Σ6OPEs in the surface water of the Qingyi River, Jinjiang River and Dadu River in 2016 were comparable to each other (119.99 ng/L, 119.12 ng/L and 143.89 ng/L). After the confluence of the Dadu River and Qingyi River, the Σ6OPE concentration in surface water decreased from 114.84 ng/L to 56.96 ng/L below the confluence of the Jinjiang River and the Minjiang River, which may be due to the inflow of tributaries. Noticeably, the concentration of Σ6OPEs in the surface water of the Dadu River in 2017 (600.84 ng/L) was almost 4 times that in 2016 (143.89 ng/L), with TCPP increasing significantly which meant the OPE level in the Dadu River varied much, largely related to the increasing emissions of TCPP. The higher TCPP concentration values were observed at the sites located in the city-level cities and important county-level cities. In addition, the Dadu River Bridge opened to traffic in May 2017. Thus the traffic and domestic emission may be the main reason for the high concentration of TCPP in 2017. However, there was no significant difference in the concentration level of Σ6OPEs from the Qingyi River in 2016 and 2017 (P < 0.05), which meant that the input of OPEs from the Qingyi River was relatively constant. As the largest tributary of the Minjiang River, the Dadu River has many tributaries flowing through cities along the river, and the Leshan industrial incubation park is nearby. These results showed that OPE contamination was affected by pollution inflow and proximity to industrial complexes, as evidenced by Lee et al. [37]. In the main stream of the Minjiang River, the lowest Σ6OPE concentration in water samples appeared at site A1 (Dujiangyan), which is located in the upper reaches of the Minjiang River. The highest concentration of Σ6OPEs was observed at site A2 (Chongzhou). After that, the Σ6OPE concentration decreased with increasing distance, indicating that A2 (Chongzhou) has some important pollution sources. At sites A5 (Pengshan), A7 (Qingshen), A10 (Leshan Giant Buddha) and A12 (Yibin), the concentrations of Σ6OPEs increased due to the influence of creeks or tributaries flowing into the main stream of the Minjiang River and a higher tourism industry density or population density. These results indicated that OPE contamination was highly affected by pollution inflow and anthropogenic source emissions.
In SPM, the concentration of Σ6OPEs varied significantly at different sites, with a maximum difference of 2 orders of magnitude. The highest concentration of Σ6OPEs was observed at site B1 (Qingyi River), followed by A6 (Meishan), A12 (Yibin) and A1 (Dujiangyan), with SPM contents of 8.48 mg/L, 20.92 mg/L, 40.43 mg/L and 23.01 mg/L, respectively. The lowest concentration of Σ6OPEs in SPM appeared at site A9 with a value of 269.26 mg/L for its SPM content, which was two orders of magnitude lower than that at site B1 (Qingyi River). The Σ6OPE concentration in SPM at site B2 (Dadu River) was one order of magnitude lower than that at site B1 (Qingyi River). Spearman correlation analysis showed that there was a significant negative correlation between the concentration of OPEs in SPM samples and the SPM contents (R−0.943, P < 0.01), which proved that SPM content was one of the key factors affecting the concentration of OPEs in SPM. The same results have been confirmed by Zhang et al. (2018) [15]. In sediment samples, the concentrations of Σ6OPEs were in the range of 45.3–106.1 ng/g dw, with a mean of 76.45±28.00 ng/g dw. The highest concentration of Σ6OPEs was at site A6 (Meishan). Along the flow direction downstream, the content of Σ6OPEs decreased, which was related to the redistribution and dilution of OPEs in the sediment. At sites with tributaries flowing in, the Σ6OPE concentration decreased, which was related to the dilution effect caused by larger flow and the scouring effect of flow on sediment. Therefore, lower concentrations were observed at site A5 (Pengshan) and site A10 (Leshan Giant Buddha), which were both influenced by tributary confluences. It is worth noting that from Fig. 1, the variation in Σ6OPE concentration in SPM was opposite to that in water but basically consistent with that of sediment.
The distributions of OPEs in water, SPM and sediment in 2017 are shown in Fig. 2. The average composition profile of OPEs in water was TCPP (47.83% of Σ6OPEs) > TBEP (24.33%) > TnBP (8.08%) > TCEP (7.67%) > TPhP (7.24%) > TEHP (4.86%). TCPP and TBEP were found to be present in significantly higher concentrations than other components, with concentrations 9.8 times and 5.0 times that of TEHP, respectively. TCPP varied significantly in different sampling sites. However, no obvious variations in TPhP and TEHP concentrations among all sampling sites were observed. Many previous studies have reported that TBEP, TCEP, and TCPP are the dominant components in water [38, 39]. The high proportions of these OPEs in surface water could be attributed to the high water solubility of TBEP (1.20×10³ mg/L), TCPP (1.60×10³ mg/L), and TCEP (7.00×10³ mg/L). A recent study from the Pearl River Delta reported that the OPE profile was TBEP (median: 200 ng/L, 27% of ΣOPEs) > tris(ethyl) phosphate (TEP) (23%) > TCPP (20%) > TCEP (15%) [15], which was different from this study. In comparison to other studies, the concentration of TCPP (12.63–326.20 ng/L) in water samples from the Minjiang River was comparable with that from Lake Shihwa, Korea (211 ng/L) [37], higher than that in the Songhua River, China (5.3–190 ng/L) [31] but lower than those in the Xiaozhong River in Beijing, China (< LOD–1742 ng/L) [25], and the Pearl River Estuary, China (150–1150 ng/L) [27]. The TBEP concentration (15.19–242.88 ng/L) was higher than that in the Songhua River, China (4.5–65 ng/L) [31] but lower than that in the Xiaozhong River, China (< LOD–3617 ng/L) [25]. The concentrations of TCPP and TCEP in water from the Minjiang River were obviously lower than those in the Aire River, U.K. (113–26050 ng/L and 119–316 ng/L, respectively) [40], and the TnBP concentration in the Minjiang River was lower than those in Germany [5] and in Austrian rivers [29]. This difference was due to the different development levels and usages of OPEs in various areas.

|
Download:
|
| Fig. 2. OPEs in water, SPM and sediment samples from different sites in the Minjiang River. | |
For SPM samples, there were some differences in OPE distribution at different sampling sites. TPhP was the prominent compound at sites A1 (Dujiangyan), A10 (Leshan Giant Buddha), A12 (Yibin) and B1 (Qingyi River), while it accounted for relatively low proportions at sites A2 (Chongzhou), A6 (Meishan) and B2 (Dadu River). TPhP is mainly concentrated in the upstream and downstream of Leshan and Yibin. A1 (Dujiangyan) has developed tourism industry, while sites A10 (Leshan) and A12 (Yibin) are located in port cities, in which the tourism industry is developed and ships travel frequently. Airport as a point source is close to A12 (Yibin). These lead to the high concentrations of TPhP at these sites. TEHP was the main pollutant at sites A6 (Meishan), A7 (Qingshen) and B2 (Dadu River), whereas its proportions in Σ6OPEs at sites A1 (Dujiangyan), A10 (Leshan Giant Buddha), A12 (Yibin) and B1 (Qingyi River) were relatively low. TEHP is widely used in detergent, papermaking, plastics and fiber processing industries as plasticizer. It is speculated that the printing and dyeing factory in Qingshen County along the Minjiang River is the main pollution source. This result was markedly different from the report by Brandsma et al. [17], which found that TBEP was the dominant OPE in SPM, followed by TCPP, with median concentrations of 33 and 16 ng/g dw, respectively, in the Western Scheldt Estuary, the Netherlands. Zhang et al. [15] reported that TnBP (median: 21.5 ng/g dw, 38% of ΣOPEs) and TCEP (median: 10.7 ng/g dw, 32% of ΣOPEs) dominated the total OPEs in SPM samples from the Pearl River Delta, China.
In sediments, TnBP (30.48 ng/g, 36.08% of ΣOPEs) and TBEP (17.96 ng/g, 24.96% of ΣOPEs) were the most abundant OPEs at all sites. The variation in TnBP concentration was the largest. TnBP was the important component of hydraulic and lubricating oils and thus could be related to the emissions from ships and industries. It is worth noting that TCPP, which accounted for a large proportion in water (47.83% of Σ6OPEs), contributed a lower proportion in sediments (13.33% of Σ6OPEs). This difference could be explained by the lower logKOW value of TCPP (2.59), which resulted in stronger hydrophilicity and a higher tendency to be present in water. TnBP and TBEP are easily absorbed and enriched in sediment by organic matter due to their higher logKOW values of 4 and 3.75, respectively. The contamination profiles of OPEs in sediment varied in different studies [21, 34, 40]. TCPP was the main pollutant in the sediments in Tangxi River, China (1.35–99.32 ng/g, mean: 20.00 ng/g) [35], with values higher than that in the Minjiang River, China (6.51–14.55 ng/g dw). OPEs were dominated by TnBP (2.9−347 ng/g) in Taihu, China [16], TCEP (1300 ng/g) in an Austrian river [29]. TBEP was the main pollutant in Shanghai river sediments and Yangtze Estuary, China (1.53 ng/g dw and 9.39 ng/g dw, respectively) [41]. The previously reported values were mostly higher than those in the current study. Overall, the contents of OPEs in the sediments of the Minjiang River were in the relative lower levels than those in the previous studies. In recent years, developed countries have gradually begun to control OPEs. In contrast, the usage of OPEs has gradually increased in China in the absence of any policies restricting their use, so the growth of OPE pollution in the environment deserves attention.
To further elucidate the OPE patterns in surface water, SPM, and sediments, OPEs were divided into alkyl OPEs (TnBP, TBEP and TEHP), phenyl OPEs (TPhP) and chlorinated OPEs (TCPP and TCEP) according to the different substituents. The proportions of alkyl OPEs in Σ6OPEs increased from surface water to SPM and sediments. Alkyl OPEs were the main pollutants in SPM (10.44%–80.88% of Σ6OPEs, mean of 54.52%) and sediments (59.08–81.30%, mean of 68.96%), while chlorinated OPEs presented a higher proportion in surface water (43.16%–75.99%, mean of 55.50%). Compared with the values in surface water, the proportions of chlorinated OPEs were lower in SPM and sediments, ranging from 3.28% to 32.14% and 15.44% to 27.71%, respectively. For phenyl OPEs, the highest proportion appeared in SPM, ranging from 0 to 86.28%, with an average of 29.48%, while its proportion in surface water was 1.68%–10.5% (average of 7.24%), which was similar to that in sediment (0–14.08%, mean of 8.43%). This result was in accordance with the fact that alkyl OPEs were the dominant OPEs in SPM, followed by chlorinated OPEs [17]. However, the profile of OPEs in the Minjiang River was different from that in the Pearl River Delta, where the proportions of chlorinated OPEs and phenyl OPEs increased from surface water (39% of ΣOPEs and 0.5% of ΣOPEs) to SPM (52% and 4.9%) and sediment (74% and 11%) [15]. Lee et al. [37] reported that chlorinated OPEs in sediments accounted for approximately 60% of the total OPEs in Lake Shihwa, Korea. This might be a result of differences in the global usage of OPEs. He et al. [42] pointed out alkyl phosphate esters were the main OPEs used in Southern China. Previous studies have reported that alkyl OPEs are more easy to degradation than other OPEs [38]. This implied that OPE pollution in Minjiang River was influenced by on-going emissions.
To assess the distribution of OPEs in the water environment, the OPE partition coefficients between water and sediment and between water and SPM were calculated (Table 2).
|
|
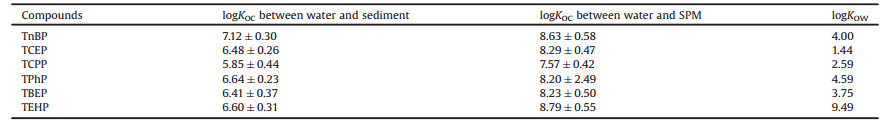
Table 2 Partition coefficients of OPEs in the aquatic environment. |
In this study, correlation analysis of logKd and f showed that there were significant correlations between TCPP-f (R = 0.766, P < 0.01), TCEP-f (R = 0.811, P < 0.01) and TEHP-f (R = 0.766, P < 0.01) in water and sediment. For other OPEs, a balanced distribution may not have been reached due to the influence of velocity and flow in the Minjiang River Basin. Similarly, TnBP-f (R = 0.780, P < 0.01), TCEP-f (R = 0.815, P < 0.01), TCPP-f (R = 0.805, P < 0.01), TBEP-f (R = 0.760, P < 0.05) and TEHP-f (R = 0.611, P < 0.05) were significantly correlated in water and SPM, indicating that the distribution of all OPE compounds in water and SPM was mediated by organic matter content, except for TPhP. Other factors, such as the metal content in sediment, can also affect the distribution of OPEs between water and SPM. This conclusion differed from the report of Zhang et al. [15], in which only the logKP (CSPM/CWater) values of TnBP (R = 0.677, P < 0.05) and TCPP (R = 0.669, P < 0.05) were significantly and positively correlated with the content of organic carbon (OC%). The partitioning of most OPEs between water and SPM was not mediated by the OC% in the Pearl River Delta, China.
The logKOC values between water and sediment of individual OPEs were calculated to range from 5.85 to 7.12. TnBP had the largest logKOC value (7.12±0.30), followed by TPhP and TEHP. The smallest logKOC value was for TCPP. However, the logKOC values between water and SPM of individual OPEs ranged from 6.71 to 10.00. A T-test showed that there was no significant difference among all sampling sites (P > 0.05). The largest logKOC value was for TEHP (8.68±0.55), followed by TnBP and TCEP. The lowest value of logKOC was also for TCPP. The logKOC value between water and SPM was higher than that between water and sediment, indicating that OPEs in water were more easily adsorbed on SPM than sediment.
SPSS Statistics was used to analyze the correlations between logKOW and logKOC. There was no significant correlation between logKOW and logKOC for water and sediment (R = 0.635, P > 0.05) or for water and SPM (R = 0.499, P > 0.05), which showed that logKOW had no significant effect on the distribution of OPEs in water, SPM and sediment. This relationship may be related to resuspension caused by water flow and biological agitation [43], as well as the particle size and surface area of SPM [44]. This finding was consistent with the report by Zhang et al. [15], in which no significant correlations were found between OPE levels and organic carbon content (P > 0.05), indicating that organic carbon is not the main factor determining OPE levels in SPM and sediments from the Pearl River Delta.
To date, there have been very limited reports on the aqueous phase-sediment and aqueous phase-SPM partition coefficients of OPEs. The partition coefficients of OPEs in this study were higher than the observed logKOC values (4.03±0.52, 3.46±0.48, 3.20±0.40, and 4.20±0.53 for TnBP, TCEP, TCPP, and TPhP, respectively) from the Pearl River Delta, China [15], the predicted logKOC values from EPI Suite software [45] and the observed logKOC values between pore water and particles in sediments (4.0–5.2 and 4.7–5.3 for TCPP and TnBP, respectively) reported by Cao et al. [21]. However, the partition coefficients of OPEs were equivalent to those of naphthalene (logKOC=4.3), pyrene (logKOC = 5.8), benzo[a]pyrene (logKOC=6.7) [46] and organochlorine pesticides such as hexachlorobenzene (logKOC=4.02) and dichlorodiphenyltrichloroethane (DDT) (logKOC=5.63) [47].
In summary, OPEs were detected in surface water, SPM and sediment samples, indicatingthe prevalent contamination of OPEs in the Minjiang River Basin. Markedly higher OPE levels were found in SPM than surface water and sediment, suggesting that SPM pollution should be addressed. TCPP and TBEP were the main pollutants in surface water, while TnBP and TBEP were dominant in sediments. The composition profile of OPEs in SPM varied greatly. Significant correlations between logKd and f (TCPP-f: R = 0.766, P < 0.01, TCEP-f: R = 0.811, P < 0.01 and TEHP-f: R = 0.766, P < 0.01) in water and sediment were observed. The distribution of all OPE compounds in water and SPM was mediated by organic matter content, except for TPhP. The partition coefficient of OPEs in this study was higher than those in previous studies.
This is the first report of the occurrence and the distribution of OPEs in the Minjiang River in China. The pollution level should be continuously monitored, and the migration and transformation of OPEs in the aquatic environment need further study.
Declaration of competing interestThe authors report no declarations of interest.
AcknowledgmentThis study received financial support from the National Natural Science Foundation of China (Nos. 41773072, 21407014).
| [1] |
N.J. Andrae. Durable and environmentally friendly flame retardants for synthetics. the United States: North Carolina State University 2007
|
| [2] |
E. Fries, W.K. Puttmann, J. Environ. Monit. 3 (2001) 621-626. DOI:10.1039/b105072a |
| [3] |
Y. Liu, N. Song, R. Guo, et al., Chemosphere 202 (2018) 255-263. DOI:10.1007/978-981-13-0005-9_22 |
| [4] |
L. Xing, M. Tao, Q. Zhang, M. Kong, C.H. Liu, Sci. Total Environ. 734 (2020) 111243-111251. |
| [5] |
J.A. Andresen, D. Muir, D. Ueno, et al., Environ. Toxicol. Chem. 26 (2007) 1081-1089. DOI:10.1897/06-416R.1 |
| [6] |
A. Bacaloni, F. Cucci, C. Guarino, et al., Environ. Sci. Technol. 42 (2008) 1898-1903. DOI:10.1021/es702549g |
| [7] |
P.C. Hartmann, D. Bürgi, W. Giger, Chemosphere 57 (2004) 781-787. DOI:10.1016/j.chemosphere.2004.08.051 |
| [8] |
M. Wensing, E. Uhde, T. Salthammer, Sci. Total Environ. 339 (2005) 19-40. DOI:10.1016/j.scitotenv.2004.10.028 |
| [9] |
A. Marklund, B. Andersson, P. Haglund, J. Environ. Monit. 7 (2005) 814-819. DOI:10.1039/b505587c |
| [10] |
Y. Ma, K. Cui, F. Zeng, et al., Anal. Chim. Acta 786 (2013) 47-53. DOI:10.1016/j.aca.2013.04.062 |
| [11] |
J.W. Kim, B.R. Ramaswamy, K.H. Chang, T. Isobe, S. Tanabe, J. Chromatogr. A 1218 (2011) 3511-3520. DOI:10.1016/j.chroma.2011.04.006 |
| [12] |
A.M. Sundkvist, U. Olofsson, P. Haglund, J. Environ. Monit. 12 (2010) 943-951. DOI:10.1039/b921910b |
| [13] |
L.V. Dishaw, C.M. Powers, I.T. Ryde, et al., Toxicol. Appl. Pharmacol. 256 (2011) 281-289. DOI:10.1016/j.taap.2011.01.005 |
| [14] |
E.M.J. Verbruggen, M. Beek, J. Pijnenburg, T.P. Traas, Environ. Toxicol. Chem. 27 (2010) 2436-2448. |
| [15] |
Y. Zhang, X.B. Zheng, L.F. Wei, Sci. Total Environ. 630 (2018) 164-170. DOI:10.1093/abbs/gmx135 |
| [16] |
X.L. Wang, L.Y. Zhu, W.J. Zhong, L.P. Yang, J. Hazard. Mater. 360 (2018) 43-50. DOI:10.1504/ijris.2018.091129 |
| [17] |
S.H. Brandsma, P.E. Leonards, H.A. Leslie, J. de Boer, Sci. Total Environ. 505 (2015) 22-31. DOI:10.1016/j.scitotenv.2014.08.072 |
| [18] |
Y. Shi, L. Gao, W. Li, et al., Environ. Pollut. 209 (2016) 1-10. DOI:10.1155/2016/7230326 |
| [19] |
WHO, Environmental Health Criteria 209, Switzerland, 1998.
|
| [20] |
T. Reemtsma, J.B. Quintana, R. Rodil, M. García-López, I. Rodríguez, Trends Analyt. Chem. 27 (2008) 727-737. DOI:10.1016/j.trac.2008.07.002 |
| [21] |
D. Cao, J. Guo, Y. Wang, et al., Environ. Sci. Technol. 51 (2017) 1441-1449. DOI:10.1021/acs.est.6b05484 |
| [22] |
S.H. Fang, C. Li, Y.X. Bian, et al., China Environ. Sci. 39 (2019) 2983-2989. |
| [23] |
D. Wu, H.L. Yin, S.P. Li, et al., Environ. Sci. (Ruse) 40 (2019) 1245-1251. |
| [24] |
H.L. Yin, J.F. Liang, D. Wu, et al., Atmos. Chem. Phys. 20 (2020) 14933-14945. DOI:10.5194/acp-20-14933-2020 |
| [25] |
Y.L. Shi, L.H. Gao, W.H. Li, et al., Environ. Pollut. 209 (2016) 1-10. DOI:10.1155/2016/7230326 |
| [26] |
Z.F. Zhang, Jiangxi University of Science and Technology. 2020
|
| [27] |
X. Wang, Y. He, L. Lin, F. Zeng, T. Luan, et al., Sci. Total Environ. 470 (2014) 263-269. |
| [28] |
R. Wang, J. Tang, Z. Xie, et al., Environ. Pollut. 198 (2015) 172-178. DOI:10.1016/j.envpol.2014.12.037 |
| [29] |
E. Martínez-Carballo, C. González-Barreiro, A. Sitka, S. Scharf, O. Gans, Sci. Total Environ. 388 (2008) 290-299. |
| [30] |
A. Bacaloni, C. Cavaliere, P. Foglia, et al., Rapid Commun. Mass Spectrom. 21 (2007) 1123-1130. DOI:10.1002/rcm.2937 |
| [31] |
S. Cao, X. Zeng, H. Song, et al., Environ. Toxicol. Chem. 31 (2012) 1478-1484. DOI:10.1002/etc.1872 |
| [32] |
M. Giulivo, E. Capri, E. kalogianni, et al., Sci. Total Environ. 586 (2017) 782-791. DOI:10.1016/j.scitotenv.2017.02.056 |
| [33] |
H. Matsukami, N.M. Tue, G. Suzuki, et al., Sci. Total Environ. 514 (2015) 492-499. DOI:10.1016/j.scitotenv.2015.02.008 |
| [34] |
A.A. Peverly, C.O.' Sullivan, L.Y. Liu, et al., Chemosphere 134 (2015) 380-386. DOI:10.1016/j.chemosphere.2015.04.065 |
| [35] |
Y.T. Lu, S. Zhao, Y.L. Qiu, et al., Environ. Pollut. Prevent. 40 (2018) 604-608. |
| [36] |
X.X. Tan, X.J. Luo, X.B. Zheng, et al., Sci. Total Environ. 544 (2016) 77-84. DOI:10.1016/j.scitotenv.2015.11.089 |
| [37] |
S. Lee, H.J. Cho, W. Choi, H.B. Moon, Mar. Pollut. Bull. 130 (2018) 105-112. DOI:10.14579/membrane_journal.2018.28.2.105 |
| [38] |
G.L. Wei, D.Q. Li, M.N. Zhuo, et al., Environ. Pollut. 196 (2015) 29-46. DOI:10.1016/j.envpol.2014.09.012 |
| [39] |
M. Iqbal, J.H. Syed, A. Katsoyiannis, et al., Environ. Res. 152 (2017) 26-42. DOI:10.1016/j.envres.2016.09.024 |
| [40] |
J. Cristale, A. Katsoyiannis, A. Sweetman, K.C. Jones, S. Lacorte, Environ. Pollut. 179 (2013) 194-200. DOI:10.1016/j.envpol.2013.04.001 |
| [41] |
L. Chen, Pollution characteristics of polybrominated two phenyl ethers and organic phosphate esters in sediments of Shanghai. Shanghai University (2015)
|
| [42] |
J.H. He, J.F. Li, L.Y. Ma, et al., Sci. Total Environ. 697 (2019) 133997. DOI:10.1016/j.scitotenv.2019.133997 |
| [43] |
J. Regnery, W. Püttmann, Water Res. 44 (2010) 4097-4104. DOI:10.1016/j.watres.2010.05.024 |
| [44] |
L.F. Liu, L.J. Zhang, X.L. Zhang, Period. Ocean Univ. China 36 (2006) 126-130. |
| [45] |
US EPA, Estimation Programs Interface Suite TM for Microsoft ®Windows, Vol 4.11, Washington, DC, U. S. A., 2012.
|
| [46] |
S.B. Hawthorne, C.B. Grabanski, D.J. Miller, Environ. Toxicol. Chem. 25 (2006) 2901-2911. DOI:10.1897/06-115R.1 |
| [47] |
J. Hodson, N.A. Williams, Chemosphere 17 (1988) 67-77. DOI:10.1016/0045-6535(88)90045-8 |