 2021, Vol. 32


b College of Science, China University of Petroleum (East China), Qingdao 266580, China;
c Petroleum Engineering Technology Research Institute, Sinopec Shengli Oilfield Company, Dongying 257067, China
Ammonia (NH3) is a colorless and highly irritating gas that originates from nature as well as from human activities [1-3]. In recent decades, industrialized urbanization has developed rapidly and led to the emission of a large amount of NH3 into the atmosphere [4]. It is worth noting that NH3 will show detrimental effects to humans even at low concentrations by affecting the human oral cavity, skin mucous membranes, upper respiratory tract and so on [5, 6]. The Occupational Safety and Health Administration (OSHA) has set an acceptable 8-h exposure limit of 25 ppm and a short-term (15 min) exposure level of 35 ppm for human beings [7]. But for humans, the olfactory limit of detection of NH3 gas is 55 ppm [8], which cannot fulfill the requirement of NH3 detection. Thus, rapid and sensitive detection of NH3 is of great significance for environmental monitoring and health maintaining.
To attain this goal, various methods such as gas chromatography [9], semiconductor-based gas sensors [10-12], optical fiber method [13], fluorescence method [14, 15] have been developed for NH3 detection. Among them, gas sensors based on semi-conductive metal oxides are widely used because of their high sensitivity and fast response, but they still suffer from some inherent shortcomings such as high working temperature, susceptibility to humidity and relatively long recovery time [16-18]. Colorimetry has been widely used in various fields because of its low cost, simplicity, and easy semi-quantitative detection [19]. Traditional colorimetric methods for NH3 detection mainly involves the use of organic dyes [20, 21], including Nessler's reagent [22], indophenol blue [23], pH-sensitive dyes [24], etc. These colorimetric methods are easy to carry out but their sensitivity is always insufficient for on-site gaseous NH3 determination [25]. Recently, noble metal nanomaterials (especially gold and silver) that exhibit highly tunable localized surface plasmon resonance (LSPR) properties offer an excellent opportunity to construct sensitive colorimetric sensors [26]. These nanoparticles (NPs) have been widely used in the detection of organic pollutants [27], anions [28], cations [29-31] and biomolecules [32-36], etc. A few studies have also been directed to the detection of toxic gases by tailor-making plasmonic NPs with specific structure, composition, morphology and surface functionality [37]. For example, silver nanoparticles (AgNPs) have been synthesized to serve as the optical probes for the colorimetric detection of NH3 [38, 39]. The mechanisms are based on the manipulation of the surface plasmon band of AgNPsvia the formation of Ag(NH3)2+ complex, achieving the detection limit of 200 ppm. However, it is worth noting that Ag NPs suffer from poor stability and easy oxidation, which to some extent decrease its attractiveness in practical application.
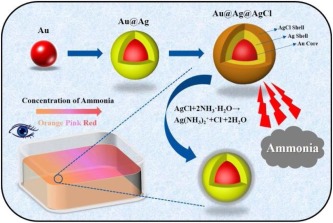
Based on these considerations, we developed a colorimetric method for NH3 based on Au@Ag@AgCl NPs. As shown in Fig. 1, Au@Ag core-shell NPs were synthesized by depositing a layer of silver onto pre-made AuNPs via an epaxial growth method. Then, a thin layer of AgCl was deposited onto Au@Ag NPs by oxidative etching and precipitating with FeCl3 to construct Au@Ag@AgCl NPs. The sensing mechanism is based on the successive etching of AgCl and Ag shell by NH3, which exposed the internal Au NPs, leading to the decrease of absorbance of silver shell and increase of absorbance of Au core, and the color change from orange to pink to red. The introduction of the AgCl shell not only enhances the stability of the Ag shell, but also enables a richer color gradation and higher sensitivity. The colorimetric assay developed was successfully applied to the determination of gaseous NH3 in real samples, showing its great potential for rapid detection of NH3 in the field.

|
Download:
|
| Fig. 1. Schematic illustration of the colorimetric detection of NH3 based on Au@Ag@AgCl NPs. | |
Due to their strong LSPR effect, Au NPs were used as cores for the further deposition of Ag and AgCl shells to prepare Au@Ag@AgCl core-shell NPs. 13-nm Au NPs were synthesized by the classical citrate method [40] with a uniform morphology and excellent dispersion. These Au NPs were used as seeds for the further deposition of Ag shell by an epitaxial growth method. Typical TEM and the histogram of size distribution of Au NPs and Au@Ag NPs are shown in Fig S1 (Supporting information). The Au@Ag core-shell NPs have a uniform morphology with average size of 15.0±1.2 nm. It can be seen from the UV–vis that the characteristic absorption peak of Ag appears at 380 nm as shown in Fig. S1f. Then, FeCl3 was used an etching and precipitating agent to convert Au@Ag NPs into Au@Ag@AgCl NPs. It can be seen from Fig. S2 (Supporting information) that after adding FeCl3 solution to the Au@Ag core-shell NPs, a new LSPR band appeared at 260 nm, which was regarded as the characteristic peak of AgCl [41]. As the concentration of the FeCl3 increases, the intensity of the absorption peak of AgCl was significantly increased, accompanied by a decrease in the intensity of the absorption peak of Ag. Typical TEM images in Fig. 2a shows a thin layer of shell with shallower contrast was deposited onto the Au@Ag. In addition, there was no free AgCl existing around the NPs. The size distribution chart shows that the average size of Au@Ag@AgCl NPs is 16.5±0.8 nm. High-resolution transmission electron microscopy (HRTEM) was used to characterize the structure which is shown in Fig. 2b. The spacings of 2.35, 2.04, 2.76Å were attributed to the (111) Au, (200) Ag and (200) AgCl lattice planes. The selected area electron diffraction (SAED) pattern with bright circular rings further confirmed the crystalline nature of the Au@Ag@AgCl (Fig. 2c). High-angle annular dark field scanning transmission electron microscopy (HAADF-STEM) and Energy dispersive spectroscopy (EDS) elemental mapping characterization in Figs. 2d–h further evidence the formation of core-shell structure, in which the core belongs to Au and the shells belong to Ag and AgCl, respectively.

|
Download:
|
| Fig. 2. (a) TEM image and the histogram of particle size distribution of Au@Ag@AgCl NPs (inset). (b) HRTEM image of Au@Ag@AgCl NPs. (c) SAED of Au@Ag@AgCl NPs. (d–h) HAADF-STEM and EDS elemental maps of Au@Ag@AgCl NPs. | |
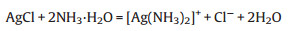
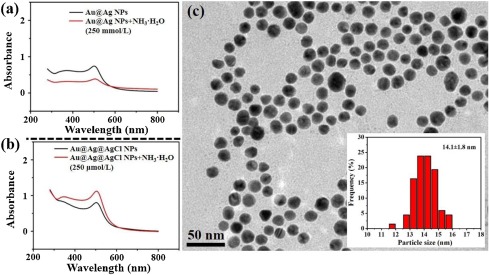
To compare the sensitivity of Au@Ag and Au@Ag@AgCl to NH3 detection, different concentrations of NH3·H2O were added to these two probes, respectively. As can be seen from Fig. 3a, with the addition of 250 mmol/L NH3·H2O into Au@Ag NPs, the characteristic absorption peak of Au (520 nm) and Ag (370 nm) both decreased significantly. This phenomenon indicates the etching effect of NH3·H2O on the silver shell. In contrast, when NH3·H2O is added to Au@Ag@AgCl, the intensity of the characteristic peaks of both Au and Ag increases (Fig. 3b). The reason for this phenomenon is that the outer AgCl shell with little LSPR effect is etched by NH3·H2O to expose the inner Ag shell, thus recovering the LSPR effect of Au and Ag. It is worth noting that the concentration of NH3·H2O used to etch Au@Ag (250 mmol/L) was a thousand times greater than that of Au@Ag@AgCl (250 μmol/L), confirming that the method using Au@Ag@AgCl NPs as the probes have a higher sensitivity for NH3 detection. The difference of the sensitivity between these two probes can be explained by the Eqs. 1 and 2 shown below. The etching of 1 mol of Ag and AgCl requires 8 mol and 2 mol of NH3·H2O, respectively. In addition, AgCl shell has a more stable chemical property than Ag, which brings further advantages to the practical application of the probe.

|
(1) |
|
(2) |

|
Download:
|
| Fig. 3. (a) UV–vis of Au@Ag and Au@Ag NPs+NH3·H2O (250 mmol/L). (b) UV–vis of Au@Ag@AgCl and Au@Ag@AgCl NPs+NH3·H2O (250 μmol/L); (c) TEM image and the histogram of particle size distribution of Au@Ag@AgCl NPs+NH3·H2O (250 μmol/L) (inset). | |
To further confirm the etching mechanism, the morphology and dimension change of Au@Ag@AgCl NPs before and after NH3 treatment was characterized by TEM. As shown in Fig. 3c, the outer shell of the material was etched by NH3·H2O, and the diameter of the NPs decreased from 16.5 nm to 14.1 nm.
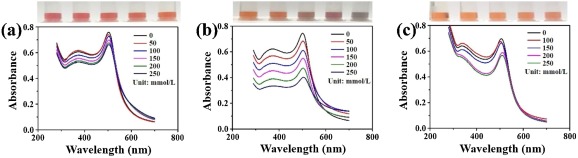
To maximize the sensing efficiency, the core-to-shell size ratio of the NPs, reaction time, and pH of the solution were optimized. Firstly, the influence of Ag shell thickness on the detection effect was explored by depositing Ag shells at different thickness with different amounts of AgNO3 (120, 150 and 180 μmol/L). These three sizes of NPs were denoted as Au@Ag-1, Au@Ag-2 and Au@Ag-3 (shown in Fig. 4). As the concentration of silver nitrate increases, the thickness of the silver shell of Au@Ag core-shell NPs gradually increases from 14.6 nm to 16.4 nm (TEM and the histogram of size distribution were shown in Fig. S3 in Supporting information).Fig. 4a shows that the Au@Ag-1 NPs with the thinnest silver shell thickness were sensitive for the detection of NH3, but the tunable color range was narrow. In contrast, Fig. 4c indicates that the Au@Ag-3 NPs with the thickest silver shells were beneficial for the detection of NH3 in a wide concentration range, but they suffered from low sensitivity and visual resolution. As shown in Fig. 4b, Au@Ag-2 NPs exhibit both high sensitivity and obvious color gradation changes. Therefore, the concentration of AgNO3 (150 μmol/L) is selected as the best condition for the synthesis of Au@Ag core-shell NPs.

|
Download:
|
| Fig. 4. UV–vis and corresponding photographs of Au@Ag core-shell NPs with different Ag shell thicknesses reacting with NH3·H2O at different concentrations. The concentration of AgNO3: (a) 120 μmol/L; (b) 150 μmol/L; (c) 180 μmol/L. | |
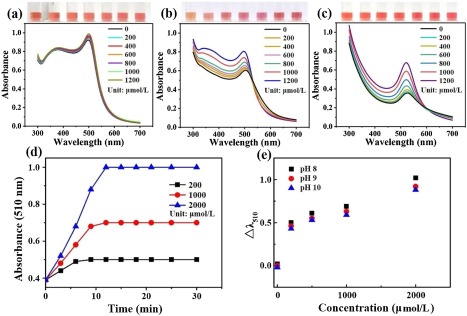
The concentration of FeCl3 is another crucial factor that needed to be optimized because it determines the efficiency of transformation of Ag into AgCl. Au@Ag@AgCl NPs were synthesized with FeCl3 at different concentrations (60, 120, 180 μmol) and denoted as Au@Ag@AgCl-1, Au@Ag@AgCl-2 and Au@Ag@AgCl-3 (shown in Fig. 5). These Au@Ag@AgCl NPs were used for NH3 detection. Fig. 5a shows that the Au@Ag@AgCl-1 NPs with a thin AgCl layer have lower sensitivity to NH3. As for the Au@Ag@AgCl-3 NPs with a thicker AgCl layer in Fig. 5c, they have a higher sensitivity for NH3. However, due to the addition of excessive FeCl3 solution, the color of the solution changed from orange to orange-red, which is similar to the color of Au NPs so that cannot produce obvious color gradation. Based on the result in Fig. 5b, the Au@Ag@AgCl-2 NPs exhibited both satisfactory sensitivity and obvious color variations.

|
Download:
|
| Fig. 5. UV–vis and corresponding photographs of Au@Ag@AgCl NPs with different AgCl thicknesses reacting with NH3·H2O at different concentrations, the concentration of FeCl3: (a) 60 μmol/L; (b) 120 μmol/L; (c) 180 μmol/L. The effect of reaction time (d) and pH (e) on NH3 detection. | |
To further explore the influence of the etching conditions on the detection effect, the reaction time and pH of the solution were investigated. It can be seen from Fig. 5d that the etching reaction almost reached equilibrium in 10 min. To ensure complete reaction, the reaction time was fixed at 12 min. Finally, the sensing efficiency was investigated from 8 to 10 because the weak basic property of NH3. By examining the change in the intensity of the characteristic absorption peak of Au at 510 nm (Fig. 5e), the sensing efficiency was barely changed in the solution pH ranging from 8 to 10.
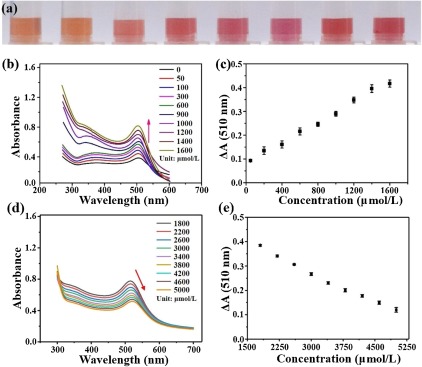
Under the optimized conditions, the linear range, limit of detection, reproducibility and selectivity of the developed method were investigated. Fig. 6a shows that with the increase of NH3·H2O concentration, the color of the solution changes gradually from orange to pink, and finally to red. It was found that the UV–vis spectra exhibited two different trends with NH3 in different concentration ranges. With the increase of NH3 concentration in the range of 0−1600 μmol/L, the LSPR peak intensity of Au showed a regular increase trend (shown in Fig. 6b), which can be ascribed to the fact that etching of AgCl shell leads to the recovery of strong LSPR effect stemmed from Au and Ag. The variation of the LSPR peak intensity of Au (ΔA510) is plotted as a function of NH3 concentration in Fig. 6c. A good linear relationship (ΔA (510 nm)=0.000219 ×c[NH3] (μmol/L) + 0.07784) was obtained with the determination coefficient R2 at 0.997. The LOD, defined by the equation of LOD=3σ/k, where σ is the standard deviation of the control groups (σ=0.00047, n=5) andk is the slope of the calibration graph, was calculated to be 6.4 μmol/L (14.3 ppm). The comparison of LODs of the proposed method with other colorimetric assays is summarized in Table 1 [38, 39, 42-44]. When the NH3 concentration increased further, the LSPR peak of Au declined with a regular red shift (shown in Fig. 6d). The phenomenon can be explained as follows: With the increase of NH3·H2O concentration, AgCl shell without LSPR characteristics [45] will be etched and consumed, leading to the increase of LSPR absorption intensity. Then, etching will occur on Ag shell and result in the decrease of LSPR absorption intensity. Further, Ag with a smaller refractive index (0.18) is consumed, and Au with a larger internal refractive index (0.5) [46] is exposed, resulting in a redshift in wavelength [47]. The working curve in Fig. 6e shows that in the range of 1800−5000 μmol/L, the change of Au LSPR absorption peak was linearly related to the concentration of NH3·H2O (ΔA (510 nm) = −0.0000846 × c[NH3] (μmol/L) + 0.528), and the determination coefficient was 0.991. Moreover, the sensor showed very high selectivity to NH3 with negligible crossover responses to formaldehyde, ethanol, acetone, sulfur dioxide, sodium sulfate, sodium nitrite, sodium nitrate, acrylamide, hydroxylamine chloride and 4-hydroxyphenethylamine (Fig. S4 in Supporting information).

|
Download:
|
| Fig. 6. The reaction between Au@Ag@AgCl core-shell NPs and a series of different concentrations of NH3: (a) Photographs; (b, d) UV–vis spectra; (c, e) Corresponding linear relationship between absorbance change at 510 nm and NH3 concentration. | |
|
|
Table 1 Comparison of the LOD of our method with others in detecting NH3. |

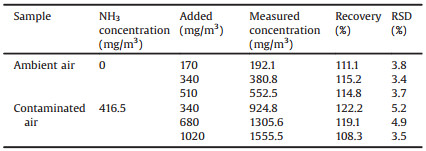
To evaluate its viability for the detection of gaseous NH3 in atmosphere, recovery tests were conducted for the detection of ambient air and simulated polluted air by NH3. As summarized in Table 2, the contents of NH3 in these two air samples are 0 and 416.5 mg/m3. The recoveries ranged from 111.1% to 115.2% and 108.3% to 122.2% in sample 1 and sample 2 and the standard deviation (RSD) is 3.4%–5.2%, respectively, indicating the proposed method is reliable and suitable for practical applications. The UV–vis spectra for the gaseous NH3 detection is shown in Fig. S5 (Supporting information).
|
|
Table 2 Recoveries of the colorimetric assay for the detection of gaseous NH3 in ambient air and simulated contaminated air. |
In summary, Au@Ag@AgCl NPs with thin AgCl shells were synthesized using an etching and precipitating method. The introduction of AgCl shell not only dramatically improves the stability of the Au@Ag NPs, but also provides a higher sensitivity to NH3. In addition, the selectivity towards NH3 is also enhanced because AgCl is more resistant than Ag to other interfering compounds. The sensing mechanism is based on the etching NH3 on AgCl shell, leading to the recovery of LSPR effect of Ag and Au. which exposed the LSPR effect of internal Au NPs, leading to the increase of absorbance at 510 nm and the color change from orange to pink to red. This work provides a colorimetric method for the detection of NH3 gas, which holds great promise for the on-site detection of NH3 with low cost, high sensitivity, good stability and ease of operation.
Declaration of competing interestThe authors declare that they have no known competing financial interests or personal relationships that could have appeared to influence the work reported in this paper.
AcknowledgmentsThis work was supported by the Graduate Student Innovation Project of China University of Petroleum (East China) in 2020 (No. YCX2020031). We also like to acknowledge the financial support by the National Natural Science Foundation of China (Nos. 21876206, 21505157), the Fundamental Research Funds for the Central Universities (China University of Petroleum (East China), Nos. 18CX02037A, 20CX05015A), and the Youth Innovation and Technology project of Universities in Shandong Province (No. 2020KJC007).
Appendix A. Supplementary dataSupplementary material related to this article can be found, in the online version, at doi:https://doi.org/10.1016/j.cclet.2021.02.029.
| [1] |
S. Giddey, S.P.S. Badwal, A. Kulkarni, Int. J. Hydrogen Energy 38 (2013) 14576-14594. DOI:10.1016/j.ijhydene.2013.09.054 |
| [2] |
D. Kwak, M. Wang, K.J. Koski, et al., ACS Appl. Mater. Interfaces 11 (2019) 10697-10706. DOI:10.1021/acsami.8b20502 |
| [3] |
I. Constantinoiu, D. Miu, C. Viespe, J. Sens. 2019 (2019) 8203810. |
| [4] |
B. Timmer, W. Olthuis, A.v.d. Berg, Sens. Actuator B: Chem. 107 (2005) 666-677. DOI:10.1016/j.snb.2004.11.054 |
| [5] |
D. Simpson, C. Andersson, J.H. Christensen, et al., Atmos. Chem. Phys. 14 (2014) 6995-7017. DOI:10.5194/acp-14-6995-2014 |
| [6] |
C.A. Skjøth, C. Geels, Atmos. Chem. Phys. 13 (2013) 117-128. DOI:10.5194/acp-13-117-2013 |
| [7] |
G.K. Mani, J.B.B. Rayappan, Mater. Sci. Eng. B191 (2015) 41-50. |
| [8] |
S.G. Wang, Q. Zhang, D.J. Yang, et al., Diamond Rel. Mater. 13 (2004) 1327-1332. DOI:10.1016/j.diamond.2003.11.070 |
| [9] |
R.R. Reston, E.S. Kolesar, J. Microelectromech. Syst. 3 (1994) 134-146. DOI:10.1109/84.338634 |
| [10] |
A.M. Seif, F.A. Tabar, A. Nikfarjam, et al., IEEE Sens. J. 19 (2019) 9616-9623. DOI:10.1109/jsen.2019.2927732 |
| [11] |
Z. Jin, Y. Su, Y. Duan, Sens. Actuator B: Chem. 72 (2001) 75-79. DOI:10.1016/S0925-4005(00)00636-5 |
| [12] |
Y. Tang, J. Tian, S. Li, et al., Sci. Total Environ. 532 (2015) 154-161. DOI:10.1016/j.scitotenv.2015.05.081 |
| [13] |
C. Yu, Y. Wu, X. Liu, et al., Sens. Actuator. B: Chem. 244 (2017) 107-113. DOI:10.1016/j.snb.2016.12.126 |
| [14] |
N.B. Shustova, A.F. Cozzolino, S. Reineke, et al., J. Am. Chem. Soc. 135 (2013) 13326-13329. DOI:10.1021/ja407778a |
| [15] |
M. Ganiga, J. Cyriac, Sens. Actuator B: Chem. 225 (2016) 522-528. DOI:10.1016/j.snb.2015.11.074 |
| [16] |
J. Deng, R. Zhang, L. Wang, et al., Sens. Actuator B: Chem. 209 (2015) 449-455. DOI:10.1016/j.snb.2014.11.141 |
| [17] |
Y. Qin, B. Zhang, Z. Zhang, Org. Electron. 70 (2019) 240-245. DOI:10.1016/j.orgel.2019.04.023 |
| [18] |
C. Liu, H. Tai, P. Zhang, et al., Sens. Actuator B: Chem. 261 (2018) 587-597. DOI:10.1016/j.snb.2017.12.022 |
| [19] |
A. Piriya, V.S, P. Joseph, K. Daniel, S.C.G, et al., Mater. Sci. Eng. C 78 (2017) 1231-1245. DOI:10.1016/j.msec.2017.05.018 |
| [20] |
C.G. Sun, Q. Lin, N.Y. Fu, Chin. Chem. Lett. 23 (2012) 217-220. DOI:10.1016/j.cclet.2011.11.001 |
| [21] |
Y.K. Li, J.J. Zhang, Z.J. Bian, et al., Chin. Chem. Lett. 27 (2016) 518-522. DOI:10.1016/j.cclet.2016.01.056 |
| [22] |
T.F. Hartley, Ann. Clin. Biochem. 11 (1974) 137-140. DOI:10.1177/000456327401100143 |
| [23] |
A. Aminot, D.S. Kirkwood, R. Kérouel, Mar. Chem. 56 (1997) 59-75. DOI:10.1016/S0304-4203(96)00080-1 |
| [24] |
J. Geltmeyer, G. Vancoillie, I. Steyaert, et al., Adv. Funct. Mater. 26 (2016) 5987-5996. DOI:10.1002/adfm.201602351 |
| [25] |
Y. Zhang, L.-T. Lim, Sens. Actuator B: Chem. 255 (2018) 3216-3226. DOI:10.1016/j.snb.2017.09.148 |
| [26] |
K. Saha, S.S. Agasti, C. Kim, et al., Chem. Rev. 112 (2012) 2739-2779. DOI:10.1021/cr2001178 |
| [27] |
T. Qi, M. Xu, Y. Yao, et al., Talanta 220 (2020) 121388. DOI:10.1016/j.talanta.2020.121388 |
| [28] |
Y. Li, Q. Wang, X. Zhou, et al., Sens. Actuator B: Chem. 228 (2016) 366-372. DOI:10.1016/j.snb.2016.01.022 |
| [29] |
A. Amirjani, D.F. Haghshenas, Talanta 192 (2019) 418-423. DOI:10.1016/j.talanta.2018.09.079 |
| [30] |
M. Annadhasan, J. Kasthuri, N. Rajendiran, ChemistrySelect 4 (2019) 6557-6567. DOI:10.1002/slct.201803849 |
| [31] |
E. Detsri, Chin. Chem. Lett. 27 (2016) 1635-1640. DOI:10.1016/j.cclet.2016.05.008 |
| [32] |
J. Chen, A.A. Jackson, V.M. Rotello, et al., Small 12 (2016) 2469-2475. DOI:10.1002/smll.201503682 |
| [33] |
I.M. Khoris, K. Takemura, J. Lee, et al., Biosensor. Bioelectron. 126 (2019) 425-432. DOI:10.1016/j.bios.2018.10.067 |
| [34] |
A. Liu, M. Li, J. Wang, et al., Chin. Chem. Lett. 31 (2020) 1133-1136. DOI:10.1016/j.cclet.2019.10.011 |
| [35] |
F. Li, Y. Feng, J. Li, et al., Sci. China Chem. 54 (2011) 545-551. DOI:10.1007/s11426-010-4092-y |
| [36] |
J. Zheng, D. Song, H. Chen, et al., Chin. Chem. Lett. 31 (2020) 1109-1113. DOI:10.1016/j.cclet.2019.09.037 |
| [37] |
J. Zeng, M. Li, A. Liu, et al., Adv. Funct. Mater. 28 (2018) 1800515. DOI:10.1002/adfm.201800515 |
| [38] |
S. Pandey, G.K. Goswami, K.K. Nanda, Int. J. Biol. Macromol. 51 (2012) 583-589. DOI:10.1016/j.ijbiomac.2012.06.033 |
| [39] |
A. Amirjani, D.H. Fatmehsari, Talanta 176 (2018) 242-246. DOI:10.1016/j.talanta.2017.08.022 |
| [40] |
J. Kimling, M. Maier, B. Okenve, et al., J. Phys. Chem. B 110 (2006) 15700-15707. DOI:10.1021/jp061667w |
| [41] |
T. Gupta, M.E. van der Boom, J. Am. Chem. Soc. 129 (2007) 12296-12303. DOI:10.1021/ja074134p |
| [42] |
I.M. El-Sherbiny, A. Hefnawy, E. Salih, Int. J. Biol. Macromol. 86 (2016) 782-788. DOI:10.1016/j.ijbiomac.2016.01.118 |
| [43] |
E. Detsri, J. Popanyasak, Colloids Surf. A: Physicochem. Eng. Asp. 467 (2015) 57-65. DOI:10.1016/j.colsurfa.2014.11.019 |
| [44] |
T. Ritthichai, V. Pimpan, J. King Saud Univ. - Sci. 31 (2019) 277-284. DOI:10.1016/j.jksus.2017.10.003 |
| [45] |
X. Yao, X. Liu, D. Zhu, et al., Catal. Commun. 59 (2015) 151-155. DOI:10.1016/j.catcom.2014.10.012 |
| [46] |
P.B. Johnson, R.W. Christy, Phys. Rev. B 6 (1972) 4370-4379. DOI:10.1103/PhysRevB.6.4370 |
| [47] |
G. Park, C. Lee, D. Seo, et al., Langmuir 28 (2012) 9003-9009. DOI:10.1021/la300154x |