 2021, Vol. 32


b School of Environmental Science and Engineering, Tianjin University, Tianjin 300350, China;
c School of Science, Tibet University, Lhasa 850000, China;
d School of Science, Tianjin University, Tianjin 300350, China;
e Research Center of Environmental Pollution Control Engineering Technology, Chinese Research Academy of Environmental Sciences, Beijing 100012, China
High concentration heavy metal ions mostly come from mining, smelting, surface treatment, electroplating, electrolysis, electrical and circuit board/circuit manufacturing, and normally, it is quite difficult to deal with them safely [1-3]. At present, various methods, including coagulation-flocculation [4], ion exchange [5-8], membrane separation [9, 10], biological treatment [11], and adsorption [12-17], have been adopted to remove heavy metal ions. Among them, adsorption was thought of as the most studied and widely used effective technologies [18-25].
With the development of adsorption technology for heavy metal ions, a variety of adsorbents have been developed [26-30]. However, due to the performance indicators, such as adsorption capacity, cost and stability, which cannot reach our desired treatment efficiency. With the recognition and understanding of the structure of adsorbents, molybdenum disulfide induced researcher's interest as an emerging adsorbent [7, 31-36]. Molybdenum disulfide composites possessed special layered structure and active sulfur atom at the edge, in which heavy metal ions were complexed edge S2− based Lewis acids and alkalis theory [37]. The representative is Lu et al.'s work, they designed molybdenum disulfide with expanded interlayer spacing and defective active sites to remove Hg2+ and Ag+ ions that the maximum theoretical adsorption capacity was 2506 and 1348 mg/g for Hg2+ and Ag+, respectively, which matched to the actual calculated value, confirmed the importance of exposing the sulfur atoms [31]. The surface free energy of amorphous materials is higher because of the abundant hanging bonds. Theoretically, amorphous molybdenum sulfide contains more kinds of active sulphide groups and the random disorder of this structure leads to more active sites. Amorphous molybdenum sulfide has been proposed to be polymeric in which S atoms presented various bonding environments, in which bridging S22−, apical S2− have been implicated as active species [38, 39]. Unfortunately, amorphous molybdenum sulfide was not wieldy applied in the field of adsorption research [40, 41], while being electrocatalyst and cocatalyst applied in the field of (photo)catalysis constantly because of these mentioned properties [42-44]. Summarizing the reported works, we found that only Fu et al. synthesized 2D amorphous MoS3 nanosheets with porous network structures for toxic metal ions (Cu2+, Cd2+ and Hg2+) remediation from a synthetic acid mine drainage solution effectively and prepared amorphous molybdenum sulphide composite uptaked Hg2+ from wastewater selectively [40, 41].
In this work, we synthesized amorphous molybdenum sulfide composites mediated by EDTA (EDTA-MoSx (x=2, 3)) based a facile hydrothermal method (Scheme 1) to adsorb Cu2+ ions, which is a common heavy metal in wastewater, and its adsorption performances were systematically investigated via a batch of experiments including contact time, ionic strength and so on. To clarify this mechanism of enhanced adsorption capacity, the adsorption energies, total electron density images, and Mulliken charge changes before and after adsorption was calculated here by using density functional theory (DFT).

|
Download:
|
| Scheme 1. The synthesis route of EDTA-MoSx (x=2, 3) composites. | |
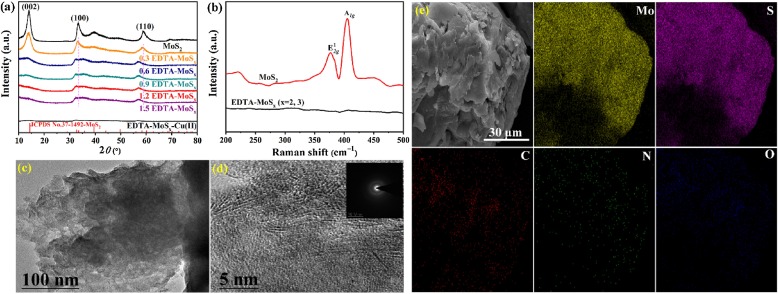
In order to determine the amorphous state of the synthesized sample, X-Ray diffraction (XRD), Raman, transmission electron microscopy (TEM), and scanning electron microscopy (SEM) were employed here. In this work, amorphous molybdenum sulfide was achieved via a sulfidation process. Normally, when we synthesized MoS2 crystal, there are three states in the process of molybdenum sulfidation: Oxidic state, intermediate MoS3-like, and crystalline MoS2 [45]. While in our reported sulfidation process, Na2EDTA was selected to retard the transformation of molybdenum from intermediate MoS3 to the final MoS2, which are quite critical to formation of amorphous molybdenum sulfide [45]. As shown in Fig. 1a, compare to crystalline MoS2, the intensity of (002) plane in EDTA-MoSx (x=2, 3) gradually weakened until disappeared with Na2EDTA amount increased to 1.5 mmol, indicating that crystallinity can be regulated by the amount of Na2EDTA. This change can be further confirmed via Raman spectra depicted in Fig. 1b. Crystalline MoS2 possessed two distinct peaks at 375 and 404 cm−1 correspond to the in-plane E2g1 and out-of-plane A1g vibration (S-S) modes of 2H-MoS2, respectively [46], the relevant signal peaks, however, disappeared in EDTA-MoSx (x=2, 3).

|
Download:
|
| Fig. 1. (a) XRD patterns of MoS2 and EDTA-MoSx (x=2, 3); (b) Raman spectra of MoS2 and EDTA-MoSx (x=2, 3); (c) TEM and (d) HRTEM images of EDTA-MoSx (x=2, 3); (e) elemental distribution of EDTA-MoSx (x=2, 3). | |
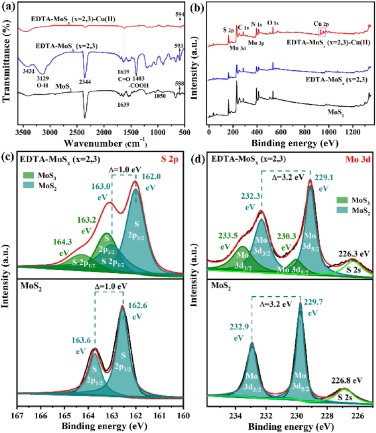
TEM is a very effective method to analyze the morphology and crystal state, so we employed TEM to explore crystalline information of synthesized amorphous molybdenum sulfide. Images of EDTA-MoSx (x=2, 3) scanned by TEM and high resolution transmission electron microscopy (HRTEM) in Figs. 1c and d confirmed the nanoparticles of EDTA-MoSx (x=2, 3) with the disordered structure which have rough nature surface and no relatively complete diffraction rings. This phenomenon is completely different from crystalline MoS2 with nano-flower-like structures formed by stacking irregular nanosheets with a thickness of ca. 2 nm (Figs. S1a and b in Supporting information) and have clear spacing adjacent lattice fringes (d = 0.634 nm) matched to (002) plane [47] in Fig. S1c (Supporting information). And from selected area electron diffraction (SAED) patterns inset of Fig. S1c (Supporting information), we found that (100), (002), (105) diffraction rings belonged to crystalline MoS2 were indexed. However, the relative abundance of the crystalline domains is greatly decreased in EDTA-MoSx (x=2, 3) (Fig. 1d). SEM image in Fig. S1d (Supporting information) indicated EDTA-MoSx (x=2, 3) with no clear outline of the three-dimensional structure compare to crystalline MoS2. Systematically analyze XRD, Raman, and HRTEM results, the amorphous structure of EDTA-MoSx (x=2, 3) was confirmed here. The energy dispersive X-ray spectroscopy (EDS) mapping from SEM in Fig. 1e indicates the elemental distribution of EDTA-MoSx (x=2, 3) with Mo, S, C, N, and O, confirming that EDTA was distributed homogeneously on EDTA-MoSx (x=2, 3). EDTA existed in EDTA-MoSx (x=2, 3) also verified by results of FTIR in Fig. 2a, where the peaks at 1639 cm−1, 1403 cm−1, and 3129 cm−1 were associated with the stretching vibration peak of C=O, bending vibration peak of -COOH, and stretching vibration peak of the O-H bond in -COOH, respectively [48, 49].

|
Download:
|
| Fig. 2. (a) FTIR spectra, (b) XPS survey spectra, (c) S 2p, and (d) Mo 3d XPS spectra of MoS2 and EDTA-MoSx (x=2, 3). | |
To determine the pore structure of nanoparticle and the specific surface areas of MoS2 and EDTA-MoSx (x=2, 3), a N2 adsorption-desorption test were conducted and found that the shape of the isotherm is categorized as type Ⅳ with H3 type of hysteresis loop in Fig. S2 (Supporting information), indicating that the adsorbent possesses mesoporous [50]. Moreover, the specific surface areas and average pore size of MoS2 and EDTA-MoSx (x=2, 3) were determined to be 66.85 m2/g and 17.39 nm, 0.22 m2/g and 30.67 nm, respectively. Lower specific surface area of EDTA-MoSx (x=2, 3) was due to its bulk structure (Fig. 1e) and another reason may be that slit holes formed by stacking the sheet-like MoS2 were blocked by Na2EDTA addition [38, 50].
For a functional material, the chemical configuration is quite important. Through the analysis of chemical configuration, its adsorption performance can be clearly analyzed. Here, X-ray photoelectron spectroscopy (XPS) survey spectra and high-resolution XPS spectra of S 2p and Mo 3d were depicted in Figs. 2b–d. The XPS survey spectra in Fig. 2b presents Mo 3d, S 2p, C 1s, N 1s and O 1s peaks in EDTA-MoSx (x=2, 3). High-resolution XPS spectra of S 2p1/2 and 2p3/2 for the EDTA-MoSx (x=2, 3) in Fig. 2c shows a broad envelope compare to crystalline MoS2, which can be fit to two doublets. The doublet at lower binding energies, 163.0 eV (S 2p1/2) and 162.0 eV (S 2p3/2), corresponded to edge S2− in MoS2, and the doublet at higher binding energies, 164.3 eV (S 2p1/2) and 163.2 eV (S 2p3/2), assigned to bridging sulphide S22− and/or apical sulphide S2− in MoS3 [51-53]. Besides, by integrating the peak area, the ratio of MoS3 to MoS2 in the EDTA-MoSx (x=2, 3) is determined to be 0.28:0.72. For Mo 3d XPS spectra (Fig. 2d), the binding energies for 232.3 eV (3d3/2) and 229.1 eV (3d5/2) were assigned to Mo(Ⅳ) atom in the MoS2, while higher energies of 233.5 eV (3d3/2) and 230.3 eV (3d5/2) were corresponded to Mo(Ⅵ) in MoS3 [52, 53], indicating that MoS2 and MoS3 coexisted in the EDTA-MoSx (x=2, 3) [39]. We also integrated the corresponding peak areas of MoS3 and MoS2, and found that the ratio of MoS3 to MoS2 was 0.29:0.71, which was basically consistent with the above S 2p analysis. And, the atomic ratio of Mo to S is estimated to be 1:2.5 through the element integral area, further theoretically indicating that both MoS 2 and MoS3 exist in the EDTA-MoSx (x=2, 3).
Fig. 3a shows Cu(Ⅱ) ions adsorption capacity under different EDTA amounts, the maximum value was realized at the amount of 1.2 mmol. In general, the uptake of Cu(Ⅱ) in solution is influenced by the species of Cu(Ⅱ) and the surface charge of the adsorbents, which are determined by pH value.Fig. 3b shows this effect of solution initial pH in the range of 2.0–6.0 on the adsorption capacity of EDTA-MoSx (x=2, 3). At initial pH 2–3, the competition between H+ and Cu(Ⅱ) and the protonation of -COOH on the EDTA-MoSx (x=2, 3) [29], which hindered the surface adsorption process. However, electrostatic attraction between Cu(Ⅱ) ions and the negatively charged surface of EDTA-MoSx (x=2, 3) was enhanced potentially due to the deprotonation effect at high initial pH (3–6) based on zeta potential detection (Fig. S3 in Supporting information), so the removal performance was improved. As we all know, it is quite critical to clarify the competition between coexisting ions (K+, Ca2+, Mg2+, Cl−, NO3−, SO42−, and HCO3−) and Cu(Ⅱ) ions, because they are likely to occupy the active sites on the surface of EDTA-MoSx (x=2, 3). From Fig. S4 (Supporting information), we can verify that all coexisting ions are uncompetitive to the adsorption of Cu(Ⅱ) ions. For HCO3− ions, with concentration ranging from 0.01 m mol/L to 0.1 m mol/L, the enhanced adsorption capacity may be due to the formation of Cu(OH)2 resulted from HCO3− hydrolysis.

|
Download:
|
| Fig. 3. (a) Adsorption capacity under different EDTA amount. (b) Effect of pH on the adsorption of Cu(Ⅱ) on MoS2 and EDTA-MoSx (x=2, 3). (c) Adsorption kinetics of MoS2 and EDTA-MoSx (x=2, 3). (d) Adsorption isotherms for Cu(Ⅱ) removal on MoS2 and EDTA-MoSx (x=2, 3). | |
The effect of contact time on the removal of Cu(Ⅱ) ions showed in Fig. 3c. The initial Cu(Ⅱ) concentration is 200 mg/L, the contact time range was 0–1440 min in this experiment. It is clear that the adsorption capacity increased rapidly and reached 83.58 mg/g at the initial 60 min, which is 72% of the equilibrium adsorption capacity. This is attributed to a higher concentration driving force and the excess available active sites in infancy adsorption. To further analyze the removal process of Cu(Ⅱ) in detail, we applied the pseudo-first-order and pseudo-second-order models (described in the Text S3 in Supporting information) to analyze the adsorption data. We found that the pseudo-second-kinetic model is more consistent with the adsorption process of EDTA-MoSx (x=2, 3) with a higher correlation coefficient (R2 = 0.99) as shown in Table S1 (Supporting information), indicating that EDTA-MoSx (x=2, 3) adsorbs Cu(Ⅱ) as a chemisorption process [29].
The adsorption isotherms with the concentration range 50–500 mg/L under 298 K are depicted in Fig. 3d. The equilibrium adsorption capacity of EDTA-MoSx (x=2, 3) is higher than MoS2 (119.58 vs. 46.70 mg/g), which was also superior to that of the adsorbents previously reported [30, 54, 55]. And, when the dosage is 5 g/L at the initial concentration of 200 mg/L, the concentration of Cu(Ⅱ) ions can be reduced to the drinking water limit value (1.0 mg/L) set by WHO (Fig. S5 in Supporting information), suggesting that EDTA-MoSx (x=2, 3) possess the greater advantage in practical applications. The related isotherms parameters can be obtained by fitting the experimental data with Langmuir and Freundlich model (Text S4 in Supporting information) and were summarized in Table S2 (Supporting information). Compared with the Freundlich model (R2=0.898), the Langmuir model (R2=0.931) is more consistent with the EDTA-MoSx (x=2, 3) adsorption equilibrium process. This indicating that the adsorption sites on the surface of the EDTA-MoSx (x=2, 3) are uniformly distributed and the adsorption of Cu(Ⅱ) on EDTA-MoSx (x=2, 3) occurs monolayer adsorption process [8]. In addition to Cu(Ⅱ) ions, the EDTA-MoSx (x=2, 3) still showed enhanced removal of multiple heavy metal ions with selective sorting of Cu(Ⅱ) > Pb(Ⅱ) > Cd(Ⅱ) > Ni(Ⅱ) > Zn(Ⅱ) compared with MoS2 (Fig. 4a), which is attributed to the stronger affinity with EDTA-MoSx (x=2, 3).

|
Download:
|
| Fig. 4. (a) Adsorption capacity of different heavy metals by EDTA-MoSx (x=2, 3) and MoS2 with C0=200 mg/L at pH 6.0. (b) Reusability of EDTA-MoS x (x=2, 3) at different concentrations of desorption agent. | |
The temperature-dependent adsorption curve was depicted in Fig. S6 (Supporting information) and thermodynamic parameters of Cu(Ⅱ) removal on EDTA-MoSx (x=2, 3) based on the Van't Hoff equation (Text S5 in Supporting information) were summarized in Table S3 (Supporting information), ΔG < 0 indicating that the adsorption process is spontaneous. With the increase of temperature, the absolute value of Δ G gradually increases, implying that the increase of temperature is beneficial to the Cu(Ⅱ) ions adsorption by EDTA-MoSx (x=2, 3) [56], which is consistent with the result of adsorption isotherms (Table S2). Besides, both ΔH and ΔS values are greater than zero, indicating that adsorption of Cu(Ⅱ) on EDTA-MoSx (x=2, 3) is an enthalpy increase and endothermic process.
To investigate the reusability of EDTA-MoSx (x=2, 3), several cycles of adsorption-desorption experiments were performed with different desorption agents (HCl and citric acid) in Fig. S7a (Supporting information). The 0.5 mol/L HCl was evaluated as the optimal desorption agent for EDTA-MoSx (x=2, 3)-Cu(Ⅱ) (Fig. 4b and Fig. S7b in Supporting information). The low eluent concentration could not provide enough hydrogen ions to destroy the strong Cu-S bond, while the destroyed structure of EDTA-MoSx occurred at the high concentration. After five cycles, the adsorption performance does not decrease significantly, indicating that the EDTA-MoSx (x=2, 3) has high stability and good cycle regeneration performance.
Adsorption mechanism analysis is very important to guide the design of adsorbents and in-depth understand of microscopic interfacial interactions. Electrostatic interaction and surface complexation are known as two common adsorption mechanisms. Considering that the surface of the EDTA-MoSx (x=2, 3) in the pH range of this study is negatively charged (Fig. S3), as for positively charged Cu(Ⅱ) ions, the electrostatic attraction may control the adsorption process. So, the adsorption of Cu(Ⅱ) ions by EDTA-MoSx (x=2, 3) under different NaCl concentrations was carried out in Fig. S8 (Supporting information). The experimental results showed that the adsorption was not affected by the ionic strength, therefore, the role of electrostatic attraction on the adsorption process was excluded and surface complexation is likely to control the adsorption process. Besides, the amorphous structure of EDTA-MoSx (x=2, 3) showed excellent stability (Fig. 1d and Fig. S9a in Supporting information) and the SEM morphology of the EDTA-MoSx (x=2, 3) did not change significantly after adsorption of Cu(Ⅱ) ions (Fig. S9b in Supporting information).
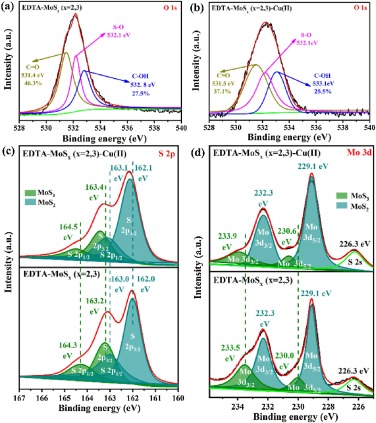
Fig. 2a shows the FTIR spectra of EDTA-MoSx (x=2, 3) before and after adsorption of Cu(Ⅱ) ions. It was worth noting that the absorbed Cu(Ⅱ) on the surface of EDTA-MoSx (x=2, 3) induced a new strong peak at 3129 cm−1 came from the stretching vibration peak of the O-H bond in -COOH disappeared, indicating -COOH was involved in the adsorption reaction and it was consumed by complexation with Cu(Ⅱ) ions [49, 57].Fig. 2b presents a survey and high resolution XPS spectra of EDTA-MoSx before and after the process of Cu(Ⅱ) ions adsorption. An obvious peak was detected at 934.7 eV after Cu(Ⅱ) adsorption, and two distinguishable binding energies around at 932.7 and 952.5 eV (Fig. S10 in Supporting information) are attributed to Cu 2p3/2 and Cu 2p1/2 in the of CuS [41], respectively. From Figs. 5a and b, we can see that binding energy of O 1s in C-OH and C=O and bond shifted from 532.8 eV to 533.1 eV and 531.4 eV–531.5 eV, respectively [58]. This reveal that during the adsorption process, oxygen in C-OH and/or C=O shares electrons with Cu(Ⅱ) to form Cu–O bond, decreased electron density of oxygen atoms and thus the binding energy increased. When integrating the peak area, we can see that the area decreased from 27.5% to 25.5% and 46.3% to 37.1%, resulting from C-OH and C=O decreased, respectively. In other words, the role of the carboxyl group in this reported adsorption process was verifiedvia FTIR and XPS analysis.

|
Download:
|
| Fig. 5. XPS spectra of O 1s (a) before and (b) after Cu2+ adsorption on EDTA-MoSx (x=2, 3). (c) S 2p XPS spectra before and after Cu2+ adsorption on EDTA-MoSx (x=2, 3). (d) Mo 3d XPS spectra before and after Cu2+ adsorption on EDTA-MoSx (x=2, 3). | |
To testify the function of sulfide ligands for Cu(Ⅱ) ions adsorption in EDTA-MoSx (x=2, 3), the shifts of MoS3 and MoS2 core energy are showed in Fig. 5c. The binding energy of bridging sulfide S22− and/or apical sulfide S2− belonged to MoS3 shifts from 164.3 eV to 164.5 eV (S 2p1/2) and 163.2 eV–163.4 eV (S 2p3/2). The S 2p1/2 and S 2p3/2 belong to the edge S2− of MoS2 both changed from 163.0 eV to 163.1 eV, 162.0 eV–162.1 eV, respectively. The increased binding energy of sulfur after Cu(Ⅱ) indicated sulfur atoms shares electrons with Cu(Ⅱ) to form Cu–S bond, inducing decreasing the electron density of sulfur atoms. In addition, the observation movement of Mo 3d3/2 and 3d5/2 binding energies in MoS3 from 233.5 eV to 233.9 eV and 230.0 eV to 230.6 eV, respectively (Fig. 5d). This is because sulfur atoms in MoS3 shared electrons with Cu(Ⅱ) and induced the electron density of adjacent molybdenum atoms decreased, thus increased its binding energy. In contrast, this binding energy shift was not observed in MoS2, suggesting that MoS3 has a better affinity for Cu(Ⅱ) ions, which will be confirmed by DFT calculations below.
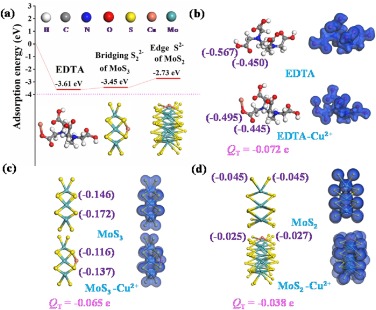
Considering apical sulfide S2− cannot participate in adsorption due to chemically inert, thus bridging sulfide S22− of MoS3 and the edge S2− of MoS2 plays a positive role in the process of adsorbing Cu(Ⅱ) in the system [40, 41]. To illustrate the role of -COOH in the EDTA-MoSx (x=2, 3), bridging sulfide S22− of MoS3 and the edge S2− of MoS2 in this adsorption process, we performed DFT calculations to clarify this theoretically. As we all know that the more negative the adsorption energy (Eads) is, the more stable the corresponding structure is [25]. The calculated Eads of EDTA, MoS3, and MoS2 with Cu(Ⅱ) were estimated in Fig. 6a, Eads of EDTA (−3.61 eV) and MoS3 (−3.45 eV) were lower than MoS2 (−2.73 eV), indicating the EDTA and MoS3 possess higher adsorption affinity than that of MoS2. The comparative experiments of adsorption capacity using EDTA-MoSx (x=2, 3) and MoS2 are presented in Fig. 4a, suggesting amorphous molybdenum sulfide mediated EDTA with multiple active sites has more advantages in water treatment of heavy metal ions than crystalline MoS2.

|
Download:
|
| Fig. 6. DFT calculations analysis: (a) Adsorption energies of active sites for Cu(Ⅱ) ions on EDTA-MoSx (x=2, 3). Total electron density images and Mulliken charge calculations of before and after Cu(Ⅱ) adsorption on (b) EDTA, (c) MoS3 and (d) MoS2. | |
We further provided total electron density patterns (TED) via DFT calculations to investigate the interaction between Cu(Ⅱ) ions and EDTA-MoSx (x=2, 3). The deformations of TED patterns were observed after the adsorption process (Figs. 6b–d), suggesting strong interaction between Cu(Ⅱ) ions and EDTA, MoS3, and MoS2, respectively. Moreover, electron clouds of Cu(Ⅱ) ions obviously overlaped with EDTA, MoS3, and MoS2, respectively, indicating the sharing or transfer of electrons induced by surface complexation. Mulliken charge analysis is an effective tool to study electrons transfer for interaction system. Mulliken charge calculations of key active sites before and after Cu(Ⅱ) adsorption are presented in Figs. 6b–d, included -COOH in EDTA, bridging S22− in MoS3, and edge S2− in MoS2. After adsorption, charges of Cu(Ⅱ) ions bonded moieties increased by 0.072 (-COOH), 0.065 (MoS3), and 0.038 (MoS2), respectively. The results indicated that the electrons belonged to oxygen in -COOH group, sulfur in MoS3 and MoS2 were transferred to the Cu(Ⅱ) ions and then participated in the formation of covalent bonds (Cu–O and Cu–S) during the adsorption process, which is consistent with the above XPS analysis for the shift of binding energy. The electrons transfer amount (QT) of both EDTA and MoS3 is larger than that of MoS2, resulted in both stronger interactions with Cu(Ⅱ) ions than that of MoS2, which was in good agreement with the analysis of adsorption energy.
In summary, a novel amorphous EDTA-MoSx (x=2, 3) composites was successfully synthesized via a facile one-step hydrothermal method, and was used to adsorb heavy metal ions from aqueous solution. The adsorption performance of EDTA-MoSx (x=2, 3) was significantly improved compared with that of pure MoS2 due to multiple active sites. Characterization techniques and DFT calculations, including adsorption energies, total electron density images, and Mulliken charge analysis, reveal that adsorption mechanism is mainly attributed to two aspects: (1) Bridging S22− of amorphous EDTA-MoSx (x=2, 3) combined with Cu(Ⅱ) ions; (2) Cu(Ⅱ) ions combined with -COOH of the EDTA-MoSx (x=2, 3) surface. This work is of great significance for the development of new amorphous phase adsorbents for heavy metal ions removal.
Declaration of competing interestThe authors declare that they have no known competing financial interests or personal relationships that could have appeared to influence the work reported in this paper.
AcknowledgmentsThis work was supported by the Natural Science Foundation of Tianjin (No. 18JCYBJC17700), the National Natural Science Foundation of China (Nos. 21406164, 21466035 and 22066022), the National Key Basic Research and Development Program of China (973 Program, No. 2014CB239300).
Appendix A. Supplementary dataSupplementary material related to this article can be found, in the online version, at doi:https://doi.org/10.1016/j.cclet.2020.12.020.
| [1] |
C. Luo, J. Routh, M. Dario, et al., Sci. Total Environ. 724 (2020) 138122. DOI:10.1016/j.scitotenv.2020.138122 |
| [2] |
J.P. Vareda, A.J.M. Valente, L. Duraes, J. Environ. Manage. 246 (2019) 101-118. DOI:10.1016/j.jenvman.2019.05.126 |
| [3] |
F. Lu, D. Astruc, Coord. Chem. Rev. 356 (2018) 147-164. DOI:10.1016/j.ccr.2017.11.003 |
| [4] |
X. Wang, M. Li, X. Song, et al., Environ. Sci. Technol. 50 (2016) 9619-9626. DOI:10.1021/acs.est.6b03321 |
| [5] |
K.S. Subrahmanyam, C.D. Malliakas, D. Sarma, et al., J. Am. Chem. Soc. 137 (2015) 13943-13948. DOI:10.1021/jacs.5b09110 |
| [6] |
W. He, K. Ai, X. Ren, et al., J. Mater. Chem. A 5 (2017) 19593-19606. DOI:10.1039/C7TA05076C |
| [7] |
A.E. Gash, A.L. Spain, L.M. Dysleski, et al., Environ. Sci. Technol. 32 (1998) 1007-1012. DOI:10.1021/es970804n |
| [8] |
L. Jia, W. Zhou, X. Huang, et al., Environ.-Sci. Nano 6 (2019) 3601-3610. DOI:10.1039/c9en00717b |
| [9] |
N. Abdullah, N. Yusof, W.J. Lau, et al., J. Ind. Eng. Chem. 76 (2019) 17-38. DOI:10.1016/j.jiec.2019.03.029 |
| [10] |
Q. Zhang, S. Bolisetty, Y. Cao, et al., Angew. Chem. Int. Ed. 58 (2019) 6012-6016. DOI:10.1002/anie.201901596 |
| [11] |
K. Hu, D. Xu, Y. Chen, J. Hazard. Mater. 393 (2020) 122376. DOI:10.1016/j.jhazmat.2020.122376 |
| [12] |
X. Zhao, L. Lv, B. Pan, et al., Chem. Eng. J. 170 (2011) 381-394. DOI:10.1016/j.cej.2011.02.071 |
| [13] |
J. Wang, L. Zhang, T. Zhang, et al., J. Mater. Sci. Technol. 35 (2019) 1809-1816. DOI:10.1016/j.jmst.2019.04.016 |
| [14] |
M. Hua, S. Zhang, B. Pan, et al., J. Hazard. Mater. 211–212 (2012) 317-331. |
| [15] |
C. Ling, Y. Zhao, Z. Ren, et al., Chin. Chem. Lett. 30 (2019) 2196-2200. DOI:10.1016/j.cclet.2019.09.035 |
| [16] |
M. Liu, L. Jia, Z. Zhao, et al., Chem. Eng. J. 390 (2020) 124667. DOI:10.1016/j.cej.2020.124667 |
| [17] |
X. Zhu, W. Jiang, W. Cui, et al., Chin. Chem. Lett. 30 (2019) 1133-1136. DOI:10.1016/j.cclet.2019.02.022 |
| [18] |
J. Li, Q. Wang, L. Zheng, et al., J. Mater. Sci. Technol. 41 (2020) 68-75. DOI:10.1016/j.jmst.2019.09.019 |
| [19] |
J. Li, X. Wang, G. Zhao, et al., Chem. Soc. Rev. 47 (2018) 2322-2356. DOI:10.1039/C7CS00543A |
| [20] |
Y. Xing, J. Cheng, J. Wu, et al., J. Mater. Sci. Technol. 45 (2020) 84-91. DOI:10.1016/j.jmst.2019.11.030 |
| [21] |
L.N. Pincus, A.W. Lounsbury, J.B. Zimmerman, Acc. Chem. Res. 52 (2019) 1206-1214. DOI:10.1021/acs.accounts.8b00668 |
| [22] |
J. Luo, M. Sun, C.L. Ritt, et al., Environ. Sci. Technol. 53 (2019) 2075-2085. DOI:10.1021/acs.est.8b07027 |
| [23] |
X. Shi, C. Wang, J. Zhang, et al., J. Mater. Sci. Technol. 51 (2020) 8-15. DOI:10.1016/j.jmst.2019.12.034 |
| [24] |
X. Zhang, J. Shen, S. Pan, et al., Adv. Funct. Mater. 30 (2020) 1909014. DOI:10.1002/adfm.201909014 |
| [25] |
Y. Yuan, S. Feng, L. Feng, et al., Angew. Chem. Int. Ed. 59 (2020) 4262-4268. DOI:10.1002/anie.201916450 |
| [26] |
L. Ma, Q. Wang, S.M. Islam, et al., J. Am. Chem. Soc. 138 (2016) 2858-2866. DOI:10.1021/jacs.6b00110 |
| [27] |
L. Ma, S.M. Islam, C. Xiao, et al., J. Am. Chem. Soc. 139 (2017) 12745-12757. DOI:10.1021/jacs.7b07123 |
| [28] |
S.P. Wu, X.Z. Dai, J.R. Kan, et al., Chin. Chem. Lett. 28 (2017) 625-632. DOI:10.1016/j.cclet.2016.11.015 |
| [29] |
Y. Zhang, S. Lin, J. Qiao, et al., Chem. Eng. J. 353 (2018) 225-236. DOI:10.1145/3242587.3242608 |
| [30] |
N. Zhang, G.L. Zang, C. Shi, et al., J. Hazard. Mater. 316 (2016) 11-18. DOI:10.1016/j.jhazmat.2016.05.018 |
| [31] |
K. Ai, C. Ruan, M. Shen, et al., Adv. Funct. Mater. 26 (2016) 5542-5549. DOI:10.1002/adfm.201601338 |
| [32] |
Z. Wang, B. Mi, Environ. Sci. Technol. 51 (2017) 8229-8244. DOI:10.1021/acs.est.7b01466 |
| [33] |
Z. Wang, A. Sim, J.J. Urban, et al., Environ. Sci. Technol. 52 (2018) 9741-9748. DOI:10.1021/acs.est.8b01705 |
| [34] |
J. Wang, X. Wang, G. Zhao, et al., Chem. Eng. J. 334 (2018) 569-578. DOI:10.1016/j.cej.2017.10.068 |
| [35] |
W. Li, M.C. Tekell, Y. Huang, et al., Adv. Energy Mater. 8 (2018) 1802108. DOI:10.1002/aenm.201802108 |
| [36] |
P. Gu, C. Zhao, T. Wen, et al., Chem. Eng. J. 359 (2019) 1563-1572. DOI:10.1016/j.cej.2018.11.016 |
| [37] |
F. Jia, Q. Wang, J. Wu, et al., ACS Sustain. Chem. Eng. 5 (2017) 7410-7419. DOI:10.1021/acssuschemeng.7b01880 |
| [38] |
H. Ye, L. Wang, S. Deng, et al., Adv. Energy Mater. 7 (2017) 1601602. DOI:10.1002/aenm.201601602 |
| [39] |
L.R.L. Ting, Y. Deng, L. Ma, et al., ACS Catal. 6 (2016) 861-867. DOI:10.1021/acscatal.5b02369 |
| [40] |
W. Fu, S. Yang, H. Yang, et al., J. Mater. Chem. A 7 (2019) 18799-18806. DOI:10.1039/c9ta05861c |
| [41] |
W. Fu, H. Chen, S. Yang, et al., Chemosphere 232 (2019) 9-17. DOI:10.1016/j.chemosphere.2019.05.182 |
| [42] |
C.G. Morales-Guio, X. Hu, Acc. Chem. Res. 47 (2014) 2671-2681. DOI:10.1021/ar5002022 |
| [43] |
S.C. Lee, J.D. Benck, C. Tsai, et al., ACS Nano 10 (2016) 624-632. DOI:10.1021/acsnano.5b05652 |
| [44] |
H. Yu, R. Yuan, D. Gao, et al., Chem. Eng. J. 375 (2019) 121934. DOI:10.1016/j.cej.2019.121934 |
| [45] |
R. Cattaneo, F. Rota, R. Prins, J. Catal. 199 (2001) 318-327. DOI:10.1006/jcat.2001.3170 |
| [46] |
Z. Zhu, S. Xi, L. Miao, et al., Adv. Funct. Mater. 29 (2019) 1904843. DOI:10.1002/adfm.201904843 |
| [47] |
J. Zolgharnein, M. Rastgordani, J. Chemometr. 32 (2018) e3043. DOI:10.1002/cem.3043 |
| [48] |
E.F.C. Chauque, J.C. Ngila, S.C. Ray, et al., J. Environ. Manage. 236 (2019) 481-489. DOI:10.1016/j.jenvman.2019.02.023 |
| [49] |
L. Cui, Y. Wang, L. Gao, et al., Chem. Eng. J. 281 (2015) 1-10. DOI:10.1016/j.cej.2015.06.043 |
| [50] |
J.C. Zuo, S.R. Tong, X.L. Yu, et al., J. Hazard. Mater. 235–236 (2012) 336-342. |
| [51] |
Y.H. Chang, C.T. Lin, T.Y. Chen, et al., Adv. Mater. 25 (2013) 756-760. DOI:10.1002/adma.201202920 |
| [52] |
H. Vrubel, D. Merki, X. Hu, Energy Environ. Sci. 5 (2012) 6136-6144. DOI:10.1039/c2ee02835b |
| [53] |
H.G.S. Casalongue, J.D. Benck, C. Tsai, et al., J. Phys. Chem. C 118 (2014) 29252-29259. DOI:10.1021/jp505394e |
| [54] |
J. Sun, Y. Chen, H. Yu, et al., J. Colloid Interface Sci. 532 (2018) 474-484. DOI:10.1016/j.jcis.2018.07.132 |
| [55] |
N. Sahebjamee, M. Soltanieh, S.M. Mousavi, et al., Carbohydr. Polym. 210 (2019) 264-273. DOI:10.1016/j.carbpol.2019.01.074 |
| [56] |
D. Lv, Y. Liu, J. Zhou, et al., Appl. Surf. Sci. 428 (2018) 648-658. DOI:10.1016/j.apsusc.2017.09.151 |
| [57] |
F. Jia, X. Zhang, S. Song, Phys. Chem. Chem. Phys. 19 (2017) 3837-3844. DOI:10.1039/C6CP07302F |
| [58] |
M. Li, D. Wei, T. Liu, et al., Sep. Purif. Technol. 227 (2019) 115696. DOI:10.1016/j.seppur.2019.115696 |