 2021, Vol. 32


b School of Chemistry and Chemical Engineering, Nanjing University, Nanjing 210023, China;
c School of Ecology and Environment Science, Zhengzhou University, Zhengzhou 450001, China
As a green and sustainable technology, photocatalysis has been increasingly studied due to its great potential in solving environmental pollution and energy crises [1-3]. In photocatalytic processes, photoactive materials, such as TiO2 [4], CeO2 [5], ZnCo2O4/Bi2O3 [6], g-C3N4/Ag3PO4 [7], SnO2 [8], BiOBr/TiO2/Ti3C2TX [9], GaN [10], CdS [11], and BiVO4/Znln2S4 [12] play decisive roles in the redox/charge-transfer reactions due to their unique electronic structures with a filled valence band (VB) and an empty conduction band (CB) [1]. Among them, CeO2 has been widely used in industry because Ce, as a rare-earth element, has a low price and relatively high abundance in the Earth's crust. As an n-type semiconductor (with a band gap similar to that of TiO2), it exhibits potential photocatalytic activity. However, the wide band gap restricts its photocatalytic efficiency [4,13]. Considering this, other components, including semiconductors and metals, have been introduced to improve UV and/or visible light absorption and prevent hole-electron recombination [14-17]. Moreover, the modification of CeO2 by controlling its size, morphology, and number of defects will be significant for improving its intrinsic photocatalytic properties [18,19].
Nanoscale CeO2, e.g., nanoparticles, nanosheets, and nanorods, can effectively enhance UV and/or visible light absorption and promote the adsorption of reactants due to its high specific surface area, thereby facilitating photocatalytic reactions [20]. Previous studies have mainly focused on the comparison of photocatalytic performance with different morphologies of CeO2 [21,22]. However, the intrinsic photocatalytic performance of CeO2 still needs to be further studied, especially the effect of defects on its catalytic performance, which needs to be studied with the same morphology or even uniform size. One-dimensional (1D) CeO2 nanorods with well-defined {100} and {110} planes show better photocatalytic performances than other stable polyhedral-structured CeO2 [13]. Additionally, the 1D nanorod structure dramatically improves the redox properties because of its more efficient and fast transport of photogenerated e− and h+ along the nanorod surface [23-26].
Defects in catalysts are crucial factors affecting photocatalytic performance. The defect formation energies in nanomaterials are lower due to the existence of a high-density interface, which leads to an increase in nonstoichiometric defects and the generation of electron carriers [27]. In addition, Ce ions usually show two valences (Ce3+ and Ce4+) due to their special outer electron structure of [Xe] 4f26s2, thus tending to form multivalent oxides of CeO2−x (x = 0−0.5) [13]. Therefore, a large number of oxygen vacancies (Vo) are easily formed on/in the surface/bulk of CeO2. Many strategies have been developed for the introduction of oxygen vacancies to CeO2 by using reductant including H2, CO, NH3, and Li [28-30]. These Vo are present both on the surface and in the bulk phase. The surface oxygen vacancies (Vo-s) can promote the increase in the Fermi level attributed to the generation of defect energy levels (near the bottom of the CB in CeO2) in the band gap, leading to a narrowed band gap and enhanced light absorption [31]. In addition, coordinative-unsaturated metal atoms (surrounding Vo) can act as strong binding sites for organic dyes, thus accelerating photocatalytic reactions [32,33]. Moreover, bulk oxygen vacancies (Vo-b) may act as recombination centers of photogenerated e− coming from the surface, resulting in a low utilization of photogenerated e− [34]. With an increasing concentration ratio (from Vo-s to Vo-b), the utilization of photogenerated e− for photodegradation can be improved, thus leading to improved photocatalytic performance [35-37]. Therefore, the precise regulation of Vo is of great significance to improve the intrinsic photocatalytic performance of CeO2 when applied to the degradation of organic dyes.
Herein, we synthesize and report a 1D CeO2 nanorod with uniform size and morphology. The hydrothermal method is used to tune the concentration ratio of surface/bulk oxygen vacancies in CeO2 nanorods. With the highest concentration of Vo-s to Vo-b, the CeO2 nanorod presents the narrowest band gap and the highest utilization of photogenerated e−. In regard to the photodegradation of rhodamine B, the percentage of removal reaches 70.2% after 120 min of ultraviolet−visible light irradiation, exhibiting potential application in wastewater purification. This tuning strategy of Vo also provides guidance for the development of other advanced metal-oxide semiconductor photocatalysts for the photodegradation of organic dyes.
The X-ray powder diffraction (XRD) patterns of the as-prepared CeO2-1, CeO2-2, and CeO2-3 are shown in Fig. 1a. The diffraction peaks of the catalysts were mainly assigned to the (111), (200), (220), (311), (222), (400), and (331) planes, which were indexed to the cubic fluorite structure of CeO2 crystals (JCPDS No. 34-0394). The field-emission scanning electron microscopy (FESEM) and transmission electron microscopy (TEM) images of CeO2-1, CeO2-2, and CeO2-3 are shown in Figs. 1b and c and Fig. S1 (Supporting information), respectively. All the samples are 1D nanorod structures. The shorter and narrower CeO2-1 and CeO2-2 nanorods loaded with small nanoparticles led to irregular surfaces with rough structures (Fig. 1c and Fig. S1). CeO2-3 exhibited longer and broader nanorods with smooth surfaces (Fig. S1d). Furthermore, two types of interference fringes of 0.19 and 0.31 nm were observed at the outer and inner nanorods from the high resolution transmission electron microscopy (HRTEM) image, which could be assigned to the (220) and (111) planes of the cubic fluorite structure CeO2, respectively (Fig. 1d). This result suggests that the preferred orientation growth of the individual CeO2-2 nanorods was along the [110] direction and that the main exposed crystal surface was the (220) plane, which had a higher photocatalytic activity than (111). In addition, an ~5 nm CeO2 nanoparticle on the CeO2-2 surface could be clearly seen, which likely formed during the initial crystal growth processes after the distribution of nucleation sites. Moreover, CeO2-2 exhibited a Brunauer-Emmett-Teller (BET) surface area of 137 m2/g, which was larger than those of CeO2-1 and CeO2-3 (52 and 47 m2/g, respectively) (Fig. S2 in Supporting information). Clearly, this large BET specific surface area was mainly attributed to its rough surface (Fig. 1c), thus providing abundant active sites and more Vo-s. These Vo-s were conducive to enhanced light absorption and reactant adsorption; additionally, the exposed (220) facets contributed to the high reactive activity, and both factors improved the photocatalytic performance of CeO2-2 nanorods.

|
Download:
|
| Fig. 1. Structure and morphology. (a) XRD patterns. (b-d) FESEM, TEM, and HRTEM images of CeO2-2. The pore defects and nanoparticles are marked by white dashed rectangles and arrows, respectively. | |
At present, several detection technologies can be used to resolve the Vo in metal oxides, such as, Raman spectrum, extended X-ray absorption fine structure spectroscopy (EXAFS), positron annihilation lifetime spectroscopy (PALS), electron paramagnetic resonance spectrum (EPR), aberration-corrected transmission electron microscopy (ACTEM), electron energy loss spectroscopy (EELS), and X-ray photoelectron spectroscopy (XPS) [38, 39]. Among those detection method, Raman, EXAFS, PALS, and EPR are often used to analyze the total Vo information in catalyst, while the ACTEM, EELS, and XPS are often used to analyze Vo in the local or surface of catalyst. In this paper, we combined Raman and XPS to semi-quantitatively analyze the concentration ratio of surface/bulk Vo in CeO2.
The Raman spectra providing the Vo information of the total crystal, including the bulk and surface, are shown in Fig. 2a. The sharp Raman peaks of CeO2-1, CeO2-2, and CeO2-3 were located at frequencies of 459, 459, and 461 cm−1, respectively, and these were attributed to the first-order vibrational mode with F2g vibration (symmetrical stretching mode of the Ce−O8 vibration unit) in a fluorite cubic structure. Compared with the reported value of 466 cm−1, the redshifts of the F2g vibration peaks were ascribed to the nanocrystalline nature of CeO2 [40]. The peak shifts of CeO2-1 and CeO2-2 were larger than those of CeO2-3, further indicating the smaller crystal grains of CeO2-1 and CeO2-2. The broader peaks at approximately 270 and 597 cm−1 corresponded to the second-order transverse acoustic mode and the defect (D) vibration (i.e., Vo), respectively [17,41]. TheI(D)/I(F2g) ratios of CeO2-1, CeO2-2, and CeO2-3 were estimated to be 0.048, 0.047 and 0.043, respectively, indicating all three had similar total Vo concentrations (Fig. S3 and Table S1 in Supporting information).

|
Download:
|
| Fig. 2. Tuning surface/bulk oxygen vacancies. (a) Raman spectra. (b) XPS Ce 3d spectra. (c) Schematic action mechanism at different surface/bulk oxygen vacancy ratios. | |
The Ce 3d XPS spectra presented the chemical state of elemental Ce (Fig. 2b). All the peaks could be mainly attributed to the spin−orbital doublet peaks of Ce 3d5/2 and 3d3/2, which could be deconvolved into four pairs, i.e., v1 (882.7 eV)/u1 (901.0 eV), v2 (885.4 eV)/u2 (903.7 eV), v3 (889.2 eV)/u3 (907.5 eV), and v4 (898.4 eV)/u4 (916.7 eV) [42, 43]. Among them, the v1/u1, v3/u3, and v4/u4 peaks referred to the Ce4+ 3d states, while the v2/u2 peak corresponded to the Ce3+ 3d states, indicating the composition of Ce4+ and Ce3+ in these CeO2. This absence of Ce3+ provided evidence of lattice oxygen depletion, further illustrating the existence of Vo on CeO2 surfaces. The surface oxygen vacancies, i.e., Vo-s, could decrease the band gap, thus enhancing light absorption and promoting photogenerated e− for photocatalysis. The Ce3+/Ce4+ ratios of CeO2-1, CeO2-2, and CeO2-3 were estimated to be 4.1%, 8.0%, and 3.8%, respectively, indicating that the order of Vo-s concentration was CeO2-2 > CeO2-1 > CeO2-3. Combining the Raman analysis (the total Vo concentrations in the order of CeO2-2 ≈ CeO2-1 ≈ CeO2-3) with the XPS results (the Vo-s concentrations in the order of CeO2-2 > CeO2-1 > CeO2-3), the order of Vo-b concentrations should be CeO2-2 < CeO2-1 < CeO2-3. Therefore, the concentration ratio of Vo-s to Vo-b was in the order of CeO2-2 > CeO2-1 > CeO2-3 (Table S1 in Supporting information). Fig. 2c illustrates the action mechanism of photodegradation by Vo under different concentration ratios of Vo-s to Vo-b. Briefly, h+/e− pairs would be generated under irradiation and migrate to the surface of CeO2, followed by their participation in catalytic reactions. During the migration process, a fair number of photogenerated e− may be captured by Vo-b and become invalid [35]. A higher concentration ratio of Vo-s to Vo-b led to more photogenerated h+/e− pairs and less recombination, which would improve the utilization of photogenerated e−. In contrast, in the case of a low ratio of Vo-s to Vo-b, most photogenerated e− would be depleted by recombination with more Vo-b, which would deteriorate the photodegradation activity.
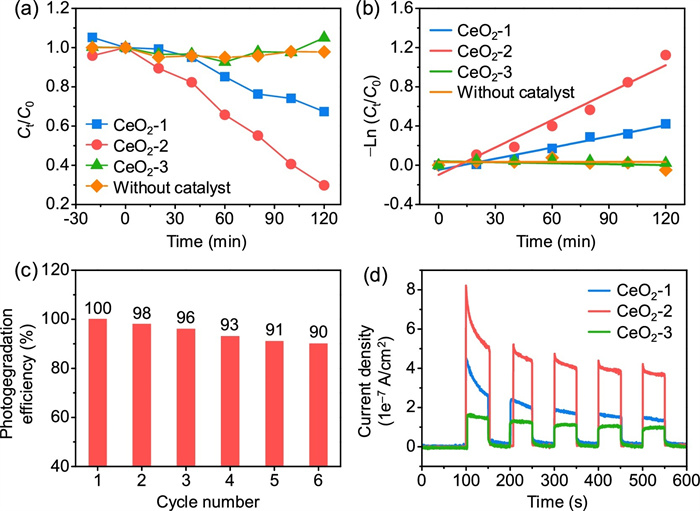
Fig. 3a shows the photocatalytic performances of the as-synthesized CeO2 nanorods for rhodamine B photodegradation under UV–vis light irradiation. The results showed that 29.8% and 67.4% of rhodamine B was discolored by CeO2-1 and CeO2-2, respectively. CeO2-2 displayed more efficient photocatalytic performance, which was approximately 2.3 times higher than that of CeO2-1 after 120 min of light irradiation. CeO2-3 demonstrated little activity for rhodamine B photodegradation, as shown in Fig. 3a. To quantitatively clarify the photocatalytic activities of different catalysts, rhodamine B photodegradation was studied based on the plots of −ln(Ct/C0) versus time (Fig. 3b) corresponding to the first-order kinetics model with a linear regression mechanism. As shown, the reaction rate constant k value of CeO2-2 was 0.0093 min−1, which was approximately 2.5 times that of CeO2-1 (0.0038 min−1). Accordingly, rhodamine B could be easily adsorbed on the CeO2-2 surface with abundant Vo-s by a first-order kinetics model. In contrast, the rhodamine B hardly degraded without photocatalyst under UV–vis light. These experimental results further confirmed that Vo-s played a crucial role in improving photocatalytic activity. Next, we explored the reusability of the catalyst (Fig. 3c). The photocatalytic cycling performance of CeO2-2 over six cycles slightly decreased for each 120 min run of rhodamine B degradation. These results suggest that CeO2-2 (with abundant Vo-s) was stable and could be reused for rhodamine B photodegradation. For congo red and methyl orange, CeO2-2 sample also has excellent degradation performance, indicating its application prospect in sewage treatment (Fig. S4 in Supporting information).

|
Download:
|
| Fig. 3. Photocatalytic degradation performance. (a) Photocatalytic activity of the photodegradation of rhodamine B for 120 min. (b) Corresponding plot of (C0−Ct) versus time. (c) Recycling performance of CeO2-2. (d) Photocurrent responses. | |
The photocurrent responses of the catalysts are shown in Fig. 3d, while the order of photocurrent response was CeO2-2 > CeO2-1 > CeO2-3 under alternating irradiation (lights on and off), which was consistent with the order of the concentration ratio of Vo-s to Vo-b. The photocurrent densities based on the BET surface area of three CeO2 nanorods are similar after 400s, indicating a negligible effect of surface area on the photocatalytic efficiency in the total photocatalytic processes (Fig. S5 in Supporting information). In regard to the CeO2-2 sample, its high concentration ratio of Vo-s to Vo-b could ensure that plenty of photogenerated e− were consumed during photodegradation, corresponding to the largest photocurrent intensity. Moreover, the photocurrent intensities of CeO2-2 exhibited a very slight decrease during the initial cycles and tended to be flat with increasing time, indicating a stable photoelectric characteristic.
The optical properties and band structures of CeO2-1, CeO2-2, and CeO2-3 were analyzed by UV–vis diffuse reflectance spectroscopy (DRS). Fig. 4a shows that the absorption band edges of CeO2-1, CeO2-2, and CeO2-3 were 428, 436, and 425 nm, respectively, which were higher than that reported for CeO2 (approximately 420 nm). These redshifts in the absorption bands indicated the quantum confinement effect of 1D-nanostructured CeO2 nanorods. Furthermore, the absorption band edge of CeO2-2 exceeded that of other CeO2 nanorods, suggesting an expanded UV light absorption range and enhanced UV-light-response ability due to its abundant Vo-s, which was the reason for its higher photocatalytic efficiency. The band gap energy (Eg) of three samples could be calculated based on the Tauc plot (Eq. 1):

|
Download:
|
| Fig. 4. Band gap analysis. (a) UV–vis diffuse reflectance spectra of the as-prepared samples. (b) Band gap measurement using the Tauc plot. (c) Photodegradation mechanism. | |

|
(1) |
where α, hν, A, and Eg signify the absorption coefficient, photoenergy, proportionality constant, and band gap energy, respectively. The constant n here equaled 1/2 because CeO2 is a direct-gap semiconductor. As shown in Fig. 4b, the Eg of CeO2-1, CeO2-2, and CeO2-3 was estimated to be 2.88, 2.82, and 2.92 eV, respectively, exhibiting a lower value compared with that reported for CeO2 (3.2 eV) [44]. This result could be attributed to the formation of localized states within the band gap due to the Vo and increased Ce3+ concentration. Previously, it has been shown that the presence of Ce3+ reduces the band gap, leading to an expanded UV light absorption range [45, 46]. CeO2-2 exhibited the narrowest Eg and generated more light-excited carriers under UV irradiation. The evaluated valance band potentials (EVB) of CeO2-1, CeO2-2, and CeO2-3 were +2.50, +2.47, and +2.52 eV, respectively [47]. They were smaller than the required potential for OH radical formation by OH− (∙OH/H2O pair, +2.68 eV) but larger than that by H2O (∙OH/OH− pair, +1.99 eV), indicating that the holes in the valance band could directly oxidize rhodamine B but could not oxidize water. The conduction band edge position could be calculated by the following equation (Eq. 2):

|
(2) |
As a result, the conduction band potentials (ECB) of CeO2-1, CeO2-2, and CeO2-3 were calculated to be −0.38, −0.35, and −0.40 eV, respectively, which were larger than the reduction potential for the reduction of molecular oxygen to superoxide anion radicals with strong oxidation (O2/∙O2− pair, −0.33 eV), which energetically satisfied the requirements for the degradation of rhodamine B.
Based on the Eg and band edge positions of the CeO2 nanorods, a photodegradation mechanism was proposed and is shown in Fig. 4c. Excitations (e−/h+) were produced when UV–vis light irradiated the CeO2 nanorods. These charge carriers rapidly transferred to the CeO2 surface due to the short transfer length in the 1D nanorod structure. The h+ in the valance band could directly oxidize rhodamine B; simultaneously, the e− in the conduction band could reduce molecular oxygen to superoxide anion radicals. In regard to the CeO2-2 sample, the narrow band gap ensured the generation of a large number of photogenerated e−. The higher concentration ratio of Vo-s to Vo-b improved the utilization of photogenerated e− because of the fast transfer of photogenerated e− for photodegradation on the surface and the decreased probability of photogenerated e− and Vo-b recombination in bulk. Additionally, the high specific surface area of CeO2-2 provided a large number of adsorption sites for the photodegradation of rhodamine B. Based on the above reasons, the CeO2-2 sample exhibited the best photodegradation performance.
In summary, we successfully prepared 1D CeO2 nanorods with a uniform size and morphology. By an easy hydrothermal method, we tuned the concentration of surface/bulk oxygen vacancies in CeO2 nanorods. With the highest concentration ratio (from Vo-s to Vo-b), the CeO2 nanorod presented more efficient utilization of photogenerated e− due to the fast transfer of photogenerated e− for photodegradation on the surface and the decreased probability of photogenerated e− and Vo-b recombination in bulk. In regard to the photodegradation of rhodamine B, the removal percentage reached 70.2% after 120 min of UV–vis light irradiation, exhibiting potential applications for wastewater purification. This Vo tuning strategy provides guidance for the development of other advanced metal-oxide semiconductor photocatalysts for the photodegradation of organic dyes.
Declaration of competing interestThe authors report no declarations of interest.
AcknowledgmentsThis work was financially supported by the National Natural Science Foundation of China (Nos. 21404054, 21667019, 22066017, 52000163), the Key Project of the Natural Science Foundation of Jiangxi Province (No. 20171ACB20016), the Jiangxi Province Major Academic and Technical Leaders Cultivating Object Program (No. 20172BCB22014), the Science and Technology Department of Jiangxi Province (Nos. 20181BCB18003, 20181BAB216012, 20181ACG70025, and 20192BAB206013), the Key Laboratory of Photochemical Conversion and Optoelectronic Materials, TIPC, CSA (No. PCOM201906), and the Key Project of Science and Technology Research of the Jiangxi Provincial Department of Education (Nos. DA201602063, GJJ13508, and GJJ191044), the Aviation Science Foundation of China (No. 2017ZF56020), the Fujian Key Laboratory of Measurement and Control System for Shore Environment (No. S1-KF1703), and the Program B for Outstanding PhD Candidate of Nanjing University (No. 202002B076).
Appendix A. Supplementary dataSupplementary material related to this article can befound, in the online version, at doi: https://doi.org/10.1016/j.cclet.2021.01.044.
| [1] |
A. Kubacka, M. Fernandez-Garcia, G. Colon, Chem. Rev. 112 (2012) 1555-1614. DOI:10.1021/cr100454n |
| [2] |
T. Hisatomi, J. Kubota, K. Domen, Chem. Soc. Rev. 43 (2014) 7520-7535. DOI:10.1039/C3CS60378D |
| [3] |
Y. Ma, X. Wang, Y. Jia, et al., Chem. Rev. 114 (2014) 9987-10043. DOI:10.1021/cr500008u |
| [4] |
Q. Guo, C. Zhou, Z. Ma, X. Yang, Adv. Mater. 31 (2019) 1901997. DOI:10.1002/adma.201901997 |
| [5] |
M. Aslam, M.T. Qamar, M.T. Soomro, et al., Appl. Catal. B: Environ. 180 (2016) 391-402. DOI:10.1016/j.apcatb.2015.06.050 |
| [6] |
J. Chen, J. Zhan, Y. Zhang, Y. Tang, Chin. Chem. Lett. 30 (2019) 735-738. DOI:10.3390/met9070735 |
| [7] |
M. Ding, J. Zhou, H. Yang, et al., Chin. Chem. Lett. 31 (2020) 71-76. DOI:10.1016/j.cclet.2019.05.029 |
| [8] |
Y. Chen, F. Sun, Z. Huang, et al., Appl. Catal. B: Environ. 215 (2017) 8-17. DOI:10.3847/1538-4357/aa7462 |
| [9] |
T. Xu, J. Wang, Y. Cong, et al., Chin. Chem. Lett. 31 (2020) 1022-1025. DOI:10.1016/j.cclet.2019.11.038 |
| [10] |
Z. Li, L. Zhang, Y. Liu, et al., Angew. Chem. Int. Ed. 59 (2020) 935-942. DOI:10.1002/anie.201912844 |
| [11] |
P. Zhang, S. Wang, B.Y. Guan, X.W. Lou, Energy Environ. Sci. 12 (2019) 164-168. DOI:10.1039/c8ee02538j |
| [12] |
D. Yuan, M. Sun, S. Tang, et al., Chin. Chem. Lett. 31 (2020) 547-550. DOI:10.1016/j.cclet.2019.09.051 |
| [13] |
W. Yang, X. Wang, S. Song, H. Zhang, Chem 5 (2019) 1743-1774. DOI:10.1016/j.chempr.2019.04.009 |
| [14] |
X. Yang, Y. Zhang, Y. Wang, et al., Chem. Eng. J. 387 (2020) 124100. DOI:10.1016/j.cej.2020.124100 |
| [15] |
K. Ye, Y. Li, H. Yang, et al., Appl. Catal. B: Environ. 259 (2019) 118085. DOI:10.1016/j.apcatb.2019.118085 |
| [16] |
M. Wang, M. Shen, X. Jin, et al., ACS Catal. 9 (2019) 4573-4581. DOI:10.1021/acscatal.8b03975 |
| [17] |
W. Lei, T. Zhang, L. Gu, et al., ACS Catal. 5 (2015) 4385-4393. DOI:10.1021/acscatal.5b00620 |
| [18] |
S. Bai, N. Zhang, C. Gao, Y. Xiong, Nano Energy 53 (2018) 296-336. DOI:10.1016/j.nanoen.2018.08.058 |
| [19] |
M. Xiao, Z. Wang, M. Lyu, et al., Adv. Mater. 31 (2019) 1801369. DOI:10.1002/adma.201801369 |
| [20] |
H. Tong, S. Ouyang, Y. Bi, et al., Adv. Mater. 24 (2012) 229-251. DOI:10.1002/adma.201102752 |
| [21] |
Y.C. Zhang, M. Lei, K. Huang, et al., Mater. Lett. 116 (2014) 46-49. DOI:10.1016/j.matlet.2013.10.085 |
| [22] |
C. Zhang, X. Zhang, Y. Wang, et al., New J. Chem. 38 (2014) 2581-2586. DOI:10.1039/C4NJ00214H |
| [23] |
X. Wang, Z. Li, J. Shi, Y. Yu, Chem. Rev. 114 (2014) 9346-9384. DOI:10.1021/cr400633s |
| [24] |
K. Zhou, Z. Yang, S. Yang, Chem. Mater. 19 (2007) 1215-1217. DOI:10.1021/cm062886x |
| [25] |
C. Pan, D. Zhang, L. Shi, J. Fang, Eur. J. Inorg. Chem. 2008 (2008) 2429-2436. DOI:10.1002/ejic.200800047 |
| [26] |
X. Lu, D. Zheng, J. Gan, et al., J. Mater. Chem. 20 (2010) 7118. DOI:10.1039/c0jm00487a |
| [27] |
H.L. Tuller, Solid State Ionics. 131 (2000) 143-157. DOI:10.1016/S0167-2738(00)00629-9 |
| [28] |
M.V. Ganduglia-Pirovano, A. Hofmann, J. Sauer, Surf. Sci. Rep. 62 (2007) 219-270. DOI:10.1016/j.surfrep.2007.03.002 |
| [29] |
J. Paier, C. Penschke, J. Sauer, Chem. Rev. 113 (2013) 3949-3985. DOI:10.1021/cr3004949 |
| [30] |
G. Ou, Y. Xu, B. Wen, et al., Nat. Commun. 9 (2018) 1302. DOI:10.1038/s41467-018-03765-0 |
| [31] |
A.D. Liyanage, S.D. Perera, K. Tan, Y. Chabal, K.J. Balkus, ACS Catal. 4 (2014) 577-584. DOI:10.1021/cs400889y |
| [32] |
H. Zhang, C. Li, L. Lyu, C. Hu, Appl. Catal. B: Environ. 270 (2020) 118874. DOI:10.1016/j.apcatb.2020.118874 |
| [33] |
S. Zhan, H. Zhang, X. Mi, et al., Environ. Sci. Technol. 54 (2020) 8333-8343. DOI:10.1021/acs.est.9b07245 |
| [34] |
Y. Huang, Y. Yu, Y. Yu, B. Zhang, Sol. RRL 4 (2020) 2000037. DOI:10.1002/solr.202000037 |
| [35] |
M. Kong, Y. Li, X. Chen, et al., J. Am. Chem. Soc. 133 (2011) 16414-16417. DOI:10.1021/ja207826q |
| [36] |
Y. Wang, J. Cai, M. Wu, et al., Appl. Catal. B: Environ. 239 (2018) 398-407. DOI:10.3390/electronics7120398 |
| [37] |
H. Tan, Z. Zhao, M. Niu, et al., Nanoscale 6 (2014) 10216-10223. DOI:10.1039/C4NR02677B |
| [38] |
Z. Li, K. Werner, K. Qian, et al., Angew. Chem. Int. Ed. 58 (2019) 14686-14693. DOI:10.1002/anie.201907117 |
| [39] |
Z. Su, W. Yang, C. Wang, et al., Environ. Sci. Technol. 54 (2020) 12684-12692. DOI:10.1021/acs.est.0c03981 |
| [40] |
P. Trogadas, J. Parrondo, V. Ramani, ACS Appl. Mater. Interfaces 4 (2012) 5098-5102. DOI:10.1021/am3016069 |
| [41] |
W.H. Weber, K.C. Hass, J.R. McBride, Phys. Rev. B: Condens. Matter Mater. Phys. 48 (1993) 178-185. DOI:10.1103/PhysRevB.48.178 |
| [42] |
L.R. Shah, B. Ali, H. Zhu, et al., J. Phys. Condens. Matter 21 (2009) 486004. DOI:10.1088/0953-8984/21/48/486004 |
| [43] |
M.S.P. Francisco, V.R. Mastelaro, P.A.P. Nascente, A.O. Florentino, J. Phys. Chem. B 105 (2001) 10515-10522. DOI:10.1021/jp0109675 |
| [44] |
H. Miao, G.F. Huang, J.H. Liu, et al., Appl. Surf. Sci. 370 (2016) 427-432. DOI:10.1016/j.apsusc.2016.02.122 |
| [45] |
Y. Li, Q. Sun, M. Kong, et al., J. Phys. Chem. C 115 (2011) 14050-14057. DOI:10.1021/jp202720g |
| [46] |
P. Patsalas, S. Logothetidis, L. Sygellou, S. Kennou, Phys. Rev. B 68 (2003) 035104. DOI:10.1103/PhysRevB.68.035104 |
| [47] |
L.T. Thanh, T.D.A. Quang, T.T.T. Toan, et al., J. Environ. Chem. Eng. 6 (2018) 5999-6011. DOI:10.1016/j.jece.2018.09.022 |