 2021, Vol. 32

b Hubei Key Laboratory of Low Dimensional Optoelectronic Materials and Devices, Hubei University of Arts and Science, Xiangyang 441053, China;
c ARC Centre of Excellence for Electromaterials Science, Intelligent Polymer Research Institute, Australia Institute for Innovative Materials (AⅡM), Innovation Campus, University of Wollongong, Wollongong 2519, Australia;
d School of Materials Science and Engineering, China University of Petroleum (East China), Qingdao 266580, China
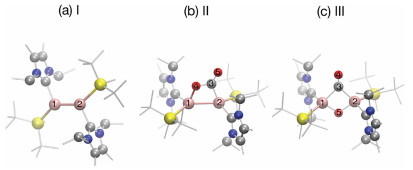
Carbon dioxide, a dominant greenhouse gas, is a main component of industrial discharges and automobile emissions [1-3]. Over the past decades, increasing anthropogenic CO2 emissions cause severe environmental issues and global warming [4-6]. Known heterogeneous catalysts such as transition metals [7, 8], frustrated Lewis pairs [9, 10], and main-group multiple bonds complexes [11] have proven to be promising routes for CO2 capture and utilization [12-14] in the past few years. Among various catalysts, main group compounds have attracted much attention and are expected to replace transition metals due to its economical and eco-friendly properties [15-16]. Dialumene, a neutral species with a formal Al=Al double bond, has recently emerged as a viable approach to capture CO2 [17]. Due to the maturity of aluminum used as industrial catalyst and the abundance of this element in the Earth's crust, dialumene is a promising candidate for converting CO2 into commodity chemicals. However, the catalytic application of aluminum double bond species in its low oxidation state are still not well understood. Experimentally, CO2 fixation on dialumene via [2+2]-cycloaddition to form a planar 4-membered ring compound II, which subsequently underwent CO cleavage to form a bridging carbonyl compound III, this later compound was then further converted into various value-added products (Fig. 1) [18]. The structures of compounds II and III were proposed by accounting to structural analogous to related diboron and disilicon compounds. However, no direct experimental evidence exists so far. The ignorance of detailed structures of reaction intermediates hindered further mechanistic study on this promising catalytic route. One of the difficulties in identifying the intermediate species is the possible thermodynamic instability of these compounds, which might coexist during the reaction processes. To fully understand the mechanism of dialumene catalyzed CO2 fixation and conversion, it is necessary to reveal the detailed structures of individual kinetic intermediates in the catalytic pathway.

|
Download:
|
| Fig. 1. Fully optimized ground state structures of compounds (a) I, (b) II and (c) III. Al, Si, O, N and C atoms are denoted by pink, yellow, red, blue and gray balls, respectively. All methyl groups in both NHC and Si ligands are shown gray lines for better visibility. | |
The characterization of the fast kinetics of the CO2-dialumene binding and interconversion between different species requires a tool with simultaneous high spatial and temporal resolution [19, 20]. Raman spectroscopy is capable of providing chemical structure fingerprint is a powerful technique for the investigation complex systems. However, conventional Raman spectroscopy often fails to work in catalyst characterization due to strong fluorescence interference caused by impurities, organic species and defect sites. Raman intensity is relatively low due to its two-photon scattering nature [21]. These shortcomings limit its application in heterogeneous catalysis.
Resonance Raman (RR), by virtue of resonance enhancement that gives high signal-to-noise ratio, while inheriting the sensitivity to local chemical environments from normal Raman [22-25], was proposed to characterize the microscopic structure and dynamics of condensed phases. Raman signals associated with different components can be selectively enhanced by several orders of magnitude owing to the resonance effect, automatically filtering out vibration signals not strongly coupled with the current electronic excitation. The CO2-dialumene binding intermediates exhibit absorption bands in the range 330-600 nm, which are well separated from each other. The dominant excitations contributing to the UV–vis absorption for each compound can be attributed to transitions near the catalytic active sites. By excitation with different color of lights resonant to corresponding electronic transitions, the vibration modes strongly coupled to the electronic transition can be identified by their significantly enhanced characteristic signals, enabling the characterization of different structures, even at a low concentration. In addition, the vibration modes from solvent and other environmental species can be filtered out by carefully select excitation wavelength. The RR effect not only increases the sensitivity but also the selectivity, providing complementary information for the identification of chemical species, which is a prerequisite for the detailed understanding of the molecular mechanism [23, 26-28].
In order to achieve high temporal resolution of a few femtosecond to capture reaction snapshots, a time-domain stimulated multi-pulse version of the RR technique, named stimulated resonance Raman (stRR) implemented with ultrafast broadband UV–vis pulses, has been proposed in our previous work [23]. The simultaneous high spatial and temporal resolutions making it a promising tool for dynamical and kinetical characterization [29, 30].
Here, we report a systematic RR study on the species might exist during dialumene based CO2 fixing reaction. Vibration resolved UV–vis absorption spectra were first examined to guide the selection of excitation wavelengths for following RR simulations. The spectroscopic features excited with different wavelengths of incident lights demonstrate the excitation wavelength selectivity of the RR technique. The ability of RR in distinguishing reaction intermediates is advantageous, due to the ability to selective detect signals from the active center, which is crucial to the catalytic reaction. Importantly, the high temporal resolution of the stRR technique enables the characterization of transient states during the fast Al-CO2-Al binding and C-O cleavage processes. This study is beneficial for the deeper understanding of the role of the active sites and the formation mechanism in these materials, which would help the rational design of high performance catalysts for CO2 fixation.
The optimized ground state geometries and harmonic vibration frequencies of all compounds were calculated by using density functional theory (DFT) at the B3LYP/cc-pVTZ level of theory implemented in the Gaussian 09 package [31]. The calculated vibration frequencies were scaled by 0.97 to correct the systematic errors [32]. The electronic transitions with natural transition orbital (NTO) analysis [33, 34] were calculated by time-dependent density functional theory (TDDFT) at the same level as used in the ground state calculations. The first order Franck-Condon approximation was considered and higher order Herzberg-Teller terms were neglected during our calculations.
The fully optimized geometric structures are shown in Fig. 1. For clarity, we denote the initial dialumene species as compound I (Fig. 1a); the intermediate with planar 4-membered Al-Al-C-O ring structure with an exocyclic carbonyl moiety as compound II (Fig. 1b), which is the first product after CO2 binding to the dialumene; the intermediate contains a central Al-CO-Al-O core with the NHC and silyl groups trans-orientated to the ring as compound III (Fig. 1c). Our geometric and vibrational results are in good agreement with previous measurements and calculations (detailed comparison listed in Table S1 in Supporting information) [17], ensuring the predictivity of the selected computational methods.
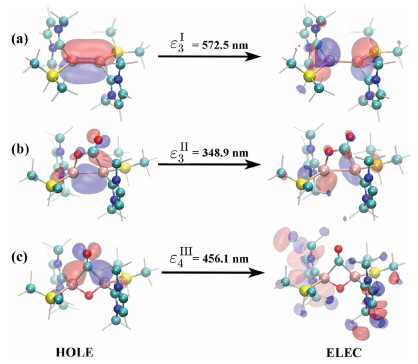
To illustrate the capability of RR to characterize the catalysts and catalytic active sites in dialumene based CO2 capture, we aimed to establish the correlation between the structure components and their spectroscopic signatures. Appropriate wavelength for the incident light is required to get most from the resonance enhancement. These wavelengths can be obtained by examining the UV–vis absorption spectra for each compound, as shown in Fig. 2. We note that the absorption maxima depend on the species and separate from each other: compound I has strong absorption bands in the range 500~600 nm, while the significant absorption occurs in the range 350~400 nm for compound II, and around 450 nm for compound III. The significant separation of absorption bands in the frequency domain allows for feasible selective excitation of any of these compounds, which would help efficient spRR and stRR characterization. Only vibration modes reside in the region where a specific electronic transition occurs would pronounced in RR measurements. Therefore, we assessed the spatial distribution of the strongly allowed electronic excitations by performing NTO analysis. The NTO plots of the interested electronic transitions of the three compounds are depicted in Fig. 3.

|
Download:
|
| Fig. 2. (a-c) Vibration resolved UV–vis absorption spectra for compounds I-III, respectively. The total absorption spectra are plotted in black. Electronic excitation resolved spectra with significant contributions, labeled by, are also provided. | |

|
Download:
|
| Fig. 3. Spatial distributions of selected NTOs for compounds I, II and III. | |
For compound I, three excitations contribute significantly to the total UV–vis spectrum. The stronger absorption band lies in the range of 16, 600–20, 000 cm-1 (~600–500 nm), which is assigned to the excitations ε3I and ε4I, where the superscript I and subscript i denote Compound I and its i-th excitation, respectively. The weaker absorption bands from 25, 000–27, 000 cm-1 (~400–370 nm) is mainly contributed by ε11I. Here, we focused on the strongest excitation ε3I, which gives rise to a broad absorption band with a maximum at 572.5 nm (17, 466 cm-1). The lowest strong absorption band of compound II lies in the range of 24, 000–28, 000 cm-1 (~420–360 nm), which is contributed by ε1II at 424.8 nm (23, 540 cm-1). Another absorption peak, with even stronger intensity, appears at 349 nm (28, 666 cm-1), arose from the ε3II excitation. The strong adsorption band of compound III at 456 nm (~21, 930 cm-1) is mainly contributed by ε4II. In the following, we designed RR measurements with incident wavelengths resonant to ε3I, ε3II, and ε4III for compound I, II and III, respectively. This decision was made to get most from the resonant enhancement of the RR technique, where vibration signatures of different compounds can be effectively selected by tuning the excitation wavelength.
Strong vibronic coupling requires that vibration mode and electronic transition occurs, at least partly, in the same region. The locality of electronic excitations was assessed by corresponding NTO analysis. The spatial distributions of NTOs of ε3I are depicted in Fig. 3a, which is a typical ligand-to-metal charge transfer (LMCT) excitation: The Al=Al double bond, NHC and Si ligands are involved. The NTO plots of the ε3II excitation is depicted in Fig. 3b. It is a typical central characteristic transition with the hole state localized at both the Al=Al double bond and C=O bond. As shown in Fig. 3c, ε4III, the hole state has a non-bonding character between C and O, while C strongly binds to the two Al atoms. On the other hand, the electron state is quite delocalized among the ligands.
With the aid of UV–vis spectra and NTO analysis, we are able to design spRR measurements to detect each of the compounds interested. It is also possible to have a look at the panorama of the spRR features enhanced with excitations in a continuous range, as shown in Fig. 4. The horizontal axes in Fig. 4 represent the Raman shift, in the range of 300-1700 cm-1; while the vertical axes, incident frequencies. Therefore, a horizontal slice in Fig. 4 corresponds to a spRR spectrum with corresponding incident wavelength; and a vertical slice corresponds to the Raman profile of the specified vibration mode. Observing the 2D spRR spectra vertically, it is obvious that the signal strength increases significantly as the excitation energy enters the resonance region, and the central positions of the intense Raman bands are consistent with those of the absorption bands discussed above. In detail, for compound I, characteristic spRR bands can be found in the spectral region with excitation energies in the range 16, 000~20, 000 cm-1. They are in consistent with the resonant excitations, ε3I at 17, 466 cm-1 (572.5 nm) and ε4I at 18, 998 cm-1 (526.4 nm). In this region, the most intense spectral features are those at the lower-left corner (300~600 cm-1), which can be assigned to vibration modes involving Al=Al double bond stretching. It is also consistent with the NTO analysis of the ε3I (Fig. 3a). There is another weaker band located from 24, 000–26, 000 cm-1, mainly contributed by ε11I. Compare the 2D spRR spectra among the three compounds, only compound I has visible signals when using incident energies below 20, 000 cm-1, while either II or III is RR-silent. This strongly suggest that using excitation energies below 20, 000 cm-1 (with incident wavelengths longer than 500 nm), would be feasible for compound I detection. The Raman active vibration modes of compound I are listed in Table 1. Vibration modes with frequencies in the range 300-600 cm-1, such as the Si-Al stretching coupled with Al=Al swing mode at 330 cm-1, the Al-Al bending coupled with Al=Al stretching mode at 397 cm-1, and the Al-Al stretching mode at 472 cm-1 are strongly coupled to the ε3I excitation. The methyl CH bending modes (~739 cm -1) in the ligand also pronounced in the 2D spRR spectra, but is not sufficiently characteristic due to the probable wide existence of this group. In short, the use of an incident 572.5 nm beam could lead to selective enhancement of vibration modes involving Al=Al double bond stretching compound I, which can be used as characteristic features for chemical identification. Note that the selectivity of RR exerts rather restrict to pronounced signals, including electronic transition energy, vibration frequency and vibronic coupling strength, the possibility that other modes from other species contribute to the same RR patterns can be filter out. Therefore, it is safe to made the above signal assignments.

|
Download:
|
| Fig. 4. (a-c) 2D spRR spectra of compounds I-III. Horizontal and vertical axes represent the Raman shift and excitation energy, respectively. | |
|
|
Table 1 Raman active modes of compound I. All frequencies in wavenumbers. |

Fig. 4b depicts the 2D spRR spectra of compound II, which is distinct to that of compound I. As mentioned earlier, excitations below 20, 000 cm-1 is RR-silent, due to the fact that no electronic transition exists in this region (Fig. 2b). The 2D spRR features can be classified into two categories: 1) spRR signals with excitation energies in the range of 23, 000~28, 000, corresponds to electronic transition ε3II, and 2) signals with excitation energies above 28, 000 cm-1, corresponds to ε3II. We note that, compared to group 1), group 2) has much richer features, indicating more vibration modes are strongly coupled to ε3II. This can be rationalized by considering the locality of relevant vibration modes and electronic transitions. For instance, as listed in Table 2, the breathing mode of the 4-membered ring at 515 cm-1 and the Al1-O4 stretching mode at 785 cm-1 are absent in ε1II excitation, while these modes pronounced in ε3II excitation. Both modes are localized on the active center. They are highly probable to couple strongly with ε3II, also localized in the same region, but not ε1II, as shown in Fig. S1 (Supporting information). Other Raman bands, at 323, 351, 420 and 1612, are all characteristic to compound II, which would provide sufficient evidence in detecting this intermediate.
|
|
Table 2 Raman active modes of compound II. All frequencies in wavenumbers. |

The 2D spRR spectra of compound III in Fig. 4c possess rather distinct features in comparison with those of compounds I and II. The RR band of compound III appears when the excitation energies were tuned around 21, 000-25, 000 cm-1 which is resonant with the excitation of ε4III. As listed in Table 3, the Al1-Al2 stretching at 453 cm-1, the Al1-O5-Al2 ring breathing at 658 cm-1, and the C3=O4 stretching at 1599 cm-1 are enhanced and can be used as characteristic to compound III. Observing these signals simultaneously would be a solid evidence of the existence of compound III.
|
|
Table 3 Raman active modes of compound III. All frequencies are wavenumbers. |

In order to assess the proposed characteristic RR signals in detail, we plotted the corresponding horizontal slices corresponding to incident excitations resonant with the selected electronic transitions for each compound. As the solid lines shown in Fig. 5, each slice takes the form of conventional RR spectrum. ε3I excitation was selected for compound I, where only vibration modes below 700 cm-1 were enhanced considerably. These signals were assigned to modes involving deformations of Al=Al and Si-Al bonds, which are localized at the catalytic active center. This is the direct consequence of the ε excitation is also localized in the same region, making strong vibronic coupling probable. As a counterexample, the vibration modes with frequencies higher than 700 cm-1, involving deformations involving NHC ligand, localized at the periphery of the active center, would not strongly coupling to the selected electronic transition, thus are inapparent. The ε3II electronic transition was selected for compound II. There is a very intense band at 333 cm-1, assigned to the significant Al1-Al2 stretching coupled with the Al1-O4-C3 bending mode. Other RR bands of compound II are too weak to get confident signals. Compound III can be detected using ε4III (456.1 nm) excitation, there are two intense bands. The lower-frequency band is contributed by the Al1-Al2 stretching band centered at 456 cm-1 together with a shoulder peak at 426 cm-1. The latter is assigned to the Al1-C3 wagging coupled with Si-Al1 stretching mode. The higher-frequency band can be ascribed to the C3=O4 stretching at 1599 cm-1. Both bands are characteristic to compound III because they originate from the Al-CO-Al-O structure composing the catalytic center.

|
Download:
|
| Fig. 5. spRR (solid) and stRR (dash) spectra of compounds I (red), compound II (blue) and compound III (green) following the resonant excitation. Here, = 572.5 nm, = 348.9 nm and = 456.1 nm. | |
stRR, a time-domain variant of the spRR, combined with ultrafast broadband UV or visible pulses, would have sufficient high temporal resolution to capture spectroscopic snapshots for reaction intermediates [23]. Here we present the one dimensional (1D) stRR results simulated to illustrate the applicability of this technique in catalysis investigation. The 1D stRR spectra are shown in Fig. 5 as dashed lines, accompanied with the frequency-domain spontaneous version (solid lines). Two pulses, a pump and a probe, were used in the calculation. We label the center frequencies of these two pulses as (ε0, εiS), where the pump is chosen ε0 = 10, 000 cm-1, which is far away from the lowest excitations of compounds I-III, ensuring the simulated stRR signals would not be contaminated by excited state contributions [23]. The probe is chosen to be resonant with the selected electronic excitation for each system. This pulse configuration preserves the selectivity and resonant enhancement of spRR, in the meantime, avoid excited state population probably caused by the pump. This is crucial especially for molecules with long excited state lifetimes. In the following, the pump was chosen to be centered at 10, 000 cm-1, which is off-resonant with any excited states of the compounds in consideration. As shown in Fig. 5a, similar to the spRR signals (solid lines), the stRR signals (dash lines) of the three compounds have distinctive features, ensuring their capability for structure characterization. The 1D stRR spectrum with δ0 = 10, 000 cm-1 and ε3I reproduces all the characteristic features of the compound I. Although the 1D stRR spectra resemble the main features of their spRR counterparts, the relative intensities of the peaks vary, such as the peaks at 397 cm-1 in the stRR is much stronger than in the spRR spectrum under the resonance excitation of ε3I. As a result, the active mode at 397 cm-1 presents a close intensity to the mode 3 at 472 cm-1. Similarly, we find that the Raman band at 1599 cm-1 shows a much weaker intensity in the stRR process under the excitation of ε4III. A strong signal in the stRR spectra implies that the corresponding vibrational excitation survives the time delay between the pump and probe pulses and hence produces a strong correlation. Furthermore, the survived signals were enhanced twice by the two pulses, resulting in much higher signal-to-noise ratio. In addition, one-dimensional stimulated resonance Raman signals are obtained by varying the time delay of τ between two ultrafast pump and probe pulses. As a result, it could be conducted at the femtosecond time scale, which is fast enough to capture the transient intermediates during the catalyzed reaction. Combined with the higher signal-to-noise ratio (SNR) of the vibronic strongly coupled modes to the specified electronic transitions, stRR is a useful tool to characterize the local chemical environment and to identify microscopic structures in compound surroundings, even during nonequilibrium processes. The high spatial and temporal resolution and high SNR make this technique a powerful tool for the dynamical characterization of biochemical reactions.
In conclusion, by using ab-initio calculations, the characteristic RR features of catalytic intermediates probably exist during dialumene based CO2 fixation are presented. The correlations between RR signatures and the underlying molecular structures are constructed and would guide future experimental characterizations. Fingerprint analysis of intermediate structures shows that different intermediate species can be selectively probed, identified and characterized by spRR/stRR spectroscopy. In addition to the Al-Al stretching, both the C3=O5 stretching of compound II and the C3=O4 stretching of compound III are also strongly resonance enhanced and can be clearly identified. Aided by resonant enhancement, spRR and stRR spectroscopy exhibit great potential as a tool in catalytic chemical analyses to reveal the microscopic dynamical reaction details. By carefully select excitation energy, it can not only filter out the vibration modes of solvents or other environmental species, but also monitor the transient catalytic intermediates under reaction conditions. Combined with conventional experimental characterization methods, this technique can be used as a powerful tool to monitor the structural and dynamic information of intermediate species during the dialumene based CO2 capture reaction.
Declaration of competing interestThe authors declare that they have no known competing financial interests or personal relationships that could have appeared to influence the work reported in this paper.
AcknowledgmentsWe acknowledge the financial support from the National Natural Science Foundation of China (NSFC, No. 21773309), High-level Science Foundation of Qingdao Agricultural University (No. 663/1114351), the Fundamental Research Funds for the Central Universities (No. 19CX05001A), Hubei University of Arts and Science (No. 2020kypytd002) and Xiangyang Science and Technology Research and Development (No. 2020YL09). Part of the calculations were carried out at the National Supercomputing Center in Shanghai.
Appendix A. Supplementary dataSupplementary material related to this article can be found, in the online version, at doi:https://doi.org/10.1016/j.cclet.2021.02.011.
| [1] |
W.D. Jones, J. Am. Chem. Soc. 142 (2020) 4955-4957. DOI:10.1021/jacs.0c02356 |
| [2] |
A.M. Appel, J.E. Bercaw, A.B. Bocarsly, et al., Chem. Rev. 113 (2013) 6621-6658. DOI:10.1021/cr300463y |
| [3] |
J.D. Figueroa, T. Fout, S. Plasynski, H. McIlvried, R.D. Srivastava, Int. J. Greenh. Gas Control. 2 (2008) 9-20. DOI:10.1016/S1750-5836(07)00094-1 |
| [4] |
R. Behling, S. Valange, G. Chatel, Green Chem. 18 (2016) 1839-1854. DOI:10.1039/C5GC03061G |
| [5] |
S. Xu, E.A. Carter, Chem. Rev. 119 (2019) 6631-6669. DOI:10.1021/acs.chemrev.8b00481 |
| [6] |
R. Sen, A. Goeppert, S. Kar, G.K.S. Prakash, J. Am. Chem. Soc. 142 (2020) 4544-4549. DOI:10.1021/jacs.9b12711 |
| [7] |
C. Weetman, S. Inoue, ChemCatChem 10 (2018) 4213-4228. DOI:10.1002/cctc.201800963 |
| [8] |
P.P. Power, Nature 463 (2010) 171-177. DOI:10.1038/nature08634 |
| [9] |
T.W. Yokley, H. Tupkar, N.D. Schley, N.J. DeYonker, T.P. Brewster, Eur. J. Inorg. Chem. 2020 (2020) 2958-2967. DOI:10.1002/ejic.202000437 |
| [10] |
D.W. Stephan, G. Erker, Angew. Chem. Int. Ed. 54 (2015) 6400-6441. DOI:10.1002/anie.201409800 |
| [11] |
I. Alvarado-Beltran, A. Rosas-Sánchez, A. Baceiredo, et al., Angew. Chem. Int. Ed. 56 (2017) 10481-10485. DOI:10.1002/anie.201705644 |
| [12] |
J. Liu, C. Chen, K. Zhang, L. Zhang, Chin. Chem. Lett. 32 (2021) 649-659. DOI:10.1016/j.cclet.2020.07.040 |
| [13] |
X. Fu, H. Yang, L. Fu, et al., Chin. Chem. Lett. 32 (2021) 1089-1094. DOI:10.1016/j.cclet.2020.08.031 |
| [14] |
L. Yang, C. Shi, L. Li, Y. Li, Chin. Chem. Lett. 31 (2020) 227-230. DOI:10.1016/j.cclet.2019.04.025 |
| [15] |
N. Wiberg, W. Niedermayer, K. Polborn, P. Mayer, Chem. Eur. J. 8 (2002) 2730-2739. DOI:10.1002/1521-3765(20020617)8:12<2730::AID-CHEM2730>3.0.CO;2-Q |
| [16] |
F. Hanusch, L. Groll, S. Inoue, Chem. Sci. 12 (2021) 2001-2015. DOI:10.1039/D0SC03192E |
| [17] |
C. Weetman, P. Bag, T. Szilvási, C. Jandl, S. Inoue, Angew. Chem. Int. Ed. 58 (2019) 10961-10965. DOI:10.1002/anie.201905045 |
| [18] |
C. Weetman, A. Porzelt, P. Bag, F. Hanusch, S. Inoue, Chem. Sci. 11 (2020) 4817-4827. DOI:10.1039/D0SC01561J |
| [19] |
S. Jin, Z. Feng, F. Fan, C. Li, Catal. Lett. 145 (2015) 468-481. DOI:10.1007/s10562-014-1416-0 |
| [20] |
S. Jin, M. Guo, F. Fan, et al., J. Raman Spectrosc. 44 (2013) 266-269. DOI:10.1002/jrs.4188 |
| [21] |
S. Mukamel, Principles of Nonlinear Optical Spectroscopy. 1st ed. New York: Oxford University Press, 1995.
|
| [22] |
H. Ren, J. Jiang, S. Mukamel, J. Phys. Chem. B 115 (2011) 13955-13962. DOI:10.1021/jp207849u |
| [23] |
H. Ren, J.D. Biggs, S. Mukamel, J. Raman Spectrosc. 44 (2013) 544-559. DOI:10.1002/jrs.4210 |
| [24] |
N.M. Monezi, R.A. Ando, J. Raman Spectrosc. 48 (2017) 758-764. DOI:10.1002/jrs.5091 |
| [25] |
H. Ma, J. Liu, W. Liang, J. Chem. Theory Comput. 8 (2012) 4474-4482. DOI:10.1021/ct300640c |
| [26] |
D.A. Long, The Raman Effect: A Unified Treatment of the Theory of Raman Scattering by Molecules. 1st ed. Chichester: John Wiley & Sons Ltd., 2002: pp. 2002.
|
| [27] |
S.A. Asher, Annu. Rev. Phys. Chem. 39 (1988) 537-588. DOI:10.1146/annurev.pc.39.100188.002541 |
| [28] |
H. Ren, Z. Lai, J.D. Biggs, J. Wang, S. Mukamel, Phys. Chem. Chem. Phys. 15 (2013) 19457-19464. DOI:10.1039/c3cp51347e |
| [29] |
H. Ren, Y. Zhang, S. Guo, et al., Phys. Chem. Chem. Phys. 19 (2017) 31103-31112. DOI:10.1039/C7CP06206K |
| [30] |
B. Tian, C. Cheng, T. Yue, N. Lin, H. Ren, Chem. Phys. 513 (2018) 1-6. DOI:10.1016/j.chemphys.2018.06.006 |
| [31] |
M.J. Frisch, G.W. Trucks, H.B. Schlegel, et al., Gaussian 09, Gaussian, Inc., Wallingford CT (2016). |
| [32] |
J.P. Merrick, D. Moran, L. Radom, J. Phys. Chem. A 111 (2007) 11683-11700. DOI:10.1021/jp073974n |
| [33] |
R.L. Martin, J. Chem. Phys. 118 (2003) 4775-4777. DOI:10.1063/1.1558471 |
| [34] |
X. Mu, Y. Guo, Y. Li, et al., J. Raman Spectrosc. 48 (2017) 1196-1200. DOI:10.1002/jrs.5193 |