 2021, Vol. 32


Epigenetics represents molecular mechanisms causing changes in gene expression independent of DNA sequence, the key of which is the regulation of the reversible chromatin rearrangement [1, 2]. In nucleus, chromatin presents as "beads-on-string" form, with nucleosomes formed by wrapping DNA around histones as the first subunit [3]. The tightness of packing between nucleosomes, or the condensation level of chromatin, is variable along lifespan of cells, and is closely related to gene regulation [2]. Modifications of histones and DNA through methylation, citrullination, acetylation or phosphorylation can mediate condensation level of chromatin [3, 4]. For example, addition of an acetyl group on lysine of histones N-terminal tail will limit nucleosomes packing, and thus, turn chromatin loose and open for transcription [5, 6]. Such rearrangement of chromatin has been found to be the reason of numerous diseases, including the maintenance of drug addiction [7], type 2 diabetes [8], stem cell aging [9], several heart diseases [10], liver health [11] and neuronal tissues regeneration [12]. Meanwhile, such epigenetic modifications have been proposed as early biomarkers for potential diagnosis of lung cancer [13, 14]. Therefore, how to quantitatively characterize such tightness within chromatin of live cells is an attractive and important topic in epigenetics. Nowadays, although the morphology of chromatin can be visualized through fluorescence microscope or electronic microscope [15-19], it remains a big challenge to detect micro-environment factors of chromatin at different epigenetic states [20].
Since the tightness of chromosome packing directly affects the mobility/viscosity within chromatin, it is reasonable to use local viscosity as an indicator of the chromatin condensation level [21-24]. The higher viscosity in chromatin, the higher the condensation level is. Then, the key question turns into how to monitor the changes of viscosity of chromatin in live cells. In this context, some attempts on chromatin viscosity measurement have been carried out through applying DNA-binding fluorescent dyes, e.g., Hoechst 33342 and EGFP [25] in combination with various techniques [21-23, 25-29]. From the aspect of viscosity sensor, the reliability and universality are two features for sensing chromatin viscosity [30-32]. Actually, the conventional DNA-binding dyes represented by Hoechst 33342 should not be classified as viscosity sensors, in the strict sense. Although they indeed possess viscosity responsiveness, their fluorescence properties (brightness, wavelength, lifetime and etc.) are also highly dependent on other factors, such as the balance of binding and unbinding with DNA, polarity, pH. It is likely that, under certain conditions, the fluorescence signals of these dyes might not reflect the viscosity specifically.
The aim of this work is to develop a reliable sensor specific toward chromatin viscosity, as a practical tool to assess chromatin condensation state for epigenetic research and diagnosis. Ideally, this molecular sensor should meet two requirements. Firstly, it must have high nucleus DNA targeting ability that helps to avoid background signals from non-chromatin areas. Secondly, it must respond to viscosity sensitively and exclusively, without being interfered by other environmental factors. Therefore, we decide to design an integrated molecule that simultaneously maintains above two individual functions without collision. We adopt a Hoechst ligand as the DNA-binding moiety because of its high affinity [33-40]. But instead of using this Hoechst moiety for viscosity sensing, we introduce a BODIPY-based molecular rotor as the viscosity reporter. The advantage of BODIPY rotor over other common viscosity-sensitive dyes lies in that its fluorescence properties are sensitive only to viscosity, without any influence by pH and polarity [30-32, 41-45]. The intramolecular FRET from Hoechst to BODIPY will provide a method of ratiometric imaging for quantitatively indicating of viscosity changes of chromatin. More importantly, the fluorescence lifetime of BODIPY can accurately quantify the local viscosity by FLIM imaging.
Herein, a molecular sensor, named as Chroma-V, is synthesized by conjugating the Hoechst ligand (Hoe) and BODIPY rotor (BDP) through a "click reaction" (Fig. 1 and Scheme S1 in Supporting information). Hoe functions as a targeting ligand and fluorescent marker of DNA. BDP functions as a reporter of chromatin condensation state. Meanwhile, according to our former study on FRET system [46], we infer that this fluorophore dyad should have high intramolecular energy transfer efficiency (ETE) due to a good match of the emission of Hoe and the absorption of BDP. Therefore, Chroma-V may be recommendable for the two-channel ratiometric fluorescence imaging of nucleus DNA through a single excitation. In low-viscosity environment, the BODIPY rotor shows low fluorescence and short fluorescence lifetime due to the free rotation of phenyl group in the excitation state; whereas in high-viscosity, the rotor shows high fluorescence and long fluorescence lifetime due to the restriction of rotation. In eukaryotic nucleus, DNA wraps around histones to form nucleosome as the first subunit of chromatin [5], which means the Hoechst ligand actually locates on nucleosomes, specifically on the A-T rich small groove of the 70% accessible surface of nucleosomal DNA [47]. Therefore, as chromatin condensation state changes, the level of restriction on the rotation in BDP by nucleosomes packing changes accordingly. Taking into account the above considerations, we expect that Chroma-V is capable of indicating the chromatin condensation state in two ways: the fluorescence ratio between BDP and Hoe and the fluorescence lifetime of BDP.

|
Download:
|
| Fig. 1. (a) The structure of Chroma-V. (b) When binding to loose chromatin, Hoe shows intense fluorescence, while BDP shows weak fluorescence and short fluorescence lifetime; when binding to tight chromatin, both Hoe and BDP shows intense fluorescence, and BDP shows longer fluorescence lifetime. | |
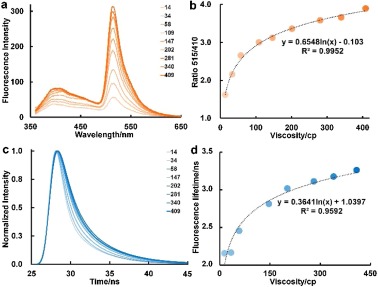
In order to assess the sensitivity of Chroma-V towards restriction factors on the rotation of BDP, we first studied its photo-physical properties in solution. Classic viscosity system, water/glycerol, is used to imitate local restriction on BDP. We first treated the DNA with 2 μmol/L of Chroma-V for 60 min in mixtures of water and glycerol with gradient increase of the glycerol proportion. Details can be found in Supporting information. Chroma-V displays two emission peaks upon single excitation at 350 nm. As the restriction (glycerol proportion) increased, the fluorescence maximum of Hoe displays small extent of increase, while the fluorescence maximum of BDP displays significant increase (logarithmic trend). Thus the ratio between two fluorescence maximum (R515/410) exhibits logarithmic increase against viscosity (Figs. 2a and b), which can be used as the standard curve for measuring viscosity in a same testing condition. As we infer, this fluorophore dyad shows ETE ranging from 94% to 97% against the viscosity from 14 cp to 409 cp, respectively, which demonstrates a weak dependency of ETE on viscosity. This result is in favor of ratiometric imaging of viscosity with single excitation wavelength. On the other hand, the fluorescence lifetime of BDP moiety also exhibits logarithmic increase against viscosity (Figs. 2c and d, Table S1 in Supporting information), which can be used as universal standard curve for quantifying viscosity. These trends are in accordance with former reports on BODIPY rotor [30, 41, 45]. Therefore, both the fluorescence ratio (R515/410) and the fluorescence lifetime can indicate the viscosity of microenvironment, as both of them are independent of concentration of probe. Compared to fluorescence ratio, fluorescence lifetime is an absolute quantitative way to reflect environment factors, which is independent of the devices used to measure it. Therefore, we use fluorescence lifetime for quantitative study of viscosity and use fluorescence ratio for qualitative study of viscosity. In addition, BDP part in Chroma-V is not sensitive to environmental polarity according to fluorescence spectra study (Fig. S1 in Supporting information) and literatures [30, 32]. These results show that Chroma-V is sensitive towards environmental viscosity or restriction factors on the rotation, which can be used for sensing of chromatin condensation state.

|
Download:
|
| Fig. 2. (a) Changes of fluorescence spectra, and (b) fluorescence ratio (R515/410) of Chroma-V with gradient increase of viscosity; (c and d) changes of fluorescence lifetime of Chroma-V with gradient increase of viscosity. | |
We then tested if Chroma-V could target nucleus DNA and report condensation level of chromatin in living cells. We first stained HeLa, MCF7, A549 and HUVEC cells with Chroma-V and then imaged on confocal fluorescence microscope. Chroma-V shows high DNA-specific localization in all these cell lines (Fig. 3 and Fig. S2 in Supporting information). As shown in Fig. 3, Chroma-V is able to target nucleus DNA in living cells at different stages of cell cycle, which indicates targeting ability is not affected by chromatin state. Specifically, cells in Figs. 3c–f should be in prophase, metaphase, metaphase and anaphase, respectively, according to the shape of chromatin. We further incubated stained HeLa cells with Chroma-V for additional 24 h or 48 h. Fluorescence images (Figs. S4 and S5 in Supporting information) displays clear nucleus DNA at different stages of cell cycle at both time points, which demonstrates the ability of Chroma-V to track nucleus DNA for at least 48 h (up to three cell cycles). Moreover, Chroma-V also targets nucleus DNA even in apoptosis cells (Figs. 4d and e), which will be described in detail later. MTT test shows 87% cells viability and cells maintain normal cell cycles 48 h post staining, both of which indicate low toxicity of Chroma-V (Fig. S3 in Supporting information). These results prove that Chroma-V could target nucleus DNA specifically and stably.

|
Download:
|
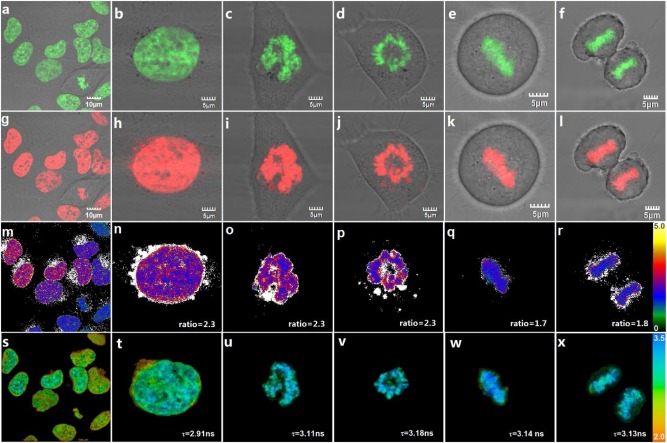
| Fig. 3. HeLa cells at different stages of cell cycle stained with Chroma-V. Confocal fluorescence images excited at 405 nm: (a–f) Hoe channel (420–490 nm), (g–l) BDP channel (510–560 nm) and (m–r) fluorescence ratio images (RBDP/Hoe). And (s–x) fluorescence lifetime images, excited with 800 nm two-photon femtosecond laser and imaged through BDP channel (511–599 nm). | |

|
Download:
|
| Fig. 4. Histones or DNA modifications studies with Chroma-V: (a–e) Fluorescence ratio images (RBDP/Hoe) and (g–k) fluorescence lifetime images of HeLa cells treated with (a and g) none, (b and h) TSA, (c and i) VA, (d and j) Etoposide and (e and k) Cisplatin; (f) average fluorescence ratio in a-e; (l) average fluorescence lifetime in g-k. (**, 0.001 < P < 0.01; ***, P < 0.001;t test, double-tailed). Scale bar = 10 nm. | |
We further collected fluorescence ratio images and fluorescence lifetime images of the same HeLa cells shown in Fig. 3. Due to efficient FRET, single excitation with 405 nm laser generates two emission ranges in the Hoe channel and the BDP channel that further produces the ratio images (RBDP/Hoe). As shown in Figs. 3m–r and s–x, cells show fluorescence ratios ranging from 1.7 to 2.3 and fluorescence lifetime ranging from 2.9 ns to 3.2 ns (170–360 cp) under standard culture condition. When chromatin condensed into chromosome (M phase), as shown in Figs. 3o–r and u–x, cells show fluorescence ratio ranging from 1.7 to 2.3 and fluorescence lifetime close to 3.2 ns (~360 cp). Representative fluorescence lifetime fitting decays and distribution histograms are shown in Fig. S6 (Supporting information). According to photophysical properties, Chroma-V displays high fluorescence intensity in BDP channel and long fluorescence lifetime against high viscosity. During mitosis, chromatins are highly condensed, and supposed to perform strong restriction on BDP rotor. As shown in Figs. 3m and s, both fluorescence ratio and lifetime images show slight cell-to-cell variations, probably due to differences in chromatin condensation state at different stage of cell cycles. In addition, there are also intranuclear variation, probably due to the distribution of heterochromatin and euchromatin in cells. Thus, we ascribe the differences in fluorescence ratio (RBDP/Hoe) and fluorescence lifetime to the differences of packing affinity between nucleosomes. Although, fluorescence ratio imaging provides opportunity for quantitative detection, the ratio highly depends on the device that generates the data. Unless the standard curve of detected factor against the ratio value is determined with the same device keeping the identical parameters, it is not usable for quantitative calibration. Meanwhile, other processes, such as PET, could affect/interfere fluorescence signal. As shown in Fig. 3, the ratio in Figs. 3q and r is slightly smaller than that in Figs. 3o and p. We infer that PET process from Hoe to BDP in highly compacted chromatin affects the fluorescence intensity of BDP, which further affects the ratio. By contrast, FLIM imaging is a quantitative detection method independent of devices, because fluorescence lifetime is a molecular property generally independent of fluorophore concentration, laser intensity, instrument parameters, or photobleaching [48]. Therefore, in this paper, we utilize FLIM imaging for quantitative detection of condensation level of chromatin, while use ratiometric imaging for visual observation and complementary evaluation.
We finally applied Chroma-V to monitor changes of chromatin condensation state in living cells during epigenetic modifications under various stimulations. In epigenetics, modifications of histones or DNA will affect packing affinity between nucleosomes due to alteration of electrostatic attraction or steric hindrance. To regulate histones modifications, HeLa cells were treated with two histone deacetylase inhibitors (TSA and valproic acid (VA)); also, to interrupt DNA functions without sequence alternation, HeLa cells are incubated with two clinical antitumor drugs (Cisplatin and Etoposide). These drug-stimulated cells were stained with Chroma-V, and were evaluated through fluorescence ratio imaging and fluorescence lifetime imaging. As shown in Figs. 4a–f, Hela cells treated with TSA, VA, Cisplatin (CP), and Etoposide (ET), all show lower fluorescence ratio than the untreated ones, which indicates a decrease of condensation level of chromatin. Accordingly, cells show shorter fluorescence lifetime than untreated cells (Figs. 4g–l). These lifetimes can correspond the condensation level of chromatin to viscosity quantitatively. As histone deacetylase inhibitors, TSA and VA selectively inhibit histone deacetylase (HDAC) to interfering with the removal of acetyl groups from N-terminal tail of H2B histone, which will reduce the net positive charge of N-terminal tail of H2B histone and further inhibit the side-by-side packing between two nucleosomes [4, 5]. Thus, compared the long fluorescence lifetime of 3.2 ns (and corresponding higher chromatin viscosity of ~360 cp), the drug-stimulated cells display much shorter fluorescence lifetime of 2.25 ± 0.03 ns (low viscosity of ~27 cp) and 2.39 ± 0.04 ns (low viscosity of ~43 cp) for TSA and VA groups respectively. For etoposide, it generally inhibits DNA topoisomerase by complexed with enzyme and DNA. In Etoposide group, Chroma-V indicates a decrease of condensation level of chromatin as the fluorescence lifetime decreases to 2.33 ± 0.05 ns (low viscosity of ~32 cp) post treatment by Etoposide. We infer that the formation of Etoposide-enzyme-DNA complex would interfere the formation of nucleosomes or the interaction between nucleosomes due to steric hindrance. As for Cisplatin group, treated cells also exhibit shorter fluorescence lifetime of 2.37 ± 0.08 ns (low viscosity of ~41 cp), which indicates low condensation level of chromatin. Similar with Etoposide, cisplatin can bind to nucleophilic groups in DNA, inducing intrastrand and interstrand DNA cross-links at GC-rich sites. These site-specific cross-links will set steric hindrance against the formation of nucleosomes, which will decrease the viscosity. Representative fluorescence lifetime fitting decays and distribution histograms are shown in Fig. S7 (Supporting information). The above results demonstrate that Chroma-V can quantify condensation level of chromatin through fluorescence lifetime imaging, and indicate the effect of these drugs on chromatin in living cells.
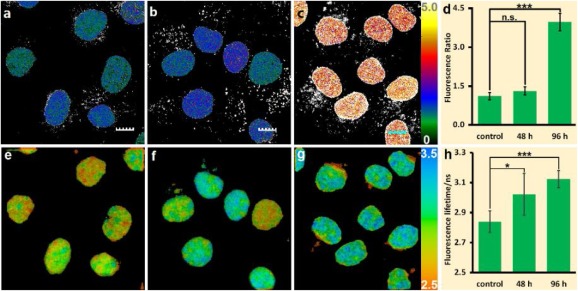
Besides histones or DNA modifications, cell transitions as another important type of epigenetic processes should also generate or accompany the variation of chromatin condensation state. To further confirm the applicability of Chroma-V, it is applied in the study of epithelial-mesenchymal transition (EMT) of HUVEC cells stimulated with TGF-β (transforming growth factor-β) [49]. As an extracellular signal TGF-β will active one conserved class of transcription factors, called "the Smads" that affect gene expression and further induce long-term changes in cell function. As shown in Fig. 5, cells treated with TGF-β for 48 h and 94 h show higher fluorescence ratio of 1.31 ± 0.16 and 3.98 ± 0.34 respectively than control group of 1.11 ± 0.14, which indicates an increase of condensation level of chromatin. Correspondingly, cells show significant increase in fluorescence lifetime from 2.84 ± 0.07 ns (control group) to 3.02 ± 0.14 ns (48 h group) and 3.12 ± 0.06 ns (96 h group), which means an increase in chromatin viscosity from 150 cp to 240 cp and 300 cp. Representative fluorescence lifetime fitting decays and distribution histograms are shown in Fig. S8 (Supporting information). As former studies revealed that chromatin underwent significant remodeling in EMT, which is a multi-regulation, including DNA methylation, histone acetylation and histone methylation [50]. According to our results, the EMT results in higher degree of chromatin condensation, which, to our knowledge, has not been demonstrated through fluorescence imaging previously. The results further demonstrate that TGF-β induces a molecular pathway that turned chromatin from "loose" conformation into "tight" conformation as the cell transition proceeds. The above results demonstrate that Chroma-V is a potential sensor to report condensation level of chromatin during epigenetic transformation.

|
Download:
|
| Fig. 5. Epithelial-mesenchymal transition study with Chroma-V: (a–c) Fluorescence ratio images (RBDP/Hoe) and (e–g) fluorescence lifetime images of HUVES cells treated with (a and e) none, (b an f) TGF-β for 48 h and (c and g) 96 h; (d) average fluorescence ratio in a–c; (h) average fluorescence lifetime in e–g. (n.s., P > 0.05; *, P < 0.05; ***, P < 0.001;t test, double-tailed). Scale bar = 10 nm. | |
In summary, we aim to develop a method for quantitative evaluation of chromatin condensation level in epigenetic processes of living cells. Our idea is to utilize the local viscosity as the indicator of chromatin condensation state. To realize this idea, we design a DNA targetable viscosity fluorescent probe, Chroma-V, by conjugating a Hoechst ligand to a BODIPY rotor. The Hoe part enables the chromatin targeting by binding to DNA. The sensitivity of BDP's fluorescence lifetime to viscosity enables the accurate quantification of chromatin condensation state through fluorescence lifetime imaging. Also importantly, the intramolecular FRET from Hoe to BDP part facilitates the single-excitation two-channel ratiometric imaging of nucleus DNA and quantitatively sensing of chromatin condensation state. Firstly, fluorescence imaging test shows that Chroma-V is able to target nucleus DNA of diverse cell lines specifically and exhibit morphology changes of chromatin in different stages of cell cycle. Further, fluorescence lifetime imaging displays the changes of chromatin condensation state during epigenetics changes of HeLa cells by drugs stimulation, including histone acetylation induced by HDAC inhibitors, cell apoptosis induced by chemotherapy drugs. Lastly, we induced epithelial-mesenchymal transition of HUVEC by stimulating with TGF-β. By using Chroma-V, we, for the first time, quantitatively monitor an increase of condensation level of chromatin during this type of cell transitions through fluorescence lifetime imaging, which may indicate a decrease of gene activity in the resulting cells.
Declaration of competing interestThe authors declare that they have no known competing financial interests or personal relationships that could have appeared to influence the work reported in this paper.
AcknowledgmentsThis work was supported by the National Natural Science Foundation of China (Nos. 21421005, 21576040, 21776037, 21901031 and 22078047), Science and Technology Foundation of Liaoning Province (No. 2020-YQ-08), Dalian Science and Technology Innovation Fund (No. 2020JJ25CY014) and the Fundamental Research Funds for the Central Universities (Nos. DUT18RC(3)027 and DUT20RC(5)024).
Appendix A. Supplementary dataSupplementarymaterial related to this article can befound, in the online version, at doi: https://doi.org/10.1016/j.cclet.2021.02.031.
| [1] |
R. Feil, M.F. Fraga, Nat. Rev. Genet. 13 (2012) 97-109. DOI:10.1038/nrg3142 |
| [2] |
A.P. Wolffe, M.A. Matzke, Science 286 (1999) 481-486. DOI:10.1126/science.286.5439.481 |
| [3] |
B.D. Strahl, C.D. Allis, Nature 403 (2000) 41-45. DOI:10.1038/47412 |
| [4] |
B.M. Turner, BioEssays 22 (2000) 836-845. DOI:10.1002/1521-1878(200009)22:9<836::AID-BIES9>3.0.CO;2-X |
| [5] |
X. Wang, J.J. Hayes, Mol. Cell Biol. 28 (2008) 227-236. DOI:10.1128/MCB.01245-07 |
| [6] |
D.Y. Lee, J.J. Hayes, D. Pruss, A.P. Wolffe, Cell 72 (1993) 73-84. DOI:10.1016/0092-8674(93)90051-Q |
| [7] |
P.J. Hamilton, E.J. Nestler, Curr. Opin. Neurobiol. 59 (2019) 128-136. DOI:10.1016/j.conb.2019.05.005 |
| [8] |
S. Dhawan, R. Natarajan, Curr. Diabetes Rep. 19 (2019) 47. DOI:10.1007/s11892-019-1168-8 |
| [9] |
D. Chen, C. Kerr, Trends Cell Biol. 29 (2019) 563-568. DOI:10.1016/j.tcb.2019.03.006 |
| [10] |
K.D. Jarrell, L.M. Lennon, G.J. Jacot, Diseases 7 (2019) 52. DOI:10.3390/diseases7030052 |
| [11] |
T.B. Toh, J.J. Lim, E.K.H. Chow, Clin. Transl. Med. 8 (2019) 13. |
| [12] |
L.S. VandenBosch, T.A. Reh, Semin. Cell Dev. Biol. 97 (2020) 63-73. DOI:10.1016/j.semcdb.2019.04.001 |
| [13] |
S.A. Belinsky, K.J. Nikula, S.B. Baylin, J.P. Issa, Proc. Natl. Acad. Sci. U. S. A. 93 (1996) 4045. DOI:10.1073/pnas.93.9.4045 |
| [14] |
S.L. Liu, Y. Han, Y. Zhang, et al., Target. Oncol. 7 (2012) 135-143. DOI:10.1007/s11523-012-0215-z |
| [15] |
K. Prakash, D. Fournier, S. Redl, et al., Proc. Natl. Acad. Sci. U. S. A. 112 (2015) 14635-14640. DOI:10.1073/pnas.1516928112 |
| [16] |
M.A. Ricci, C. Manzo, M.F. García-Parajo, M. Lakadamyali, M.P. Cosma, Cell 160 (2015) 1145-1158. DOI:10.1016/j.cell.2015.01.054 |
| [17] |
J. Xu, H. Ma, J. Jin, et al., Cell Rep. 24 (2018) 873-882. DOI:10.1016/j.celrep.2018.06.085 |
| [18] |
M. Figueroa, J. Vandenameele, E. Goormaghtigh, et al., Data in Brief 8 (2016) 1221-1226. DOI:10.1016/j.dib.2016.07.036 |
| [19] |
J.R. Daban, Micron 42 (2011) 733-750. DOI:10.1016/j.micron.2011.05.002 |
| [20] |
R. Cortini, M. Barbi, B.R. Caré, et al., Rev. Mod. Phys. 88 (2016) 025002. DOI:10.1103/RevModPhys.88.025002 |
| [21] |
S. Pelicci, A. Diaspro, L. Lanzanò, J. Biophotonics 12 (2019) e201900164. |
| [22] |
E. Abdollahi, G. Taucher-Scholz, B. Jakob, Int. J. Mol. Sci. 19 (2018) 2399. DOI:10.3390/ijms19082399 |
| [23] |
S.T. Spagnol, K.N. Dahl, PLoS One 11 (2016) e0146244. DOI:10.1371/journal.pone.0146244 |
| [24] |
A. Colom, E. Derivery, S. Soleimanpour, et al., Nat. Chem. 10 (2018) 1118-1125. DOI:10.1038/s41557-018-0127-3 |
| [25] |
N. Audugé, S. Padilla-Parra, M. Tramier, N. Borghi, M. Coppey-Moisan, Nucleic Acids Res. 47 (2019) 6184-6194. DOI:10.1093/nar/gkz373 |
| [26] |
H. Xiong, L. He, Y. Zhang, et al., Chin. Chem. Lett. 30 (2019) 1075-1077. DOI:10.1016/j.cclet.2019.02.008 |
| [27] |
S. Long, Q. Qiao, L. Miao, Z. Xu, Chin. Chem. Lett. 30 (2019) 573-576. DOI:10.1016/j.cclet.2018.11.031 |
| [28] |
M. Di Bona, M.A. Mancini, D. Mazza, et al., Biophys. J. 116 (2019) 987-999. DOI:10.1016/j.bpj.2019.02.003 |
| [29] |
H. Sparks, H. Kondo, S. Hooper, et al., Nat. Commun. 9 (2018) 2662. DOI:10.1038/s41467-018-04820-6 |
| [30] |
L. Wang, Y. Xiao, W. Tian, L. Deng, J. Am. Chem. Soc. 135 (2013) 2903-2906. DOI:10.1021/ja311688g |
| [31] |
Z. Yang, Y. He, J.H. Lee, et al., J. Am. Chem. Soc. 135 (2013) 9181-9185. DOI:10.1021/ja403851p |
| [32] |
M.K. Kuimova, G. Yahioglu, J.A. Levitt, K. Suhling, J. Am. Chem. Soc. 130 (2008) 6672-6673. DOI:10.1021/ja800570d |
| [33] |
A. Nakamura, K. Takigawa, Y. Kurishita, et al., Chem. Commun. 50 (2014) 6149-6152. DOI:10.1039/C4CC01753F |
| [34] |
Y. Yasueda, T. Tamura, I. Hamachi, Chem. Lett. 45 (2015) 265-267. |
| [35] |
F. Yang, C. Wang, L. Wang, et al., Chin. Chem. Lett. 28 (2017) 2019-2022. |
| [36] |
A. Nakamura, S. Tsukiji, Bioorg. Med. Chem. Lett. 27 (2017) 3127-3130. DOI:10.1016/j.bmcl.2017.05.036 |
| [37] |
D. Hara, Y. Umehara, A. Son, et al., ChemBioChem 19 (2018) 956-962. DOI:10.1002/cbic.201700685 |
| [38] |
X. Zhang, Z. Ye, X. Zhang, et al., Chem. Commun. 55 (2019) 1951-1954. DOI:10.1039/c8cc08575g |
| [39] |
C.K. Spahn, M. Glaesmann, J.B. Grimm, et al., Sci. Rep. 8 (2018) 14768. DOI:10.1038/s41598-018-33052-3 |
| [40] |
G. Lukinavičius, C. Blaukopf, E. Pershagen, et al., Nat. Commun. 6 (2015) 8497. DOI:10.1038/ncomms9497 |
| [41] |
Y. He, J. Shin, W. Gong, et al., Chem. Commun. 55 (2019) 2453-2456. DOI:10.1039/c9cc00300b |
| [42] |
X. Song, N. Li, C. Wang, Y. Xiao, J. Mater. Chem. B 5 (2017) 360-368. DOI:10.1039/C6TB02524B |
| [43] |
C. Wang, X. Song, L. Chen, Y. Xiao, Biosens. Bioelectron. 91 (2017) 313-320. DOI:10.1016/j.bios.2016.11.018 |
| [44] |
H. Lee, Z. Yang, Y. Wi, et al., Bioconjug. Chem. 26 (2015) 2474-2480. DOI:10.1021/acs.bioconjchem.5b00508 |
| [45] |
J.E. Chambers, M. Kubánková, R.G. Huber, et al., ACS Nano 12 (2018) 4398-4407. DOI:10.1021/acsnano.8b00177 |
| [46] |
X. Zhang, Y. Xiao, X. Qian, Org. Lett. 10 (2008) 29-32. DOI:10.1021/ol702381j |
| [47] |
K.J. Embrey, M.S. Searle, D.J. Craik, Eur. J. Biochem. 211 (1993) 437-447. DOI:10.1111/j.1432-1033.1993.tb17569.x |
| [48] |
K. Suhling, P.M.W. French, D. Phillips, Photochem. Photobiol. Sci. 4 (2005) 13-22. DOI:10.1039/b412924p |
| [49] |
Y. Tsubakihara, A. Moustakas, Int. J. Mol. Sci. 19 (2018) 3672. DOI:10.3390/ijms19113672 |
| [50] |
L. Sun, J. Fang, Cell. Mol. Life Sci. 73 (2016) 4493-4515. DOI:10.1007/s00018-016-2303-1 |