 2021, Vol. 32


b School of Pharmacy, Key Laboratory of Molecular Pharmacology and Drug Evaluation (Yantai University), Ministry of Education, Collaborative Innovation Center of Advanced Drug Delivery System and Biotech Drugs in Universities of Shandong, Yantai University, Yantai 264005, China;
c Department of Food Quality and Safety, College of Food Science and Engineering/Collaborative Innovation Center for Modern Grain Circulation and Safety/Key Laboratory of Grains and Oils Quality Control and Processing, Nanjing University of Finance and Economics, Nanjing 210023, China
The lipid droplets (LDs) are ubiquitous, endoplasmic reticulum derived and dynamic organelles that function as cellular centre of lipid metabolism [1]. They are composed of a neutral lipids core, mainly contains cholesterol esters and triglycerides, coated with a phospholipid monolayer membrane in which proteins are anchored [2]. LDs regulate various cell activities, including lipid signaling pathway, membrane biosynthesis, acting as dynamic lipid storage depots to provide the energy by rapid mobilization of fatty acids, sequestering toxic lipids [3]. Notably, excess of LDs has been implicated in the pathogenesis of numerous diseases, especially in atherosclerosis related cardiovascular diseases [4].
Accumulation of atherosclerotic plaques in arterial walls leads to major cardiovascular diseases and stroke [5]. The foam cells derived from macrophages are the central components of atherosclerotic plaques, which invade the arterial wall in order to remove adverse modified low‑density lipoprotein (LDL) particles, resulting in the accumulation of lipids in cytosolic LDs [6]. Foam cells are considered as a biomarker participate in all pathological development stages of atherosclerotic lesions, and characterized by an aberrant accumulation of cytosolic LDs [7]. Therefore, it may be an effective strategy to visualize atherosclerotic plaques by designing fluorescent probe to image LDs in foam cells.
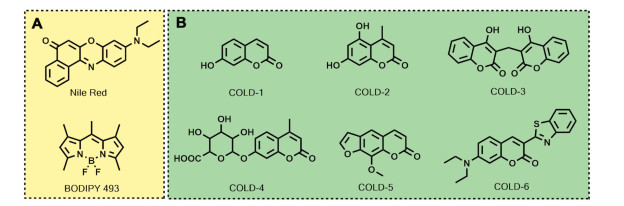
As an important technique in modern scientific research, fluorescence imaging enables living cells and whole organisms to be visualized and has significantly promoted advances in biology and medicine [8-11]. Recently, a variety of fluorophore have been exploited todesign fluorogenic probes for imaging LDs according to the solvatochromism, such as BODIPY [12-14], AIEgen [15, 16], and more probes were summarized in the review [17]. Although there are many LDs probes be reported so far, the commercially available probes still rare. The Nile-Red and BODIPY are the most commonly used commercial probes to indicate LDs (Scheme 1A). But BODIPY is not suitable for the visualization imaging of tissues due to narrow stokes shift, and Nile-Red cannot be used for multicolor imaging due to wide excitation band. Therefore, a commercially available LDs-specific probe still needs to be developed for the visualization of LDs-involved pathological process such as lipophagy and atherosclerosis. In addition, the naked eye recognition of pathological tissue requires a visible fluorescent probe with shorter excitation wavelength at near-UV region to avoid the interference of excited light on human-eye resolution. Furthermore, the larger Stokes shift can avoid the interference from biological background. Coumarin is a kind of classical fluorescent dyes, which has the characteristics of low biological toxicity, large stokes shift and intramolecular charge transfer (ICT) effect [18, 19]. Inspired by this, we focused on the exploration of structural factors affect the solvatochromism of coumarins to establish a new design strategy, and then develop suitable fluorogenic probe for the visualization of LDs-associated behavior and LDs-rich tissue in atherosclerotic plaque (Scheme 1B).

|
Download:
|
| Scheme 1. (A) The classic LDs-targeted probes Nile Red and BODIPY 493. (B) The potential LDs-targeted probes developed in this study. | |
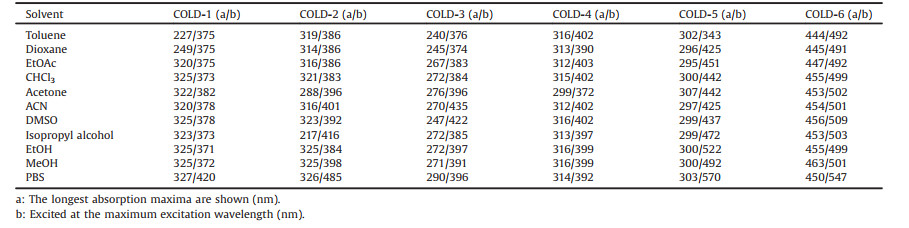
At present, most of the LDs-specific fluorescent probes are designed according to the solvatochromism effect. Therefore, we investigated the solvatochromism effect of coumarin fluorophores. We considered different water solubility and electron cloud density of the structure when selected the candidate coumarin derivatives. The corresponding optical properties in different solvents were summarized in Table 1 and Table S2 (Supporting information), and the corresponding spectrums were showed at Figs. S1 and S2 (Supporting information). It can be seen that the solvents with different polarity have little effect on the maximum absorption wavelength of most coumarin derived lipid droplets probes (COLDs) which contain COLD-1, -2, -5 and -6, but the enhanced polarity lead to significant red shift of the maximum emission wavelength. This transformation markedly extends the Stokes shift of the compounds from organic solvents to water. The compound COLD-4 was no observed similar solvatochromism effect may due to the poor electron-donating capacity of 7-glucuronide. The COLD-2 possesses more electron donor compare with COLD-1, which indicated that the solvatochromism effect of coumarin can be enhanced by modifying electron donor on the conjugate system. Therefore, we can infer that lower water solubility and more electron donor are advantageous to the solvatochromism of coumarins. In addition, a gradual process of solvatochromism of the coumarins is observed by THF/water solvent system from 1% to 99% (Figs. S3 and S4 in Supporting information). In addition, the result showed that the COLD dyes are not AIE (Figs. S5 and S6 in Supporting information). So we can infer that this solvatochromism of the dyes may be caused by other reasons. The theoretical calculation of the dyes was conducted by density functional theory (DFT). As Figs. S7 and S8 (Supporting information) showed, the electron cloud in the coumarin dyes transfer from donor to conjugated core, which was especially obvious in the case of COLD-5 and COLD-6. Furthermore, to gain insight into the solvatochromism of the dyes, we carried out time-dependent density functionaltheory (TD-DFT) calculations of COLD-4, COLD-5 and COLD-6 at DCM and water solvent respectively. The results were similar to that observed in actual experiments (Figs. S9-S11 in Supporting information).
|
|
Table 1 Structure and solvatochromism of coumarins. |
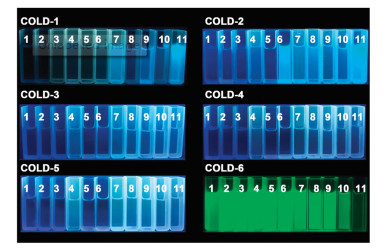
To explore the visual performance of fluorescence from COLDs, a 365 nm UV laser is used to excite coumarin molecules in different polar solvents. As shown in Fig. 1, COLD-6 shows a gratifying property, which emerged intensive green fluorescence in all organic solvents while no visible fluorescence in the water solvent. It indicated that COLD-6 can efficiently distinguish organic phase from water phase by the naked-eye observation. Furthermore, COLD-6 emit strong visible green light in oil and almost no light in water (Fig. S12 in Supporting information), but COLD-1 and COLD-2 show the opposite characteristics (Fig. S13 in Supporting information). This means that COLD-6 may distinguish LDs from other cellular components or adipose tissue from other tissues.

|
Download:
|
| Fig. 1. Photograph of coumarins (100 μmol/L) in various solvents under UV lamp (365 nm): Toluene, dioxane, EtOAc, CHCl3, acetone, ACN, DMSO, isopropyl alcohol, EtOH, MeOH, and PBS (1-11). | |
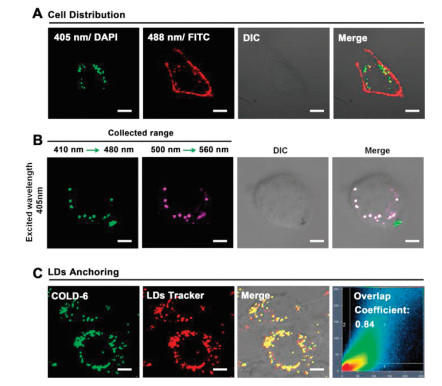
The biological imaging performance of COLD-6 was further tested. The results showed that COLD-6 no have biological toxicity even at 100 μmol/L (Fig. S14 in Supporting information). In addition, the fluorescence intensity increases gradually until 2 h, therefore we select 2 h as the optimal staining time of cells in vitro (Fig. S15 in Supporting information). The maximum absorption wavelength of COLD-6 is near 450 nm, but the available excitation channels of fluorescence microscope are 405 nm (DAPI) and 488 nm (FITC). Therefore, the applicability of these two channels on COLD-6 imaging in cells was discussed. As the Fig. 2A showed, the fluorescence of COLD-6 granulated in A549 cells under DAPI channel while distributed near the cell membrane under FITC channel. Furthermore, the fluorescence emission of COLD-6 was collected in 410−480 nm (green) and 500−560 nm (purple) under the excitation wavelength of 405 nm. As a result, the fluorescence of different collection scope overlap in white in A549 cells, but the green channel displayed some interferences that do not overlap with the purple channel may due to the potential interference from biological short-wavelength emission (Fig. 2B). Thus, the tested parameter of COLD-6 at fluorescence microscope can be determined as: λex=405 nm, λem=500−560 nm. To verify the LDs targeting ability of COLD-6, the A549 cells were incubated with COLD-6 (green channel) and LDs-Red (Nile-Red, red channel) simultaneously. The green particles were all located in the red area (Fig. 2C). This indicated that COLD-6 has sensitivity and selectivity to LDs.

|
Download:
|
| Fig. 2. The A549 cells were treated with COLD-6 (1 μmol/L), and (A) the fluorescence images were obtained under 405 nm/DAPI and 488 nm/FITC channel; (B) the fluorescence images were obtained under the receiving range of 410-480 nm and 500-560 nm, λex=405 nm. (C) The A549 cells were treated with COLD-6 (1 μmol/L) and LDs-tracker (Nile-Red, 1 μmol/L), the fluorescence images were obtained, green: λex=405 nm and λem=500-550 nm, red: λex=555 nm and λem=560-620 nm. Scale bar=10 μm. | |
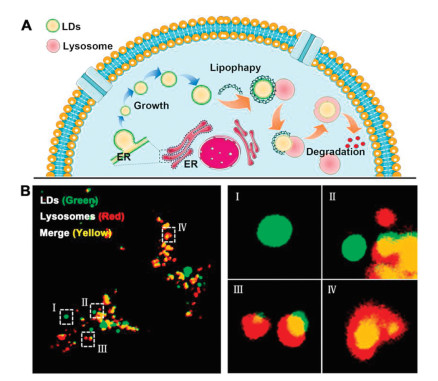
To assess the performance of COLD-6 on monitoring behavior of LDs in cells, a model of starvation-induced autophagy was established to observe the process of lipophagy of LDs (Fig. 3A). If LDs and lysosomes are fused in treated cells, more distinguishable yellow fluorescence arising from co-localization of lysosomes (green) and LDs (red) will be observed. The situation of cells starved for 0, 1, 2, 5 h were performed to observe the whole autophagy process (Fig. S16 in Supporting information). Because lipophagy is a gradual process, thus the distribution of LDs and lysosomes in one cell may show three different states, exist alone (Ⅰ, Ⅱ), gradually fuse (Ⅲ) and completely devour (Ⅳ), during starvation. Which were represented by the results showed at Fig. 3B. This indicates COLD-6 can track the movement of LDs with excellent resolution and selectivity.

|
Download:
|
| Fig. 3. (A) The scheme of growth, lipophagy process of the LDs in live cells. (B) The A549 cells starved 2 h and then treated with COLD-6 (1 μmol/L) and Lyso-tracker (1 μmol/L), the fluorescence images were obtained, green: λex=405 nm and λem=500-550 nm, red: λex=555 nm and λem=560-620 nm. | |
In the atherosclerosis plaque, the infiltrative macrophages are continuously stimulated by ox-LDL and then transforming into LDs-enriched foam cells which are the central component of the plaque (Fig. 4A). Therefore, we sequentially explored the capacity of COLD-6 in visualization of LDs in macrophages after stimulating by ox-LDL. As Fig. 4B and Fig. S17A (Supporting information) showed, 2 μg/mL of ox-LDL can lead to the maximum accumulation of LDs macrophage (Raw264.7). Moreover, the fluorescent intensity of COLD-6 increasing 10.5-fold in Raw264.7 after ox-LDL stimulating 48 h (Fig. 4C and Fig. S17B in Supporting information). However, the growth of LDs in endothelial cells HUVEC was not obvious after ox-LDL stimulating (Figs. S18 and S19 in Supporting information). This indicated that ox-LDL mainly affects macrophage rather than endothelium at atheromatous vascular wall, which can be significantly visualized by COLD-6.

|
Download:
|
| Fig. 4. (A) ox-LDL induces macrophages to transform into LDs enriched foam cells in atherosclerotic plaque. (B) The Raw264.7 cells pre-treated with ox-LDL (0, 1, 2 μg/mL) 48 h and then treated with COLD-6 (10 μmol/L), the fluorescence images were obtained. (C) The Raw264.7 cells pre-treated with ox-LDL (2 μg/mL) 0, 24 and 48 h and then treated with COLD-6 (1 μmol/L), the fluorescence images were obtained. | |
Atherosclerotic plaque contains LDs enriched macrophages and extracellular lipids. To simulate the visible spectacle of these two components, the 3D-scan model of macrophage and adipose tissue were prepared respectively. First, COLD-6 exhibited that the dense LDs were crowding in the 3D-scan image of single macrophage with visual impact (Fig. 5A). Next, the adipose tissue emitted bright green fluorescence after staining by COLD-6 ex vivo (Fig. 5B). Importantly, COLD-6 only emitted visible green fluorescence at the site of adipose tissue when the fat-attached kidney was staining by COLD-6 (Fig. 5C). The results indicated that COLD-6 can be a potential probe for visualization of atherosclerosis plaque. The experiment of COLD-6 mediated atherosclerotic plaque visualization and diagnosis needs to be explored by the future research.

|
Download:
|
| Fig. 5. (A) The 3D-scan of LDs in macrophages, the Raw264.7 cells were pre-treated with ox-LDL (2 μg/mL) 48 h and then treated with COLD-6 (1 μmol/L) 2 h, the 3D-scan fluorescent images were obtained by confocal. (B) The abdominal adipose tissue was harvested and then incubated with COLD-6 (10 μmol/L) or PBS 2 h at 37 ℃ ex vivo. The picture was obtained under 365 nm laser. (C) The kidney and affiliated adipose tissue was harvested and then incubated with COLD-6 (10 μmol/L) or PBS 2 h at 37 ℃ ex vivo. The picture was obtained under 365 nm laser. | |
In summary, we discussed the solvatochromism of different coumarin structures to developed high resolution LDs probe which is visible to the naked eye. The solvents with different polarity have little effect on the maximum absorption wavelength of most coumarin, but the enhanced polarity lead to significant red shift of the emission wavelength. This transformation markedly extends the Stokes shift of the compounds from organic solvents to water. Moreover, this solvatochromism can be enhanced by modifying electron donor on the conjugate system and reducing water solubility of coumarins. Therefore, COLD-6 was selected to image LDs, and the tested parameter was determined as: λex=405 nm, λem=500−560 nm. COLD-6 can track the movement of LDs with excellent selectivity under a lipophagy model and atherosclerosis model in vitro. In addition, a hand-held 365 nm laser source was selected to visually imaging COLD-6, which can distinguish normal tissue and adipose tissue even observation with naked eyes. These results indicated that COLD-6 may serveas a potential probe for the visualization of atherosclerosis plaque in clinic, and the applicability still needs to be further explored.
Declaration of competing interestThe authors have declared no conflict of interest.
AcknowledgmentsWe are grateful to the National Natural Science Foundation of China (No. 82001891), the Post-doctoral Innovative Talent Support Program (No. BX20190389), and China Postdoctoral Science Foundation (No. 2019M662009). We thank the Cellular and Molecular Biology Center of China Pharmaceutical University for assistance with confocal microscopy work and we are grateful to Xiao-Nan Ma for her technical help.
Appendix A. Supplementary dataSupplementary material related to this article canbefound, in the online version, at doi:https://doi.org/10.1016/j.cclet.2021.02.059.
| [1] |
A.R. Thiam, M.J. Beller, Cell. Sci. 130 (2017) 315-324. |
| [2] |
M.A. Welte, A.P. Gould, BBA Mol. Cell Biol. Lipids 1862 (2017) 1260-1272. DOI:10.1016/j.bbalip.2017.07.006 |
| [3] |
A.P. Bailey, G. Koster, C. Guillermier, et al., Cell 163 (2015) 340-353. DOI:10.1016/j.cell.2015.09.020 |
| [4] |
S. Xu, X. Zhang, P. Liu, BBA Mol. Basis Dis. 1864 (2018) 1968-1983. DOI:10.1016/j.bbadis.2017.07.019 |
| [5] |
P. Libby, P.M. Ridker, G.K. Hansson, Nature 473 (2011) 317-325. DOI:10.1038/nature10146 |
| [6] |
J.P. Ayyappan, A. Paul, Y. Goo, Mol. Med. Rep. 13 (2016) 4527-4534. DOI:10.3892/mmr.2016.5099 |
| [7] |
E.M. Maguire, S.W.A. Pearce, Q. Xiao, Vasc. Pharmacol. 112 (2019) 54-71. |
| [8] |
Z. Shao, C. Zhang, X. Zhu, et al., Chin. Chem. Lett. 30 (2019) 1001-8417. |
| [9] |
M. Li, Y. Li, X. Wang, et al., Chin. Chem. Lett. 30 (2019) 1682-1688. DOI:10.1016/j.cclet.2019.06.036 |
| [10] |
J. Zheng, Y. Xu, L. Fan, et al., Small 16 (2020) 2002211. DOI:10.1002/smll.202002211 |
| [11] |
N. Liu, P.Z. Chen, J.X. Wang, et al., Chin. Chem. Lett. 30 (2019) 1939-1941. DOI:10.1016/j.cclet.2019.04.058 |
| [12] |
A. Tabero, F. Garciagarrido, A. Prietocastaneda, et al., Chem. Commun. 56 (2020) 940-943. DOI:10.1039/C9CC09397D |
| [13] |
X. Jiang, S. Yue, K. Chen, et al., Chin. Chem. Lett. 30 (2019) 2271-2273. DOI:10.1016/j.cclet.2019.07.027 |
| [14] |
X. Jiang, T. Zhang, C. Sun, et al., Chin. Chem. Lett. 30 (2019) 1055-1058. DOI:10.1016/j.cclet.2019.02.016 |
| [15] |
X. Zhang, L. Yuan, J. Jiang, et al., Anal. Chem. 92 (2020) 3613-3619. DOI:10.1021/acs.analchem.9b04410 |
| [16] |
Q. Wang, Q. Chen, G. Jiang, et al., Chin. Chem. Lett. 30 (2019) 1965-1968. DOI:10.1016/j.cclet.2019.08.037 |
| [17] |
T.K. Fam, A.S. Klymchenko, M. Collot, Materials 11 (2018) 1768. DOI:10.3390/ma11091768 |
| [18] |
Y. Fu, N.S. Finney, RSC Adv. 8 (2018) 29051-29061. |
| [19] |
T. Yoshihara, R. Maruyama, S. Shiozaki, et al., Anal. Chem. 92 (2020) 4996-5003. |