 2021, Vol. 32


b Institutes of Physical Science and Information Technology, Anhui University, Hefei 230601, China;
c Department of Chemistry, Center of Nanotechnology and Tissue Engineering-Photobiology and Photomedicine Research Group, Faculty of Philosophy, Sciences and Letters of Ribeirão Preto, University of São Paulo, Ribeirão Preto, São Paulo 14040-901, Brazil;
d Department of Thoracic Surgery, First Affiliated Hospital of Anhui Medical University, Hefei 230032, China
As a highly fatal disease, the malignant tumor deprives millions of lives of humans each year. Therefore, more and more attention has been directed to early detection and treatment of neoplastic tissue based on theranostics smart materials. In comparison with traditional cancer therapy methods such as surgery, chemotherapy and radiotherapy, photodynamic therapy (PDT) surpasses due to its extremely low systemic toxicity, few side effects, and negligible drug resistance [1]. The cancer cells can be locally killed by reactive oxygen species (ROS), mainly singlet oxygen (1O2) generated by a photosensitizer (PS). Zhu et al. proposed a core-shell semiconducting nanoparticle (SPN-Ms) that can produce sufficient 1O2 to promote PDT effect [2, 3]. However, the problems of instability of structure and low ROS generation are still the challenges that as-reported PS faces, making it quite essential to find a more photostable and efficient PS [4, 5]. Fortunately, with the development of nanoscience, several nanomaterials including carbon dots (CDs), graphene quantum dots (GQDs), metal nanoparticles (NPs), polymeric nanoparticles (PNPs) were explored to work as a PS, thus enabling precise target therapy of tumors and improving the efficacy of PDT [6]. In this regard, a considerable spectrum of PSs such as gold nanoparticles, iron oxide nanoclusters, silica-coated-gold nanoclusters, MoS2 nanosheets, graphene oxide, upconversion NPs, and carbon dots, have demonstrated to improve the efficiency of therapeutic outcome [7].
Recently, metal nanoclusters, such as Mo, Ag and Au, have been an extremely attractive PS of PDT. Martynenko et al. reported a near-infrared-emitting gold quantum cluster capped with lipoic acid (L-AuC with (Au)18(L)14)-based nanoplatform with an excellent tumor reduction property by incorporating a tumor-targeting agent (folic acid) and a PS (protoporphyrin IX), for selective PDT [8-10]. As one of the metal-organic frameworks (MOFs), Fe3O4/ZIF-8-Au25 (IZA) nanospheres can generate 1O2 causing a significant reduction of the tumor cellular viability [11, 12]. It has also been reported that the photoluminescent NPs doped by {Mo6I8}4+ showed the potential for bioimaging and PDT (as a perfect theranostic agent) with a model of human epidermoid larynx carcinoma (Hep-2) cell line [13]. However, the above-mentioned materials still face the challenge of unstable structure, for example, in the fabrication of core-shell Ag@CDs, reducing Ag+ to Ag NPs implies the possibility of depositing the metal atoms on CDs [14]. Besides, those materials are of high toxicity. However, as one of the 14 essential trace elements in the human body, Sn linked to some enzyme can induce the anti-tumor Sn compounds in the thymus that decrease the viability of cancer cells. Sn is supposed to be associated with the obesity problem of human beings; its existence was found in different parts of body of men/women [15]. Sn also promotes the synthesis of proteins and nucleic acids, which is beneficial for the human body [16-18]. For instance, Seidl et al. explored the potential of β-SnWO4 nanoparticles PS for pharmacokinetic experiments [19]. A mesothien-2-yl substituted tin(IV)corrole (1-Sn) and its phenyl analog (2-Sn) were proved to be good candidates for scale-up as a commercial PS compound for PDT [20]. A novel Sn(IV) complex with meso-tetraacenaphthylporphyrin (SnTAcP) combined with methyl-β-cyclodextrin, was evaluated as a potential PDT agent using MCF-7 breast cancer cells [21].
Compared to the classical organic dyes and metal clusters, CDs surpasses as a promising deep-tissue PDT agent with controllable optical properties via chemical functionalization. This new type of carbon-based nanoparticle has gained significant interest due to several attractive features such as widely tunable optical properties, ease of synthesis and rich surface chemistry, resistance against photobleaching as well as excellent biocompatibility [22-25]. Fan et al. mentioned a new PS agent for PDT, a GQDs-based nanocomposite with a high ROS generation property, introducing a new method to design efficient PDT systems for cancer treatment [26]. Several recent studies have evaluated the PDT efficacy of GQDs with both in vitro and in vivo experiments. Yue et al. synthesized the ruthenium-containing CDs (Ru-CDs) under hydrothermal condition, which is useful for PDT, owing to higher water solubility and efficient generation of ROS [27]. However, the size, composition and surface structure determine the physical, chemical and biological properties of monolayer-protected noble metal NPs. Neither Au, Ag nor Mo cluster can exist stably without any ligands. Besides, those mentioned noble metal elements are incredibly harmful to the human body. In the present work, we first report a novel and highly stable type of CDs coated with Sn nanocluster, named Sn nanocluster@CDs, which ensure the sufficient production of 1O2, enhanced fluorescence and improved PDT effect. Both in vitro and in vivo experiments show that the as-synthesized Sn nanocluster@CDs have great potential as a PS aimed to be expansively used in clinical PDT treatment.
As shown in Scheme S1 (Supporting information), sulfur-doped carbon dots (S-CDs) were synthesized and then formed a complex with Sn4+ (Sn4+@S-CDs). Subsequently, Sn nanocluster@CDs were prepared from the Sn4+@S-CDs through a vaporization process. The as-prepared product is likely in a core-shelled structure, in which the CD plays the role of core, and Sn nanoclusters are superposited on the carbon core. The morphology, structure and composition of the Sn nanocluster@CDs were characterized by using an aberration-corrected high-angle annular dark field-STEM (ac-STEM). Fig. 1a shows a typical ac-STEM image of the Sn nanocluster@CDs, in which each white dot inside a red dotted circle represents for every single Sn nanocluster. The blue dotted circle area represents for the carbon (C). In contrast, the black background is the carbon film coating on the copper grid. Moreover, the yellow dotted circle in Fig. 1b represents for a magnified part of the Sn nanocluster@CDs as already shown in Fig. 1b, in which the lattice spacings of 0.190 nm and 0.230 nm correspond to the (311) and (220) crystal planes of the Tin (Sn, PDF card No. 05-0309), respectively. Additionally, Fig. 1c shows the lattice spacing of 0.248 nm in Sn nanocluster corresponding to the (110) crystal plane of Sn. A bright-field TEM image with a lower magnification, as shown in Fig. 1d, indicates that the average size of Sn nanocluster@CDs particles is about 2.27 nm, which is a little larger than that of Sn nanocluster (2.18 nm) as shown in Fig. 1c. Besides, the inset of Fig. 1d shows an inter-planar distance of 0.33 nm of the carbon area, corresponding to the (002) peak of graphite [28]. For comparison, Fig. 1h lists the Rs values (the relative atomic ratio of S/Sn) of the precursor Sn4+@S-CDs and the product of Sn nanocluster@CDs, the Rs value of the former is 2.48 [29], however, it decreases to 0.09 of the latter. This result suggests that during the vaporization process of the aqueous solution of Sn4+@S-CDs, a significant loss of S occurred. In the meanwhile, Sn nanoclusters were stably superposited on the S-CDs, which induced the increase of Sn content accompanied with the decrease of S content in the product of Sn nanocluster@CDs. In addition, Table S1 (Supporting information) lists the trace Cl element originating from the raw material of SnCl4, trace element S from one of the precursors (S-CDs), and some other elements (e.g., Cu, Co, Cr, Ca, Na and Si) from the carbon film-coated copper grid. The elemental mapping images (Figs. 1e–g) demonstrate the respective uniform distribution of Sn, S and C elements in the sample of Sn nanocluster@CDs, and the obviously less S distribution is consistent with the above-mentioned result of atomic ratios as listed in Fig. 1h. Therefore, it is reasonable to suppose that each carbon core of S-CD is surrounded with tiny Sn nanoclusters, which means a novel type of CD with stable Sn nanocluster-superposited structure has been successfully synthesized. The hydrodynamic diameters of Sn nanocluster@CDs in ultrapure water measured by dynamic light scattering (DLS) is much smaller than that of S-CDs, which confirms the supposition of Sn nanoclusters superposited on carbon dot (Fig. S1 in Supporting information).

|
Download:
|
| Fig. 1. (a) A representative ac-STEM image of the Sn nanoclusters with a scale bar of 20 nm, the red dotted circle line represents for Sn, and the blue dotted circle line represents for Carbon (C); (b) the yellow dotted circle line represents for a magnified part of the Sn nanoclusters@CDs as shown in Fig. 1a; (c) A representative ac-STEM image of the Sn nanocluster@CDs sample with a scale bar of 5 nm (inset: size distribution of Sn nanoclusters); (d) A bright-field TEM image of the Sn nanocluster@CDs sample with a scale bar of 20 nm (the insets: the particle-size distribution and the lattice spacing of CDs within the sample, respectively.); (e) Sn, (f) S and (g) C elemental mapping images of the ac-STEM image of the Sn nanocluster@CDs, respectively, which are consistent with the elemental atomic ratios listed in (h) atomic ratios of S and Sn elements of Sn4+@S-CDs and Sn nanocluster@CDs collected from the ac-STEM elemental mapping data. | |
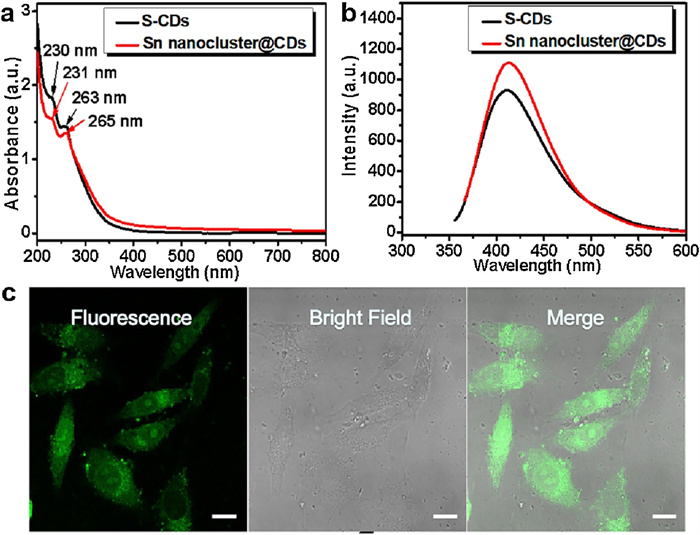
As shown in Fig. S2a (Supporting information), there are three peaks in the XPS survey spectra, assigned to O 1s, C 1s and S 2p, respectively. The S 2p spectra (Figs. S2b and e in Supporting information) can be deconvoluted into three peaks at 167.98, 168.42 and 169.25 eV, corresponding to the -C-SO2-, -C-SO3- and -C-SO4- species, respectively [30]. The manifestation of S with different valence states in the as-synthesized S-CDs is ascribed to the high chemical affinity of S toward C and O. Therefore, two different valence states of S exist in the O–S and C–S bonds favorably formed during the synthesis process. The -C-SO3- ratio in the S 2p spectrum of the Sn nanocluster@CDs (Fig. S2e) has decreased compared to that of the S-CDs (Fig. S2b). Moreover, Fig. S2c (Supporting information) presents the high-resolution O1s XPS, which consists of two peaks located at 531.7 eV (C=O) and 532.3 eV (C-O), respectively [31]. Regarding the Sn-3d spectra (Fig. S2f in Supporting information), the binding energies assigned to Sn 3d3/2 and Sn 3d5/2 are observed at 496.1 eV and 487.7 eV, respectively [32]. Besides, the insets of Fig. S2a and S2d (Supporting information) show that the atomic percentages of the C, O, S and Sn elements in the S-CDs and Sn nanocluster@CDs are 68.04% (58.63%), 25.19% (31.73%), 6.77% (5.27%) and 0 (4.37%), respectively. It should be noted that neither the atomic percentages data collected from XPS nor those data obtained from the ac-STEM elemental mapping are as accurate as the result of elemental analysis, but we still can see the change of relative contents of each kind of elements in the precursor and product. Here an increase of about 6.54 at% in the O content of the Sn nanocluster@CDs compared to that of the S-CDs, and the incorporated Sn element of 4.37 at% in the Sn nanocluster@CDs can be attributed to the Sn cluster coordination with the oxygen atoms of -C-SO3- groups on the S-CDs [29, 30, 33]. Other detailed XPS spectra of Sn nanocluster@CDs can be found in Figs. S3a–c (Supporting information). Further, Raman spectrum (Fig. S3d in Supporting information) shows two prominent signals at 1360 and 1587 cm−1 that are assigned to the disordered D band and graphitic G band, respectively. The intensity ratio of ID/IG of CDs is 0.499, suggesting the higher degree of graphitization of carbon inside the Sn nanocluster@CDs [29, 34]. As shown in Fig. S4 (Supporting information), although both zeta potentials of the S-CDs and Sn nanocluster@CDs are in negative values, a little increase of zeta potential of the latter could be ascribed to the complexation with positively-charged Sn4+ in the precursor of Sn4+@S-CDs, and subsequently, the zero-valence Sn nanoclusters superposited on the S-CDs. UV–vis absorption and PL spectra of the S-CDs and Sn nanocluster@CDs are shown in Figs. 2a and b, respectively. Both samples have the same absorbance of UV–vis light, while the latter exhibits a significantly higher PL intensity under the same excitation of 345 nm. Notably, as shown in Fig. 2b, compared to the S-CDs, the Sn nanocluster@CDs in aqueous solution (inset: digital photos of Sn nanocluster@CDs) with the same concentration of 200 μg/mL display a stronger PL emission at 425 nm, the aqueous solution containing Sn nanocluster@CDs presents a bright blue fluorescence under excitation of 365 nm UV light. Further, the HepG2 cells stained with the Sn nanocluster@CDs with a concentration of 200 μg/mL were evaluated by using a CLSM at the cellular level, as shown in Fig. 2c. All the cells have normal morphology and show bright green fluorescence. More detailed PL spectra of above-mentioned two samples are exhibited in Fig. S5 (Supporting information), illustrating that both materials show excitation-dependent fluorescence, which is a typical optical behavior of the reported CDs [35, 36]. Next, the absolute fluorescence QY of the S-CDs and Sn nanocluster@CDs are measured to be 2.70 and 4.60, respectively (Fig. S6 in Supporting information), which confirms the enhanced fluorescence of the latter.

|
Download:
|
| Fig. 2. (a) UV–vis absorption spectra and (b) PL spectra of S-CDs and Sn nanocluster@CDs in aqueous solutions with a concentration of 200 μg/mL (inset: digital photos of aqueous solutions containing Sn nanocluster@CDs under visible light and 365 nm UV light), respectively. (c) CLSM images of HepG2 cells co-incubated with 200 μg/mL Sn nanocluster@CDs under 405 nm excitation. Scale bar=10 μm. | |
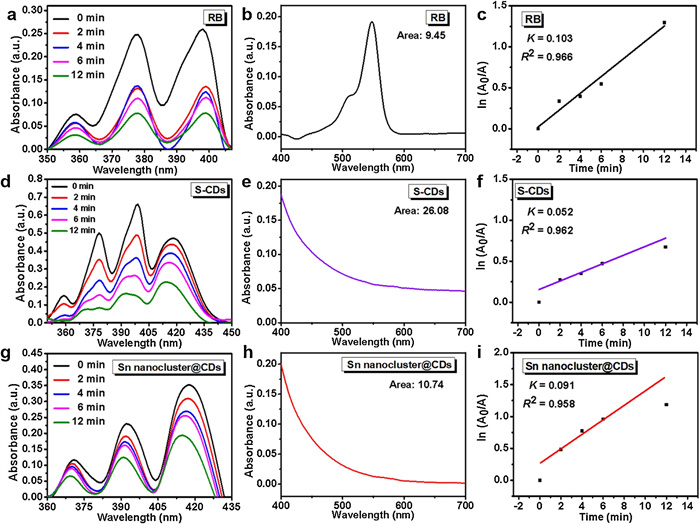
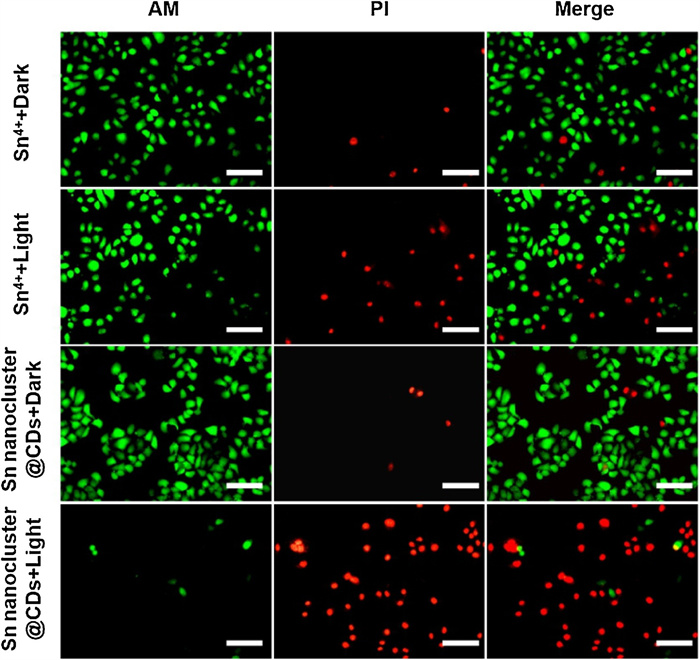
To investigate the property of 1O2 generation of the Sn nanocluster@CDs, the ESR spectra were performed. As shown in Fig. S7a (Supporting information), there are three peaks with equal areas as a typical 1:1:1 triplet signal, representing the signals of 1O2 of the sample [37]. The effect of Sn nanocluster@CDs addition leads to the increased signal of 1O2 production after light irradiation with white LED compared with the control group under darkness. The signal intensity of S-CDs is much lower with/without light than that of Sn nanocluster@CDs (Fig. S7b in Supporting information). The above-presented outcome demonstrates that after excitation of the LED light, 1O2 was generated by Sn nanocluster@CDs on account of the energy transfer from the excited triplet state to ground-state. The 1O2 QY was also evaluated using water-soluble ABDA assay while RB was used as a standard PS (Figs. 3a–i), calculating with equation S1 (Eq. S1 in Supporting information) [38]. As calculated, the 1O2 QY of Sn nanocluster@CDs is as high as 58.3%, which is much higher than that of S-CDs (13.7%). Before the biological applications of Sn nanocluster@CDs were explored, for example, the PS of clinical PDT, we first did the in vitro PDT test, with a HepG2 cell line model. Then, Calcein-AM and PI fluorescent dyes were applied to staining living cells (green) and dead cells (red), respectively. As shown in Fig. 4, it is clearly observed that strong green fluorescence and weak red fluorescence appearing in HepG2 cells under 490 nm and 545 nm irradiation, respectively.

|
Download:
|
| Fig. 3. Calculations of the 1O2 QY of Sn nanocluter@CDs in H2O: (a) UV–vis absorption spectra of the ABDA 1O2 trap in the presence of RB at different irradiation times. (b) Absorption spectrum of RB (c) Decomposition rate constants of ABDA by RB. (d) UV–vis absorption spectra of ABDA photobleaching by S-CDs at different irradiation times. (e) Absorption spectrum of S-CDs. (f) Decomposition rate constants of ABDA by S-CDs. (g) UV–vis absorption spectra of ABDA photobleaching by Sn nanocluster@CDs at different irradiation times. (h) Absorption spectrum of Sn nanocluster@CDs. (i) Decomposition rate constants of ABDA by Sn nanocluster@CDs. | |

|
Download:
|
| Fig. 4. Microscopy images of living HepG2 cells labeled with calcein-AM (green, 490 nm excitation) and dead cells labeled with PI (red, 545 nm excitation) after treatment with 250 μg/mL S-CDs and Sn nanocluster@CDs solutions, respectively. These images were taken before and after LED irradiation. The data are represented as mean±standard deviation (n=3). Scale bar=50 μm. | |
The cancer cells viability of control groups (Sn4+ with/without LED, Sn nanocluster@CDs without LED) showed a negligible decrease. On contrary, after irradiated for 12 min under LED, red fluorescence appeared in Sn nanocluster@CDs stained cells, which was stronger than that of Sn4+ stained cells and the Sn nanocluster@CDs stained cells without LED. Seen from the merged images, PI fluorescence occupied most of the cells, meaning that the growth of HepG2 cells can be inhibited by Sn nanocluster@CDs under LED light irradiation. In vitro PDT illustrates that Sn4+ did harm to CHO cells with/without light (Fig. S8a in Supporting information), while the Sn nanocluster@CDs were less harmful in the dark (Fig. S8b in Supporting information). Furthermore, after irradiation by the LED, the CHO cells died of the generated 1O2, which is consistent with the ESR and 1O2 generation test result. As shown in Fig. S9a (Supporting information), the 4T1 cell containing Sn4+ cannot grow healthily because of its high toxicity. Phototoxicity of Sn nanocluster@CDs can be clearly distinguished from Fig. S9b (Supporting information); under the irradiation of LED light, the Sn nanocluster@CDs efficiently induced the lower cell viability of the 4T1 cells, while the control group (in the dark) led to decline of the 4T1 cells. The phototherapeutic effect of Sn4+ and Sn nanocluster@CDs on cell survival was directly visualized via fluorescence microscopy. However, due to its high 1O2 generation yield, low cytotoxicity, enhanced luminescence, and water solubility, the sample of Sn nanocluster@CDs is highly expected to be applied in vivo. In the animal experiments, the 4T1 tumor sizes were recorded. Tumor sizes were calculated with the Eq. S2 (Supporting information) [39], and photographed (Fig. 5a) every two days during the 14-day treatments. Female Balb/c mice (SPF level), 4−6-week-old and 21 g were obtained from the Animal experiment center of Anhui Medical University (Hefei, China) with an Animal Experiment License Number of SYXK(Wan)2020-001. Illustrated from Fig. 5b, the test group's tumors (Sn nanocluster@CDs with LED) first began to scab, then gradually shrank over time, showing that the Sn nanocluster@CDs have the anti-tumor activity under light irradiation, while the control groups injected with the S-CDs or PBS demonstrate no shrinkage with/without LED, which is consistent with the in vitro PDT studies and ESR results of 1O2 detection. Besides, no significant weight fluctuations can be seen from the mice's weight curves (Fig. 5c). To further explore the biocompatibility and evaluate the pathological cellular changes of main organs (heart, liver, spleen, lung, and kidney) as well as tumors, histological analysis by hematoxylin-eosin (H & E) staining was used, at the end of treatment [40, 41]. As shown in Fig. S10 (Supporting information), there is almost no pathological change in normal organ tissues and little impact on liver tissue due to the release by renal excretion [42]. Only the tumors of test group treated with Sn nanocluster@CDs under LED shows pathological cellular changes, indicating undetectable systemic phototoxicity [43]. Although metal atom/ion doping is an important platform for construction of new kinds of 1O2-generating material, the major drawback associated with the metal doping is the more or less fluorescence quenching of CDs, and induced high toxicity that cannot be tolerated in human body. As previously reported, the Cu-doped carbon dots (Cu-CDs) showed a 1O2 QY of 36% [38]; the Mn‐CDs assembly can effectively produce 1O2 QY of 40% [44]. In our present work, the 1O2 QY of Sn nanocluster-CDs is at as high as 58.3%. Compared with other metal-doped CDs 1O2-generating materials, in our present work, Sn nanocluster can not only enhance the fluorescence of CDs, but also increase 1O2 QY and thus the PDT effect on 4T1 tumor both in vitro and in vivo. In a word, the as-prepared Sn nanocluster@CDs has been proved to be a promising PS for PDT in cancer therapy.

|
Download:
|
| Fig. 5. (a) Photographs of 4T1 tumor-bearing mice at different periods of treatments. (b) Tumor growth curves of mice injected by different samples with or without LED light (400-700 nm, 40 mW/cm2). (c) Body weight curves of mice during the various treatments. | |
In summary, we successfully synthesized a novel class of PS via superdepositing Sn nanocluster on the S-CDs, named as Sn nanocluster@CDs, which could effectively take the advantage of less toxicity, stronger fluorescence, higher 1O2 generation and stability to promote PDT effect. During the in vitro experiment, 4T1 cell line served as the model co-incubated with the as-prepared Sn nanocluster@CDs, demonstrating the dose-dependent cytotoxicity of the Sn nanocluster@CDs under LED light irradiation. In vivo animal experiment has confirmed that the Sn nanocluster@CDs has higher potential for PDT. It is worthy of mentioning that the as-synthesized material does negligible harm to normal cells and tissue, no visible damage happens to healthy cells, with little impact on liver tissue due to renal excretion. Such an effective feature of anti-tumor, make it a promising PS for clinical PDT application.
Declaration of competing interestThe authors declare that they have no known competing financial interests or personal relationships that could have appeared to influence the work reported in this paper.
AcknowledgmentsThis work was financially supported by the National Natural Science Foundation of China (No. 51772001). We also acknowledge the support from the Key Laboratory of Structure and Functional Regulation of Hybrid Materials (Anhui University), Ministry of Education, China. All of the authors also acknowledge the Key Laboratory of Environment-Friendly Polymer Materials of Anhui Province, Anhui University.
Appendix A. Supplementary dataSupplementary material related to this article can be found, in the online version, at doi:https://doi.org/10.1016/j.cclet.2021.01.039.
| [1] |
J. Ge, M. Lan, B. Zhou, et al., Nat. Commun. 5 (2014) 4596-4596. DOI:10.1038/ncomms5596 |
| [2] |
H. Zhu, J. Li, X. Qi, et al., Nano Lett. 18 (2018) 586-594. DOI:10.1021/acs.nanolett.7b04759 |
| [3] |
H. Chen, Y. Qiu, D. Ding, et al., Adv. Mater. 30 (2018) 1802748. DOI:10.1002/adma.201802748 |
| [4] |
F. Wu, X. Zhang, X. Chen, et al., Quantum Dots for Cancer Therapy and Bioimaging, in: Gonçalves G., Tobias G. (Eds. ), Nanooncology. Nanomedicine and Nanotoxicology. Springer, Cham., 2018, pp. 89-135.
|
| [5] |
X. Li, N. Kwon, T. Guo, et al., Angew. Chem. Int. Ed. 57 (2018) 11522-11531. DOI:10.1002/anie.201805138 |
| [6] |
B. Li, J. Xiao, M. Lan, et al., Chem. Eng. J. 408 (2021) 127245. DOI:10.1016/j.cej.2020.127245 |
| [7] |
D. Du, K. Wang, Y. Wen, et al., ACS Appl. Mater. Inter. 8 (2016) 3287-3294. DOI:10.1021/acsami.5b11154 |
| [8] |
I.V. Martynenko, V.A. Kuznetsova, A.O. Orlova, et al., Nanotechnology 26 (2015) 1-9. DOI:10.1088/0957-4484/26/5/055102 |
| [9] |
L.V. Nair, S.S. Nazeer, R.S. Jayasree, et al., ACS Nano 9 (2015) 5825-5832. DOI:10.1021/acsnano.5b00406 |
| [10] |
Z. Han, X. Dong, P. Luo, et al., Sci. Adv. 6 (2020) eaay0107. DOI:10.1126/sciadv.aay0107 |
| [11] |
Y. Zhang, F. Wang, C. Liu, et al., ACS Nano 12 (2018) 651-661. DOI:10.1021/acsnano.7b07746 |
| [12] |
H. Yang, Y. Wang, H. Huang, L. Gell, et al., Nat. Commun. 4 (2013) 2422-2429. DOI:10.1038/ncomms3422 |
| [13] |
O.S. Anastasiya, A.V. Yuri, E.T. Kristina, et al., J. Mater. Chem. B 4 (2016) 4839-4846. DOI:10.1039/C6TB00723F |
| [14] |
J. Jin, S. Zhu, Y. Song, et al., ACS Appl. Mater. Inter. 8 (2016) 27956-27965. DOI:10.1021/acsami.6b07807 |
| [15] |
S. Veeralingam, S. Badhulika, Nanoscale 12 (2020) 15336-15347. DOI:10.1039/d0nr03427d |
| [16] |
R. Khairullin, M. Mikhailov, I. Nizameev, et al., J. Colloid Interface Sci. 538 (2019) 387-396. DOI:10.1016/j.jcis.2018.12.013 |
| [17] |
C. Freire, P. Vrhovnik, Ž. Fiket, et al., Sci. Total Environ. 719 (2020) 137458. DOI:10.1016/j.scitotenv.2020.137458 |
| [18] |
B. Babu, R.C. Soy, J. Mack, et al., New J. Chem. 26 (2020) 11006-11012. DOI:10.1039/d0nj01564d |
| [19] |
C. Seidl, J. Ungelenk, E. Zittel, et al., ACS Nano 10 (2016) 3149-3157. DOI:10.1021/acsnano.5b03060 |
| [20] |
B. Babu, E. Prinsloo, J. Mack, et al., New J. Chem. 43 (2020) 18805-18812. |
| [21] |
R. Handford, T. Wheeler, T. Tilley, et al., Chem. Eur. J. 26 (2020) 6126-6129. DOI:10.1002/chem.202000969 |
| [22] |
Q. Chen, L. Chen, J. Qi, et al., Chin. Chem. Lett. 30 (2019) 1214-1218. DOI:10.1016/j.cclet.2019.03.002 |
| [23] |
W. Lv, M. Lin, R. Li, et al., Chin. Chem. Lett. 30 (2019) 1410-1414. DOI:10.1016/j.cclet.2019.04.011 |
| [24] |
B. Wang, J. Li, S. Lu, et al., Sci. Bull. 64 (2019) 1285-1292. DOI:10.1016/j.scib.2019.07.021 |
| [25] |
H. Song, X. Liu, S. Lu, et al., Sci. Bull. 64 (2019) 1788-1794. DOI:10.1016/j.scib.2019.10.006 |
| [26] |
H. Fan, X. Yu, K. Wang, et al., Eur. J. Med. Chem. 182 (2019) 111620. DOI:10.1016/j.ejmech.2019.111620 |
| [27] |
L. Yue, H. Li, Q. Sun, et al., ACS Appl. Nano Mater. 3 (2020) 869-876. DOI:10.1021/acsanm.9b02394 |
| [28] |
N.T.N. Anh, P.Y. Chang, R.A. Doong, RSC Adv. 9 (2019) 26588-26597. DOI:10.1039/C9RA04414K |
| [29] |
Q. Luo, H. Ding, X. Hu, et al., Dalton Trans. 49 (2020) 6950-6956. DOI:10.1039/d0dt01187h |
| [30] |
X. Hua, Y. Bao, F. Wu, ACS Appl. Mater. Interfaces 10 (2018) 10664-10677. DOI:10.1021/acsami.7b19549 |
| [31] |
Z. Qin, W. Wang, M. Wen, et al., Spectrochem. Acta A (2019) 117859. |
| [32] |
P.G. Choi, N. Izu, N. Shirahata, et al., Sens. Actuator B: Chem. 296 (2019) 126655. DOI:10.1016/j.snb.2019.126655 |
| [33] |
J. Jiang, Y. He, S. Li, et al., Chem. Commun. 48 (2012) 9634-9636. DOI:10.1039/c2cc34612e |
| [34] |
X. Guo, Z. Ding, S. Deng, et al., Carbon 134 (2018) 519-530. DOI:10.1016/j.carbon.2018.04.001 |
| [35] |
S. Lu, L. Sui, B. Yang, et al., Adv. Mater. 29 (2017) 1603443. DOI:10.1002/adma.201603443 |
| [36] |
B. Wang, B. Yang, S. Lu, et al., Adv. Sci. (2020) 2001453. |
| [37] |
L. Zhao, W. Yuan, J. Li, et al., Adv. Funct. Mater. 28 (2018) 1806162. DOI:10.1002/adfm.201806162 |
| [38] |
J. Wang, M. Xu, D. Wang, et al., Inorg. Chem. 58 (2019) 13394-13402. DOI:10.1021/acs.inorgchem.9b02283 |
| [39] |
J. Ge, Q. Jia, W. Liu, et al., Adv. Mater. 27 (2015) 4169-4177. DOI:10.1002/adma.201500323 |
| [40] |
T. Nguyen, A. Le, The Metabolism of Renal Cell Carcinomas and Liver Cancer. In: A. Le (Ed. ), The Heterogeneity of Cancer Metabolism. Advances in Experimental Medicine and Biology, vol 1063. Springer, Cham., 2018, pp. 107-118.
|
| [41] |
Q. Jia, J. Ge, W. Liu, et al., Adv. Mater. 30 (2018) 1706090. DOI:10.1002/adma.201706090 |
| [42] |
Q. Zeng, R. Zhang, T. Zhang, et al., Biomaterials 207 (2019) 39-48. DOI:10.1016/j.biomaterials.2019.03.042 |
| [43] |
S. Hua, J. He, F. Zhang, et al., Biomaterials 268 (2020) 120590. DOI:10.1016/j.biomaterials.2020.120590 |
| [44] |
Q. Jia, J. Ge, P. Wang, et al., Adv. Mater. 30 (2018) 1706090. DOI:10.1002/adma.201706090 |