 2021, Vol. 32


b Macao Institute of Materials Science and Engineering, Macau University of Science and Technology, Macao 999078, China
Overall water photo-splitting is a promising and ideal pathway to produce ultra-clean energy and solve the environmental pollution problem [1-3]. Recently, some traditional semiconductor photocatalysts (such as TiO2, CoO, Co3O4 and CdS) have attracted extensive attention because their conduction band (CB) and valence band (VB) potential could meet the requirements for overall water photo-splitting [4-8]. However, the band structure of most semiconductor materials cannot satisfy the requirement of H2 and O2 production simultaneously, either only semiconductors where the conduction band satisfy the hydrogen-producing position, such as Cu2S, Ce2S3, and CuInS2, or only semiconductors where valence band satisfy the oxygen-producing position, such as Fe2O3, CuO and BiVO4 [9-14].
Some methods for the improvement of the photocatalytic performance are proposed, for instance, constructing quantum dimension architectures, heterojunction composites and Z-scheme composites. Sun et al. introduced that BiVO4 quantum dots have excellent photocatalytic activity of hydrogen evolution for overall water photo-splitting, which could be attributed to the change of the CB level caused by quantum confinement effect [15-18]. Furthermore, a series of heterojunction photocatalysts have been used in water photo-splitting to adjust band structure, such as FeSe2/g-C3N4, WO3/TiO2, CdS/Cu7S4 and WO3/CdS [19-22]. Moreover, except these various modification routes, the construction of Z-scheme type composites can also efficiently enhance the activity of catalysts by reasonably modulating the band structure, for instance, CdS@Cd/ZnO, BiVO4/CDs/CdS and Cs2O/Bi2O3-ZnO [23-25]. These approaches often require some unique size, structure and a combination of multiple semiconductors, and always face the complex multi-semiconductor-interfaces.
Bi2WO6 (BWO) has become a prominent photocatalyst owing to its low cost, weak toxicity, outstanding chemical stability and excellent photocatalytic activity [26, 27]. However, owing to the positive CB potential (0.26 V vs. RHE) relatived to the H+/H2 position (0 V vs. RHE), BWO is usually used as a catalyst for photocatalytic decomposition of dye and antibiotics [28, 29]. Thus, the design of BWO based catalysts with enhanced activity for overall water photo-splitting still needs a lot of efforts.
Carbon dots (CDs) have been widely applied in photocatalysts due to its merits such as functionalized surface, unique electron storage medium, photoinduced electron transform property and large surface area [30-33]. Previous work has reported that the photo-potential generated by CDs under light can be cascaded with Fe2O3 to meet the requirement of H2 production [34]. However, this primary result only shows the H2 (O2) production over the CDs/Fe2O3 catalyst, not for the overall water photo-splitting (H2/O2 with a 2:1 stoichiometry). Also, the photoelectron extraction, charge transfer and the kinetics of the reaction have not been discussed in details.
Herein, we show the fabrication of CDs/Bi2WO6 (C-BWO) composite through a simple solvothermal method. In this complex photocatalytic system, CDs provide a photo-potential which is cascaded with BWO to make the C-BWO met the band structure requirement for overall water photo-splitting. At normal pressure, this C-BWO composite catalyst with 3 wt% CDs content shows a H2 (O2) yield of 0.28 μmol/h (0.12 μmol/h) with an approximate 2:1 (H2: O2) stoichiometry at normal pressure. Furthermore, the in-situ transient photovoltage (TPV) measurements were conducted to research the photoelectron extraction and the interface charge transfer kinetics of this composite catalyst. This work proposes a novel idea for the photocatalyst design based on single component semiconductor and CDs. It also gives a clear demonstration on the study of catalyst interface charge kinetics based on the in-situ TPV measurements.
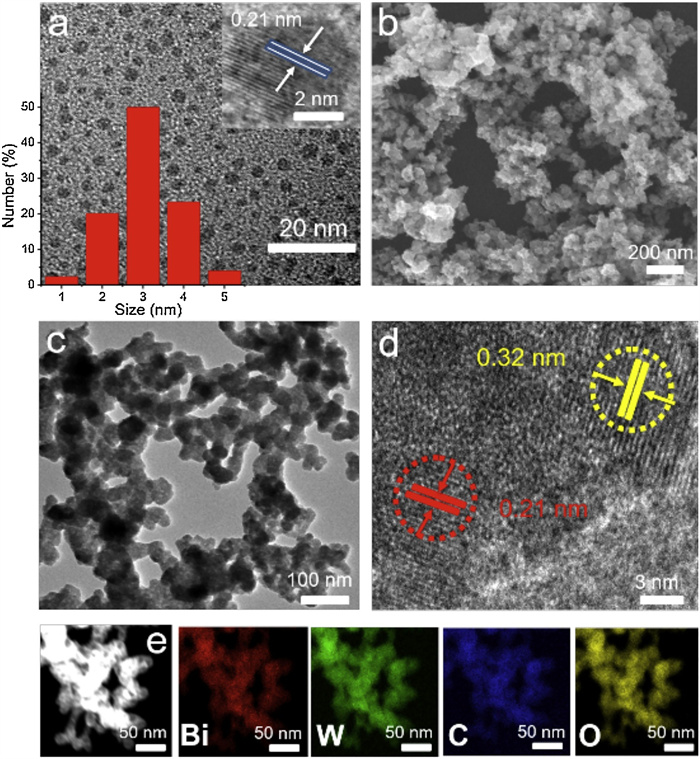
To explore the morphology of C-BWO composite, the transmission electron microscopy (TEM) and scanning electron microscope (SEM) were carried out. In Fig. 1a, the TEM and HRTEM images show that CDs are spherical and uniformly distributed with the diameter of 1–5 nm, where the lattice spacing of 0.21 nm agrees well with the (100) crystal plane of graphite carbon [35]. As depicted in Fig. 1b, the SEM image of C-BWO displays a almost uniform spherical shape with a diameter of approximate 10 nm. The TEM image of C-BWO composite is shown in Fig. 1c, where the morphology of C-BWO is also corresponding to that of SEM image. Besides, the SEM image of BWO is exhibited in Fig. S1 (Supporting information). And in Fig. 1d, the HRTEM image exhibits the lattice spacings of CDs and BWO, which further confirms the perfect combination of CDs and BWO. Furthermore, the lattice spacing of 0.21 nm is in line with the (100) crystal plane of CDs while the lattice spacing of the 0.32 nm is correlated with the (131) crystal plane of BWO [28, 29]. The corresponding EDAX images depicted in Fig. 1e present uniformly distributed elements of Bi, W, O, C of the C-BWO composite. The above results reveal that the CDs are greatly loaded onto the BWO surfaces.

|
Download:
|
| Fig. 1. (a) Typical TEM, HRTEM, and particle size distribution images of CDs. (b) SEM, (c) TEM, (d) HRTEM and (e) EDAX images of C-BWO. Here, the concentration of CDs is 3 wt% for all C-BWO samples. | |
The crystal structures of BWO and 3 wt% C-BWO XRD were measured by X-ray diffraction (XRD). As displayed in Fig. S2a (Supporting information), the curves of BWO and C-BWO only have wide peaks in the pattern, demonstrating that they have poor crystallinity. And there is no peak of CDs in the curve of 3 wt% C-BWO due to the CDs content in the sample is too low to reach the detection limit of the instrument. Moreover, the XRD pattern of CDs presented in Fig. S3a (Supporting information) displays a characteristic peak at about 24°.
To further research the surface element composition of the 3 wt% C-BWO composite, the X-ray photoelectron spectroscopy (XPS) spectra were performed. The XPS survey spectrum of the 3 wt% C-BWO composite is shown in Fig. S2b (Supporting information), which displays that Bi, W, O and C are the primary elements in the composite. Figs. S2c–f (Supporting information) exhibit the high-resolution XPS spectra of W 4f, Bi 4f, C 1s and O 1s of C-BWO. In Fig. S2c, the W 4f located at about 33.5 eV and 35.6 eV correspond to W 4f7/2 and W 4f5/2, revealing W6+ oxidized state is existed in the composite. As depicted in Fig. S2d, the Bi 4f centred at 158.7 eV and 164.0 eV is attributed to Bi 4f7/2 and Bi 4f5/2 orbits of Bi3+. The C 1s depicted in Fig. S2e could be fitted into four peaks situated at 284.5 eV, 286.3 eV, 288.0 eV and 285.5 eV, which are in line with C-C, C-O, C=O bonds and C defects respectively. As exhibited in Fig. S2f, two peaks at 529.7 eV and 530.2 eV of O 1s are correlated with the lattice oxygen of Bi-O and W-O, respectively. And the peak at 531.8 eV is subject to C-O [36, 37]. As a contrast, the XPS spectra of BWO were carried out and exhibited in Fig. S4 (Supporting information). Clearly, the C-O bond of BWO in O 1s spectrum is not obvious compared with that of C-BWO, which also demonstrates CDs and BWO have well combined. Moreover, the XPS spectra of CDs are provided in Figs. S3c and d (Supporting information) [38-40].
As depicted in Fig. S5a (Supporting information), the UV–vis absorption spectroscopy shows the optical properties of BWO and C-BWO. The absorption intensity of C-BWO is higher than that of pure BWO in the wavelength range of 350–800 nm, demonstrating that CDs increase the visible-light harvesting to some extent.
The band structure of C-BWO was characterized by cycle voltammetry (CV) and ultraviolet photoelectron spectroscopy (UPS) spectra. Fig. S5b (Supporting information) shows the CV curve of C-BWO composite, which is applied to calculate the conduction band (CB) and valence band (VB) of C-BWO as –4.24 eV and –6.95 eV, respectively (detailed calculation displayed in Supporting information) [35]. According to the formula Eg = EVB – ECB, the Eg of C-BWO can be computed to be 2.71 eV. Then the CB and VB of CDs were calculated as –4.07 V and –5.07 eV, respectively, from the CV diagram of CDs in Fig. S6 (Supporting information). The CV curve of BWO is shown in Fig. S7 (Supporting information), which is applied to compute the CB and VB of BWO as –4.57 eV and –6.92 eV, respectively. Therefore, the Eg of BWO can be computed to be 2.35 eV [41].
The valence band energy (EVB) can also obtain through the UPS spectrum exhibited in Fig. S5c (Supporting information). By subtracting the width of the He I UPS spectrum from the exciting energy (21.22 eV), the valence band of C-BWO is to be –6.86 eV, which is also close to the result of CV. Fig. S5d (Supporting information) displays the band structures of CDs, BWO and C-BWO, thus CDs play a crucial role in regulating the band gap of BWO so that C-BWO can realize photocatalytic water splitting.
To further explore the photocatalytic activity of C-BWO, some electrochemical tests were performed. Fig. S5e (Supporting information) shows the electrochemical impedance spectra (EIS) of BWO, C-BWO. The arc radius can exhibit the capacity of the charge-transport resistance. Significantly, C-BWO has faster interfacial charge transfer capacity, that is, lower transport resistance than that of BWO in the EIS Nyquist plots. Fig. S5f (Supporting information) illustrates the transient photocurrents of BWO and C-BWO with five light-on and light-off cycles at an open circuit potential. It is manifested that C-BWO exhibits the higher photocurrent intensity than that of BWO, indicating the reinforced photo-electron hole separation capacity of C-BWO composite [42].
To study the photoelectron extraction and the interface charge transfer kinetics of the C-BWO composite, the TPV tests were conducted. In Fig. S8a (Supporting information), the TPV curves for the overall diagram of CDs and BWO reveal that the BWO has higher photocurrent than that of CDs. As shown in Fig. S8b (Supporting information), the charge recombination rate of CDs and BWO can be roughly estimated by the τ that the attenuation constants (τ). The τ of CDs (0.166 ms) is bigger than that of BWO (0.090 ms), which demonstrates that the charge recombination capacity of CDs is weaker. According to Fig. S8c (Supporting information), the charge extraction process of BWO (tmax1) is faster than CDs (tmax3), indicating that BWO has the faster electron transmission capacity, and then the photo-induced electron can be transferred to CDs from BWO more easily. As displayed in Fig. S8d (Supporting information), the maximum charge extraction efficiency can be expressed by the integral area (A), that is, the total amount of extracted charge. The maximum charge extraction efficiency of CDs (A3, 0.012) is greater than that of BWO (A1, 0.007), suggesting that the capacity of pure BWO to extract electrons is weaker than that of CDs.
The TPV for overall diagram of BWO and C-BWO are displayed in Fig. S9a (Supporting information), in which, C-BWO has higher photocurrent than that of BWO. Meanwhile, the charge recombination rate of CDs and BWO (shown in Fig. S9b in Supporting information) indicates that the charge recombination rate of C-BWO (0.095 ms) is slower than that of BWO (0.090 ms). That is to say, the addition of CDs can slow down the recombination of photo-carriers. As depicted to Fig. S9c (Supporting information), the charge extraction process of C-BWO (tmax2) is faster than that of BWO (tmax1), indicating that C-BWO has the faster electron transmission capacity. In Fig. S9d (Supporting information), the maximum charge extraction efficiency of C-BWO (A2, 0.015) is greater than that of BWO (A1, 0.007), suggesting that the electron-extraction ability of C-BWO is greater than that of BWO. A further detailed comparison of the TPV with CDs and C-BWO is shown in Fig. S10 (Supporting information). All above TPV results indicate that the C-BWO catalyst should possess the highest photocatalytic activity.
To further confirm the existence of the electron transport of C-BWO in the catalytic reactions, the in-situ TPV diagrams of C-BWO under different reaction conditions are shown in Figs. S11a and b (Supporting information). By integrating the curve of the in-situ TPV, the amount of charge consumed during the oxidation and reduction reactions can be calculated. In MeCN solution, the charge generated by C-BWO during light excitation and eventually consumed by the entire circuit were defined as Q0. The photovoltage intensity of C-BWO in 0.5 vol% HCl solution (pH 5.5)/MeCN solution is lower than that of MeCN solution (ΔQ1 = 0.315), which can be attributed to electrons consumption during the H2 production reaction, leading to the decrease of the photovoltage signal. When the 0.5 vol% NaOH solution (pH 8.5)/MeCN (v/v) were introduced to the test system, the intensity of the photovoltage is much higher than that of MeCN solution (ΔQ2 = 0.285), which may be due to the water oxidation by photo-holes. Note that, the variation ΔQ1 > ΔQ2, demonstrates that the rate of hydrogen evolution reaction (HER) of the C-BWO catalyst is faster than that of oxygen evolution reaction (OER) of the C-BWO catalyst.
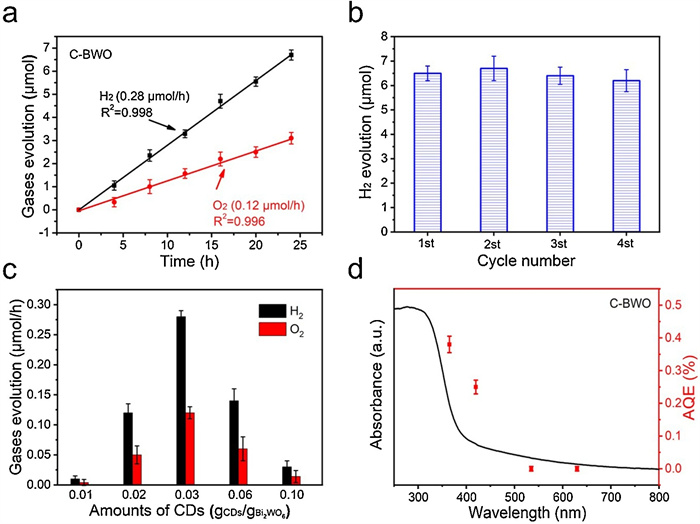
Fig. 2a displays the evolution of H2 and O2 catalysed by optimized C-BWO composite without any scavenger under visible light. And the experiments were carried out at room temperature and normal pressure. It is manifested that the as-prepared sample can overall split water into H2 and O2 in an approximate 2:1 stoichiometry. Moreover, the maximum hydrogen and oxygen evolutions yield were determined to be 0.28 μmol/h and 0.12 μmol/h, respectively. Furthermore, the cyclic stability experiments of the C-BWO were conducted under the same experimental conditions and exhibited in Fig. 2b, which illustrates the samples could still show good photocatalytic activity after four cycles (each test was conducted under visible light for 24 h, and then the catalyst was centrifuged for the next use). To investigate the influence of CDs to BWO, the photocatalytic performance of C-BWO with various concentrations of CDs were carried out. In Fig. 2c, the optimized as-prepared samples for photocatalytic H2 and O2 production is 3 wt% C-BWO, which also exhibits that redundant CDs might restrain the activity of catalyst. The apparent quantum efficiency (AQE) spectrum of C-BWO is depicted in Fig. 2d, which displayed that the maximum AQE value is reached to 0.39% at the wavelength of 365 nm (the details illustrated in Supporting information) [42]. And it is correlated well with the UV–vis absorption spectrum of C-BWO.

|
Download:
|
| Fig. 2. (a) Hydrogen and oxygen productions from overall water photo-splitting and (b) the stability of photocatalytic water splitting, catalysed by C-BWO (CDs, 3 wt%). (c) Hydrogen and oxygen productions of C-BWO with different concentrations of CDs under visible light irradiation. (d) Apparent quantum efficiency (AQE) under different incident wavelengths (365, 420, 535 and 630 nm) versus UV–vis absorption pattern of C-BWO (20 mg samples dispersed in 15 mL H2O under visible light for 24 h). | |
Fig. S12a (Supporting information) exhibits the gas evolution of C-BWO treated at different temperatures. The H2 (O2) evolution rate decrease gradually with the temperature rising from 150 ℃ to 350 ℃ for 2 h. The XPS patterns (O 1s) shown in Fig. S12b (Supporting information) illustrate that the C-BWO have a chemical bond (C-O) between CDs and BWO. Therefore, the decisive factor in photocatalytic water splitting of C-BWO can be ascribed to the interfacial function (C-O bond) between CDs and BWO, which makes contribution to charge transport. Moreover, the C-O bond may be destroyed at higher temperature so that the photocatalytic activity will decline. As shown in Fig. S12b, the O 1s spectra of C-BWO treated at different annealing temperatures were carried out. The C-BWO composite displays the highest peak of the C-O bond at 150 ℃ representing the greatest interfacial combination, which corresponds to the catalytic activity shown in Fig. S12a. To further demonstrate the bond integration between CDs and BWO, the TPV tests were constructed and depicted in Fig. S13 (Supporting information). The photocurrent intensity of C-BWO treated at 150 ℃ is the highest among that at other temperatures, indicating that the superior performance due to the strengthened C-O bond [34].
In order to further verify the active sites of redox reaction on the C-BWO composites, HER and OER electrochemical tests were conducted, respectively. As shown in Fig. 3a, CDs display a higher limiting current and a smaller onset potential comparing with BWO, suggesting that CDs might be the active site of HER reaction in C-BWO due to its great HER activity. Similarly, as depicted in Fig. 3b, BWO displays a higher limiting current comparing with CDs, moreover, BWO displays a smaller onset potential, suggesting that BWO probably is the active site of OER reaction. In Fig. 3c, the electron transfer number (n) of C-BWO can be calculated to be about 4, which illustrates that the photocatalytic water splitting process of C-BWO under visible light radiation is a typical four-electron pathway (detailed reaction conditions are shown Supporting information). As shown in the Fig. S14 (Supporting information), it is obvious that H2O2 was not measured for C-BWO via UV–vis spectrum, which further demonstrates the 4e− process of photocatalytic water splitting process [43, 44]. Based on all the above analysis, the schematic diagram of C-BWO for overall water splitting is explicitly depicted in Fig. 3d.

|
Download:
|
| Fig. 3. (a) HER LSV and (b) OER LSV curves of CDs and BWO in 0.1 mol/L Na2SO4. (C) RRDE i-t curves of C-BWO (CDs, 3 wt%) under dark or light. (d) The schematic diagram of band structure for overall water splitting over the C-BWO. | |
We have prepared C-BWO composite photocatalysts through a simple solvothermal method for visible-light-driven overall water splitting without any external scavenger. The C-BWO composite (3 wt% CDs content) exhibits the optimized hydrogen and oxygen evolutions of 0.28 μmol/h and 0.12 μmol/h at normal pressure. Significantly, we further employed the in-situ TPV technique to study the photo-electron extraction and the interface charge transfer kinetics of this composite catalyst. In this catalyst system, CDs provide a photo-potential which makes the composite catalysts could meet the band structure requirement for overall water photo-splitting. The introduction of CDs also increases the absorbance of visible light and promotes the separation capacity of charge carriers. This work proposes a novel idea for the photocatalyst design based on single component semiconductor and CDs and demonstrates on the study of catalyst interface charge kinetics based on the in-situ TPV measurements.
Declaration of competing interestThe authors report no declarations of interest.
AcknowledgmentsThis work is supported by National MCF Energy R & D Program (No. 2018YFE0306105), National Key Research and Development Project of China (No. 2020YFA0406104), Innovative Research Group Project of the National Natural Science Foundation of China (No. 51821002), National Natural Science Foundation of China (Nos. 51725204, 21771132, 51972216, 52041202), Natural Science Foundation of Jiangsu Province (No. BK20190041), Collaborative Innovation Center of Suzhou Nano Science & Technology, the Priority Academic Program Development of Jiangsu Higher Education Institutions (PAPD), and the 111 Project.
Appendix A. Supplementary dataSupplementary material related to this article can be found, in the online version, at doi:https://doi.org/10.1016/j.cclet.2021.01.041.
| [1] |
H. Tong, S. Ouyang, Y. Bi, et al., Adv. Mater. 24 (2012) 229-251. DOI:10.1002/adma.201102752 |
| [2] |
S. Cao, J. Low, J. Yu, M. Jaroniec, Adv. Mater. 27 (2015) 2150-2176. DOI:10.1002/adma.201500033 |
| [3] |
C. Zhou, R. Shi, L. Shang, et al., ChemPlusChem 82 (2017) 181-185. DOI:10.1002/cplu.201600501 |
| [4] |
Y. Wang, L. Rao, P. Wang, Z. Shi, L. Zhang, Appl. Catal. B: Environ. 262 (2020) 118308. DOI:10.1016/j.apcatb.2019.118308 |
| [5] |
W. Shi, F. Guo, C. Zhu, et al., J. Mater. Chem. A 5 (2017) 19800-19807. DOI:10.1039/C7TA06077G |
| [6] |
C. Zhu, M. Zhu, Y. Sun, et al., ACS Appl. Energy Mater. 2 (2019) 8737-8746. DOI:10.1021/acsaem.9b01712 |
| [7] |
W. Wang, X. Huang, S. Wu, et al., Appl. Catal. B: Environ. 134–135 (2013) 293-301. DOI:10.1016/j.apcatb.2013.01.013 |
| [8] |
C. Zhu, C. Liu, Y. Fu, et al., Appl. Catal. B: Environ. 242 (2019) 178-185. DOI:10.1016/j.apcatb.2018.09.096 |
| [9] |
V. Navakoteswara Rao, N. Lakshmana Reddy, M. Mamatha Kumari, et al., Appl. Catal. B: Environ. 254 (2019) 174-185. DOI:10.1016/j.apcatb.2019.04.090 |
| [10] |
Y. Huang, Z. Guo, H. Liu, et al., Adv. Funct. Mater. 29 (2019) 1903490. DOI:10.1002/adfm.201903490 |
| [11] |
W. Hu, S. Yang, J. Huang, J. Chem. Phys. 151 (2019) 214705. DOI:10.1063/1.5125024 |
| [12] |
R. Shen, L. Zhang, X. Chen, et al., Appl. Catal. B: Environ. 266 (2020) 118619. DOI:10.1016/j.apcatb.2020.118619 |
| [13] |
J.F. de Brito, F. Tavella, C. Genovese, et al., Appl. Catal. B: Environ. 224 (2018) 136-145. DOI:10.1016/j.apcatb.2017.09.071 |
| [14] |
Y. Sun, Y. Xie, C. Wu, S. Zhang, S. Jiang, Nano Res. 3 (2010) 620-631. DOI:10.1007/s12274-010-0022-8 |
| [15] |
F. Andrew Frame, E.C. Carroll, D.S. Larsen, M. Sarahan, N.D. Browning, F.E. Osterloh, Chem. Commun. (2008) 2206. DOI:10.1039/b718796c |
| [16] |
L. Liao, Q. Zhang, Z. Su, et al., Nat. Nanotechnol. 9 (2014) 69-73. DOI:10.1038/nnano.2013.272 |
| [17] |
N. Zhang, J. Shi, S.S. Mao, L. Guo, Chem. Commun. 50 (2014) 2002. DOI:10.1039/c3cc48026g |
| [18] |
S. Sun, W. Wang, D. Li, L. Zhang, D. Jiang, ACS Catal. 4 (2014) 3498-3503. DOI:10.1021/cs501076a |
| [19] |
J. Jia, W. Sun, Q. Zhang, et al., Appl. Catal. B: Environ. 261 (2020) 118249. DOI:10.1016/j.apcatb.2019.118249 |
| [20] |
F. He, A. Meng, B. Cheng, W. Ho, J. Yu, Chin. J. Catal. 41 (2020) 9-20. DOI:10.1016/S1872-2067(19)63382-6 |
| [21] |
D. Ren, R. Shen, Z. Jiang, X. Lu, X. Li, Chin. J. Catal. 41 (2020) 31-40. DOI:10.1016/S1872-2067(19)63467-4 |
| [22] |
Y. Li, Z. Liu, J. Zhang, et al., J. Alloys Compd. 790 (2019) 493-501. DOI:10.3390/catal9060493 |
| [23] |
X. Wang, G. Liu, L. Wang, et al., Adv. Energy Mater. 2 (2012) 42-46. DOI:10.1002/aenm.201100528 |
| [24] |
X. Wu, J. Zhao, L. Wang, et al., Appl. Catal. B: Environ. 206 (2017) 501-509. DOI:10.1016/j.apcatb.2017.01.049 |
| [25] |
A. Hezam, K. Namratha, Q.A. Drmosh, et al., J. Mater. Chem. A 6 (2018) 21379-21388. DOI:10.1039/c8ta08033j |
| [26] |
W. Xue, Z. Peng, D. Huang, et al., Ceram. Int. 45 (2019) 6340-6349. DOI:10.1016/j.ceramint.2018.12.119 |
| [27] |
S. Li, J. Chen, S. Hu, et al., Chem. Front. 7 (2020) 529-541. DOI:10.1039/c9qi01201j |
| [28] |
S. Wang, H. Yang, Z. Yi, X. Wang, J. Environ. Manage. 248 (2019) 109341. DOI:10.1016/j.jenvman.2019.109341 |
| [29] |
H. Yi, M. Yan, D. Huang, et al., Appl. Catal. B: Environ. 250 (2019) 52-62. DOI:10.1016/j.apcatb.2019.03.008 |
| [30] |
W. Li, Y. Liu, B. Wang, et al., Chin. Chem. Lett. 30 (2019) 2323-2327. DOI:10.1016/j.cclet.2019.06.040 |
| [31] |
H. Song, X. Liu, B. Wang, Z. Tang, S. Lu, Sci. Bull. 64 (2019) 1788-1794. DOI:10.1016/j.scib.2019.10.006 |
| [32] |
B. Wang, J. Li, Z. Tang, B. Yang, S. Lu, Sci. Bull. 64 (2019) 1285-1292. DOI:10.1016/j.scib.2019.07.021 |
| [33] |
S. Lu, L. Sui, J. Liu, et al., Adv. Mater. 29 (2017) 1603443. DOI:10.1002/adma.201603443 |
| [34] |
C. Liu, Y. Fu, Y. Xia, et al., Nanoscale 10 (2018) 2454-2460. DOI:10.1039/C7NR08000J |
| [35] |
Y. Liu, Y. Zhao, Y. Sun, et al., Appl. Catal. B: Environ. 270 (2020) 118875. DOI:10.1016/j.apcatb.2020.118875 |
| [36] |
X. Yuan, D. Shen, Q. Zhang, et al., Chem. Eng. J. 369 (2019) 292-301. DOI:10.1016/j.cej.2019.03.082 |
| [37] |
W. Xue, D. Huang, J. Li, et al., Chem. Eng. J. 373 (2019) 1144-1157. DOI:10.1016/j.cej.2019.05.069 |
| [38] |
R. Shi, Z. Li, H. Yu, et al., ChemSusChem 10 (2017) 4650-4656. DOI:10.1002/cssc.201700943 |
| [39] |
H. Yu, Y. Zhao, C. Zhou, et al., J. Mater. Chem. A 2 (2014) 3344. DOI:10.1039/c3ta14108j |
| [40] |
H. Song, X. Liu, B. Wang, Z. Tang, S. Lu, Sci. Bull. 64 (2019) 1788-1794. DOI:10.1016/j.scib.2019.10.006 |
| [41] |
Y. Zhao, Y. Liu, J. Cao, et al., Appl. Catal. B: Environ. 278 (2020) 119289. DOI:10.1016/j.apcatb.2020.119289 |
| [42] |
J. Cao, H. Wang, Y. Zhao, et al., J. Mater. Chem. A 8 (2020) 3701-3707. DOI:10.1039/c9ta13929j |
| [43] |
C. Zhu, C. Liu, Y. Zhou, et al., Appl. Catal. B: Environ. 216 (2017) 114-121. DOI:10.1016/j.apcatb.2017.05.049 |
| [44] |
F. Guo, W. Shi, C. Zhu, H. Li, Z. Kang, Appl. Catal. B: Environ. 226 (2018) 412-420. DOI:10.1016/j.apcatb.2017.12.064 |