 2021, Vol. 32


b Ministry of Education Key Laboratory for Analytical Science of Food Safety and Biology, Fujian Provincial Key Laboratory of Analysis and Detection for Food Safety, College of Chemistry, Fuzhou University, Fuzhou 350116, China
MicroRNA-122 (miRNA-122), a hepatocyte-specific oligonucleotide that accounts for 70% of the total miRNAs in the liver, plays important roles in liver homeostasis and hepatocarcinogenesis [1]. It shows great promise as a novel circulating biomarker of liver disease and toxicity [2, 3]. Recently, the pathological studies have shown that the down-regulation of the miRNA-122 can cause the tumor metastasis and deterioration in the hepatocellular carcinoma (HCC), while the restoration of the miRNA-122 expression level can delay the growth, metastasis and even reduce the angiogenic activity of the HCC cell [4, 5]. Therefore, the facile and sensitive monitoring of the miRNA-122 level is of considerable importance for the early diagnosis of the HCC.
The electrochemical methods exhibit advantages of low cost, easy for miniaturization, rapid response and high sensitivity [6-9], which is more suitable for point-of-care (POC) test of biomarkers than the other analytical methods. In traditional electrochemical DNA hybridization biosensors, the signal resources are mainly classified into two categories: (1) The external electrochemical indicators such as Ru[(NH3)5L] (L = 3-(2-phenanthren-9-yl-vinyl)-pyridine) [10] and copper(Ⅱ)-picolinic acid chelate [11] that can discriminate the unhybridized single-stand probe and hybridized double-stand structures of DNA/DNA or DNA/RNA. (2) The electroactive molecules such as methylene blue (MB) [12] and ferrocene (Fc) [13] that tethered on the terminal of the probe and present different signal intensity upon the change of probe DNA configuration by the hybridization reaction. Although these two methods are effective, the complicated fabrication process of the electroactive probe sequence and the tedious synthesis of the external indicators limit their application. Against this background, a label-free and sensitive electrochemical miRNA biosensor was fabricated based on the hybridization reaction induced ion-barrier effect as well as its impact on the electrochemical signal of Prussian blue (PB) (Fig. 1).

|
Download:
|
| Fig. 1. Schematic illustration for the preparation and the working principle of the ion-barrier effect based label-free electrochemical biosensor for miRNA-122. | |
To realize this aim, the nanocomposite of gole nanoparticle (AuNP) and PB was choose as the sensing material. The selection of AuNP is because it is a commonly used immobilization matrix for the thiolated DNA probe, and meanwhile its conductive feature can lead to enhanced signal. On the other hand, the PB is a readily available material with excellent electroactivity, and interestingly, its electrochemical behavior is strictly dependent on the concentration of some cation ions such as K +, Rb+ and NH4+ [14]. Therefore, we first fabricated the AuNP/PB modified glassy carbon electrode (GCE) through a two-step electrodeposition process. When the KNO3 was utilized as the supporting electrolyte, the K+ in the bulk solution freely diffused to the electrode surface, and participate the redox of PB through the ion-exchange process, giving rise of intense redox signal. It is of note that the selection of KNO3 as the supporting electrolyte to provide cation ion in this work is due to it is more common and readily available than the Rb+ and NH4+-containing solution. Then the thiolared probe DNA was immobilized on the AuNP/PB modified electrode through the self-assembly chemistry of Au-S bond, and hybridized with target miRNA to form the DNA/RNA hybrid on the electrode surface. This process will inevitably change the state of the electrode surface and block the free diffusion of K+ from the bulk solution to the electrode by the ion-barrier effect. Thus, the participation of K+ for the redox reaction of PB on the electrode was suppressed, and consequently, the electrochemical signal of electrode-confined PB will decrease. Through such a strategy, the target miRNA was facilely monitored without the use of external indicators and the complicated labelling of the signal tags.
First, the growth of PB and AuNP on the GCE by the two-step electrosynthesis method was characterized by scanning electron microscope (SEM). It is found that after the PB was electrosynthesized on GCE, some irregular nanograins are observed (Fig. 2A). This characteristic is similar to the electrosynthesized PB as reported in literatures [15, 16]. The average size of the particles are determined to be 145 ± 15 nm (inset of Fig. 2A). When the electrode was further electrochemically scanned in HAuCl4 solution, the original particles on PB/GCE is invisible, but numerous smaller and uniform particles appeared (Fig. 2B), indicating that the newly formed particles cover on the PB. The bright feature in the SEM image implies that the newly formed nanoparticles have good electroconductivity, which is the typical characteristic of AuNPs [17]. The successful preparation AuNP/PB was further verified by element mapping. All the constituent elements of AuNP/PB including Fe, C, N, Au are clearly observed (Fig. 2C). This result confirms the growth of AuNP/PB on the electrode surface.

|
Download:
|
| Fig. 2. SEM images of (A) PB/GCE and (B) AuNP/PB. (C) Elemental mapping of electrosynthesised AuNP/PBon GCE. (D) ATR-FTIR of PB/GCE (a) and AuNP/PB/GCE (b). | |
The electrochemical preparation of the AuNP/PB composite on GCE was also characterized by attenuated total reflection-Fourier transform infrared spectroscopy (ATR-FTIR). The results are displayed in Fig. 2D. The PB/GCE shows several characteristic absorption bands in the test range. The band at 2086 cm−1 is ascribed to the stretching vibration of C≡N in the Fe(Ⅱ)-CN-Fe(Ⅲ) structure of PB [18]. Besides, a small shoulder peak is observed at 713 cm−1, attributing to the Fe–C stretching vibration [19]. The intense absorption bands at 1636 cm−1 and 3360 cm−1 are assigned to the stretching vibration and benching vibration of —OH and H—O—H, respectively, suggesting that the interstitial water molecules are present on the PB layer through coordination to the high-spin Fe3+ [20]. After the PB/GCE was electrodeposited in HAuCl4 solution, it is observed that all the typical characteristic peaks of PB and the coordinating water molecules disappeared, suggesting that PB has been coated by the newly deposited AuNPs.
The successful fabrication of the biosensor was studied by atomic force microscopy (AFM) and the corresponding top-viewed, three-dimensional (3D), and the cross-sectional images of PB/GCE, AuNP/PB/GCE, DNA/AuNP/PB/GCE and MCH/DNA/AuNP/PB/GCE are displayed in Fig. S1 (Supporting information). Some small particles are observed on the top-viewed image of PB/GCE, and the 3D image presents the needle-shape. The relative height (H) of the largest peak and the average roughness degree (Ra) are determined to be 1.72 nm and 0.607 nm, respectively. Upon modification of AuNP, the electrode becomes much coarser, which is verified by the obvious increase of H value (5.78 nm) and Ra value (1.5 nm). After the probe DNA was immobilized on AuNP/PB/GCE, the values of H and Ra are further increased to 7.26 nm and 2.33 nm, respectively, suggesting that the 1D DNA chains have been assembled on the electrode surface. What's more, after the residual Au site that unoccupied by the probe DNA was filled with the MCH molecules, the H and Ra values show slight decreases, to the values of 7.22 nm and 2.09 nm, respectively.
The electrochemical behavior of the sensor was investigated by cyclic voltammetry (CV). Fig. 3A shows the successive CV curves of the GCE in the mixture of K3[Fe(CN)6] and 5 mmol/L FeCl3 with the electrolyte of 0.1 mol/L KCl. As seen, a pair of sharp reversible redox peaks and a pair of the quasi-reversible redox peaks are observed. According to the literature [20], the former one appeared at the lower potential range with the formal potential of 0.18 V corresponds to high spin iron species coordinated to nitrogen, namely the electron-exchange between PB and Prussian white (PW); while the later one at the higher potential centered at 0.97 V is ascribed to the low spin iron coordinated to carbon, i.e., PB to Berlin green (BG). Also, both of the two pairs of redox peak intensities enhance with the increase of the scan cycles, suggesting continuous growth of PB on the electrode surface upon the electrochemical deposition. Because the redox pair at the lower potential is much stronger in the peak current, they are chosen as the analytical signal for the following electrochemical sensing application.

|
Download:
|
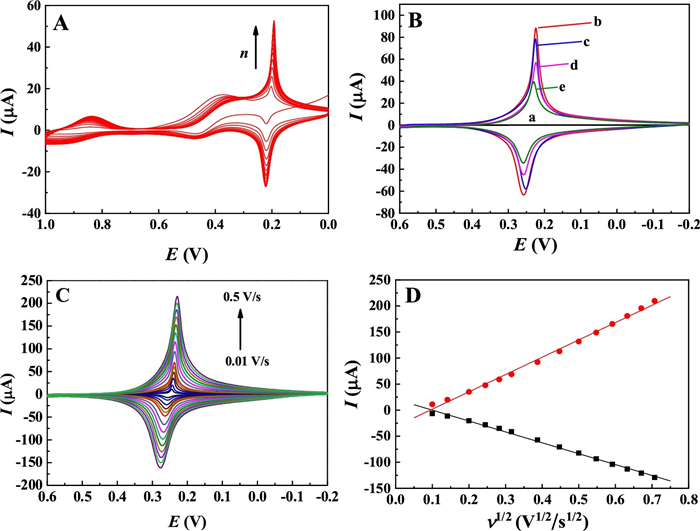
| Fig. 3. (A) Successive CV curves of the GCE in the mixture of K3[Fe(CN)6], 5 mmol/L FeCl3 and 0.1 mol/L KCl. (B) CVs of GCE (a), PB/GCE (b), AuNP/PB/GCE (c), DNA/AuNP/PB/GCE (d) and MCH/DNA/AuNP/PB/GCE (e) in 0.8 mol/L KNO3. (C) Dependence of the CVs of AuNP/PB/GCE on the scan rates ranging from 0.01 V/s to 0.5 V/s, and (D) the corresponding relationship of redox peak currents (Ip) versus the square root of the scan rate (ν1/2). | |
Furthermore, the electrochemical behaviors of GCE upon step-by-step modification were studied by CV in 0.8 mol/L KNO3. As seen, the bare GCE didnot display any Faraday's signal in the tested potential window (Fig. 3B-a). While after the PB was electrodeposited on GCE, a pair of sharp and symmetric redox peaks was appeared at 0.22 V and 0.25 V (Fig. 3B-b), respectively. The peak separation is close to 0 mV, which could be ideally observed for an adsorbed electroactive species on the electrode surface with a fast electron transfer process [21, 22]. This pair of obvious redox peaks confirms that the electroactive PB has been formed on GCE by the electrosynthesis method.
On the AuNP/PB/GCE (Fig. 3B-c), it is found that the redox peak of PB shows some decrease in comparison with PB/GCE. This is likely due to the coating of the electroactive site of PB by the AuNP, inhibiting the contact of PB with the K+ from the electrolyte. Additionally, the peak-to-peak separation of the redox peaks on AuNP/PB/GCE (ΔEp = 27 mV) is found that to be smaller than PB/GCE (ΔEp = 34 mV), suggesting that the electron transfer kinetics of the electrode can be improved by the post-modified AuNP.
Upon further modification of DNA and 6-Mercapto-1-hexanol (MCH) on the AuNP/PB/GCE, the redox peaks of PB decrease accordingly (Fig. 3B-d, e). These changes suggest that the loading of DNA and MCH molecules on AuNP/PB inhibited the diffusion of K+ to the electrode surface, and consequently, the electrochemical reaction of PB was depressed.
The effect of scan rate (v) on the electrochemical response of AuNP/PB/GCE was also investigated. The results displayed that the redox peaks remain good symmetry in all the scan rates (Fig. 3C), showing good reversibility of the redox process. In addition, the redox peak currents (Ip) are linearly correlated to the square root of the scan rate (v1/2) (Fig. 3D), suggesting that the electrochemical behavior of the electrode is a diffusion-controlled process [23]. This can be explained by the unique electrochemical reaction of PB that involves the relatively sluggish diffusion of K+ and the fast intercalation of K+ into the host of PB [24]. Such a reaction process can also be reflected by the distinctly sharp redox peak profiles of the electrode in all the scan rates. This result also inspired us that the microenvironmental variation of the electrode surface can affect the diffusion as well as intercalation of K+ into the crystal lattice of PB, and thus a PB signal change-based biosensing strategy can be established.
For the purpose of achieving the best analytical performance of the biosensor, the fabrication and test conditions of the biosensor were optimized. In order to get the largest electrochemical signal of PB on the electrode, the dependence of redox peaks on the scan cycles for PB deposition was investigated. The result shows that the reduction peaks increased with the increase of the scan cycles (n), showing that the amount of PB gradually increased on the GCE surface. When the scan cycles are beyond 15, the peak currents did not further increase, suggesting that the deposition of PB on GCE is saturated (Figs. S2A and B in Supporting information). Therefore, 15 cycles of CV scan were chosen for deposition of PB on GCE.
The assembly time of the probe DNA on the electrode was optimized by immersing AuNP/PB/GCE in 1.0 μmol/L probe DNA solution for the different time, and then electrochemically scanned. The result as shown in Figs. S2C and D (Supporting information) reveals that the differential pulse voltammogram (DPV) response signals decrease with the prolonging of the immersion time, and the peak is basically unchanged over 6 h, suggesting the adsorption saturation of probe DNA on the electrode surface. Therefore, the optimal time for probe DNA immobilization is chosen as 6 h. The hybridization time between the biosensor and the target miRNA-122 was investigated by changing the incubation time of the biosensor in 1.0 nmol/L target miRNA-122. The results show that with the extension of hybridization time, the DPV signal of the biosensor decreases, and reachs a minimum value at 60 min (Figs. S2E and F in Supporting information). Therefore, the optimal hybridization time for the sensor to detect miRNA-122 is 60 min.
The analytical sensitivity of the developed biosensor was evaluated by hybridization with different concentrations of miRNA-122. Fig. 4A shows the corresponding DPVs of the biosensor after reaction with increasing concentrations of miRNA in the range from 0 to 1.0 nmol/L. The results show that the DPV signal of PB on the electrode surface decrease when the concentration of miRNA-122 increases from 0.1 fmol/L to 1.0 nmol/L, showing that more and more hybrid duplex structure was formed on the electrode surface and blocked the approaching of the K+. As a result, the electrochemical transformation between PB and PW was inhibited. This also testified that the hybridization reaction between the probe DNA and the target miRNA-122 can be simply reflected by the ion-barrier effect induced electrochemical signal variation of PB on the electrode surface. When the target miRNA concentration was over 1.0 nmol/L, the electrochemical response of PB shows negligible change, indicating the saturation of the hybridization reaction of the DNA and the miRNA-122. The peak current difference (Δ Ip) between the biosensor and the hybridized electrode shows good linearity with the negative logarithm of the miRNA-122 (−lgCmiRNA-122) in the concentration range from 0.1 fmol/L to 1.0 nmol/L (Fig. 4B), with the calibration equation of ΔIp (μA)=2.0 lg(CmiRNA-122 (mol/L)) − 32.82, R=0.99. According to the characteristic of S/N (signal to noise)=3, the detection limit of the biosensor for miRNA-122 was estimated to be down to 0.021 fmol/L. The linear range and detection limit were superior to the previously reported values for miRNA-122 analysis (Table S1 in Supporting information), showing a promising application of the developed sensor for the sensitive detection of miRNA-122. The possible mechanism for the high sensitivity of the biosensor might lie in the following reasons: (1) The excellent intrinsic electrochemical activity of PB that directly deposited on the electrode surface contributes to the high electrochemical response of the biosensor. (2) The K+-participated electrochemical reaction of PB is sensitive to the microenvironment change of the electrode, leading to the high sensitivity of the biosensor for hybridization. In addition, the biosensor on the dependence of K+ diffusion presents the advantages of simplicity and low-cost for fabrication in comparison with the previously reported biosensors based on rolling circle amplification (RCA) [25], nuclease assisted target recycling [26, 27] and nanomaterial labeling [28, 29], showing that the biosensor is more likely to be used for practical detection of miRNA.

|
Download:
|
| Fig. 4. (A) DPVs of the AuNP/PB based biosensor upon hybridization with miRNA-122 ranging from 0 to 100 nmol/L, and (B) the corresponding calibration curve of peak current difference (ΔIp) versus the negative logarithm of the miRNA-122 concentration (-lgCmiRNA-122). | |
The specificity of the developed biosensor was investigated by comparing the signal response of biosensor after hybridization with 1.0 nmol/L miRNA-122 and the control samples including 1.0 nmol/L miRNA-29, 1.0 nmol/L miRNA-21 and the mixture of the three miRNAs. The DPV results and the corresponding histogram are displayed in Fig. S3A (Supporting information) and Fig. S3B (Supporting information), respectively. It is observed that the biosensor does not show an obvious change in peak intensity after interaction with the control miRNAs of miRNA-21 and miRNA-29, showing that the hybridization reaction does not happen on the electrode surface. However, on the miRNA-122 hybridized electrode, a significant reduction in peak current value is found. According to the aforementioned result, it can be ascribed to the hybridization induced prevention for the approaching of K+ to the electroactive PB material. The high specificity of the biosensor was further verified by the assay of the hybridization of the biosensor with the mixture solution of miRNA-122, miRNA-21 and miRNA-29. The result showed that the peak current of the electrode also decreased, and the obtained peak current is very close to that of the pure miRNA-122 hybridized electrode. This result indicates that the biosensor can selectively recognize the target miRNA in a complex solution, confirming the high specificity of the developed biosensor.
The stability of the biosensor was investigated by the storage of a prepared biosensor in a refrigerator (4 ℃) and measured its electrochemical signal at an interval of two days. It is found that, after storage of 10 days, the voltammetric signal remains 90.4% of the newly prepared biosensor, showing the AuNP/PB composite-based biosensor owns the acceptable stability when stored under low temperature (Fig. S4A in Supporting information). This can be ascribed to the excellent chemical stability of the inorganic sensing material of AuNP/PB and tight assembly of probe DNA on the electrode surface by the Au-S bond. When five biosensors were parallelly fabricated and used for the detection of 1.0 nmol/L miRNA-122, the relative standard deviation is estimated to be 5.6% (Fig. S4B in Supporting information), showing that the developed method has a good reproducibility for the detection of the miRNA.
To further assess the biosensor's analytical performance for complex biological samples, the 10% diluted human serum was adopted as the model for the analysis of miRNA-21. Under the optimized experimental conditions, when the AuNP/PB-based biosensor was applied to detect the human serum samples injected with various concentration of miRNA-122, the signals show slight changes compared to the those obtained in the blank buffer (Fig. S5 in Supporting information), suggesting that the biosensor can well capture the target miRNA-122 in a complex environment. The recoveries for the added concentrations of miRNA-122 were determined to be 108% (0.01 nmol/L), 98% (0.1 nmol/L) and 107% (1.0 nmol/L) (Table S2 in Supporting information), respectively, confirming the great promise of the developed biosensor for miRNA-21 detection in the complex biological samples.
In summary, a label-free and ultrasensitive electrochemical biosensor for HCC-specific miRNA-122 was proposed based on the K+-dependent electrochemical reaction of electrodeposited PB. When the probe DNA was hybridized with the target miRNA, the formed duplex structure blocks the approaching of the K+ in the bulk solution to the electrode surface through the ion-barrier effect, causing the decrease of the electrochemical response of the PB. Because of the high electroactivity of the PB and the strict dependence of its electroactivity on the K+, the developed biosensor presents ultrahigh sensitivity. In addition, the miRNA-122 biosensor on the dependence of K+ diffusion presents the advantages of simplicity and low-cost for fabrication in comparison with the previously reported miRNA biosensors, showing a great promising application in the practical application for early diagnosis of the HCC.
Declaration of competing interestThe authors declare that they have no known competing financial interests or personal relationships that could have appeared to influence the work reported in this paper.
AcknowledgmentsThe work is supported by the National Natural Science Foundation of China (Nos. 21802064, 81873978), Natural Science Foundation of Fujian Province (Nos. 2018J01435, 2019J05108).
Appendix A. Supplementary dataSupplementary material related to this article can be found, in the online version, at doi:https://doi.org/10.1016/j.cclet.2020.12.036.
| [1] |
C. Coulouarn, V.M. Factor, J.B. Andersen, et al., Oncogene 28 (2009) 3526-3536. DOI:10.1038/onc.2009.211 |
| [2] |
P. Xu, A. Guo, J. Xu, et al., Clin. Res. Hepatol. Gastroenterol. 41 (2017) 254-261. DOI:10.1016/j.clinre.2016.10.013 |
| [3] |
H. Lin, L.E. Ewing, I. Koturbash, et al., Food Chem. Toxicol. 110 (2017) 229-239. DOI:10.1016/j.fct.2017.10.026 |
| [4] |
K.S. Amr, H.A.E. Atia, R.A.E. Elbnhawy, et al., Gene Dis. 4 (2017) 215-221. DOI:10.1016/j.gendis.2017.10.003 |
| [5] |
X. Wei, H. Liu, X. Li, et al., Ann. Hepatol. 18 (2019) 869-878. DOI:10.1016/j.aohep.2019.07.005 |
| [6] |
M. Labib, N. Khan, S.M. Ghobadloo, et al., J. Am. Chem. Soc. 135 (2013) 3027-3038. DOI:10.1021/ja308216z |
| [7] |
F. Gao, J. Song, B. Zhang, et al., Chin. Chem. Lett. 31 (2020) 181-184. DOI:10.1016/j.cclet.2019.04.056 |
| [8] |
H. Xie, K.L. Di, R.R. Huang, Chin. Chem. Lett. 31 (2020) 1737-1745. DOI:10.1016/j.cclet.2020.02.049 |
| [9] |
J. Luo, T. Li, M.H. Yang, Chin. Chem. Lett. 31 (2020) 202-204. DOI:10.1016/j.cclet.2019.05.051 |
| [10] |
T. García, M. Revenga-Parra, H.D. Abruña, et al., Anal. Chem. 80 (2008) 77-84. DOI:10.1021/ac071095r |
| [11] |
J. Song, J. Ni, Q. Wang, et al., Biosen. Bioelectron. 141 (2019) 11405. |
| [12] |
D. Zhang, Y. Yan, H. Que, et al., ACS Sens. 5 (2020) 557-562. DOI:10.1021/acssensors.9b02461 |
| [13] |
Y. Hasegawa, T. Takada, M. Nakamura, et al., Bioorg. Med. Chem. Lett. 27 (2017) 3555-3557. DOI:10.1016/j.bmcl.2017.05.049 |
| [14] |
K. Itaya, I. Uchida, V.D. Neff, Acc. Chem. Res. 19 (1986) 162-168. DOI:10.1021/ar00126a001 |
| [15] |
Y. Jiang, X. Zhang, C. Shan, et al., Talanta 85 (2011) 76-81. DOI:10.1016/j.talanta.2011.03.028 |
| [16] |
P. Salazar, M. Martín, F.J. García-García, et al., Sens. Actuat. B: Chem. 2135 (2015) 116-123. |
| [17] |
L.X. He, S.C. Tjong, Anal. Biochem. 365 (2009) 122-131. |
| [18] |
P.J. Kulesza, M.A. Malik, A. Denca, et al., Anal. Chem. 68 (1996) 2442-2446. DOI:10.1021/ac950380k |
| [19] |
G. Moretti, C. Gervais, J. Raman Spectrosc. 49 (2018) 1198-1204. DOI:10.1002/jrs.5366 |
| [20] |
S. Husmann, E.S. Orth, A.J.G. Zarbin, Electrochim. Acta 312 (2019) 380-391. DOI:10.1016/j.electacta.2019.04.141 |
| [21] |
B. Haghighi, H. Hamidi, L. Gorton, Sens. Actuat. B: Chem. 147 (2010) 270-276. DOI:10.1016/j.snb.2010.03.020 |
| [22] |
A.K.M. Kafi, S. Alim, R. Jose, et al., J. Electroanal. Chem. 8521 (2019) 113550. |
| [23] |
N. Gao, F. Gao, S. He, et al., Anal. Chim. Acta 951 (2017) 58-67. DOI:10.1016/j.aca.2016.11.033 |
| [24] |
S. Phadke, R. Mysyk, M. Anouti, J. Energy. Chem. 40 (2020) 31-38. DOI:10.1016/j.jechem.2019.01.025 |
| [25] |
J. Chen, H. Xue, Q. Chen, et al., Chin. Chem. Lett. 30 (2019) 1631-1634. DOI:10.1016/j.cclet.2019.03.045 |
| [26] |
L. Zhou, T. Wang, Y. Bai, et al., Biosens. Bioelectron. 150 (2020) 11964. |
| [27] |
J. Wang, J. Lu, S. Dong, et al., Biosens. Bioelectron. 130 (2019) 81-87. DOI:10.1016/j.bios.2019.01.031 |
| [28] |
A.A. Jamali, M.P. Moghaddam, J.E.N. Dolatabadi, et al., TrAC. Trend. Anal. Chem. 55 (2014) 24-42. |
| [29] |
R. Tian, W. Ning, M. Chen, et al., Talanta 194 (2019) 273-281. DOI:10.1016/j.talanta.2018.09.110 |