 2021, Vol. 32


b Shenzhen Research Institute and Continuing Education, Hong Kong Baptist University, Shenzhen 518000, China
Inflammation is a defense mechanism in the body that can be triggered by various harmful stimuli, acute and/or chronic inflammation lead to a variety of diseases, such as heart and bowel diseases, diabetes, rheumatoid arthritis and cancer [1]. Therefore, it is important to investigate the detailed mechanisms of inflammation, which may contribute to the prevention and treatment of inflammatory-associated diseases. However, understanding of the mechanisms, backgrounds and roles of inflammation in physiological immune responses and pathological processes is constantly evolving [2]. Traditional Chinese medicine (TCM) has been widely used for the treatment of inflammation [3, 4]. Celastrol, a small molecule identified from TCM, was known for its potent anti-cancer [5] and anti-inflammation effect [6]. Although several direct cellular targets of celastrol was found [7-9], the in-depth molecular mechanisms of its anti-inflammation effect are still unclear, particularly in terms of acute response. Macrophages and bacterial lipopolysaccharide (LPS) is extensively used for studies of the inflammatory response as their specific abilities in immune system [10, 11]. In this study, celastrol was chosen as a model compound for the treatment of LPS-induced acute inflammation in rat macrophages to explore its molecular mechanisms of anti-inflammation effect.
Quantitative proteomics is a powerful method used to understand the whole proteome dynamics of cells, tissues or organisms. Stable isotope dimethyl labeling using reductive dimethylation is widely applied in quantitative proteomics analysis, due to its advantages in accuracy, costs, reproducibility, robustness and simplicity [12]. Validation for protein quantitation results is commonly done by antibody-based assays such as ELISAs and Western blotting. These conventional approaches may suffer from limited availability of antibodies, therefore MS-based targeted proteomics approaches such as multiple reaction monitoring (MRM), selective response monitoring (SRM) and parallel reaction monitoring (PRM) have emerged [13]. Since it was first proposed by Peterson et al. on an orbitrap instrument [14], PRM showed unique advantages including easiness in assay development, highly sensitive and specific, and selectivity from background noise [15]. These developments in the field have resulted in a growing interest in applying liquid chromatography (LC)-MS as a major platform for novel molecular targets discovery and validation [16-18].
In this study, we integrated dimethyl labeling quantitative proteomic profiling with PRM-based targeted quantitation at multiple time points to analyze the immunosuppression mechanism of celastrol against LPS. Key celastrol-regulated proteins against LPS were identified in rat macrophages cell model. Bioinformatics analysis and literature mining were conducted to select inflammation-related proteins for follow-up verification. Targeted PRM analysis was used to examine the time-dependent regulatory pattern of selected candidate proteins. In addition, qPCR assays were conducted to validate downstream efforts. The obtained findings could contribute to understanding the regulation and mechanism of proteins comprehensively during the inflammatory response, additionally which also provides new insights on the potential therapeutic targets of celastrol or the treatment of inflammation-related diseases.
To identify key components of the anti-inflammatory effects of celastrol, dimethyl-labeling proteomic analysis was performed using LPS-treated rat macrophage cell-line NR8383, which mimicked acute inflammation occurred in alveolar macrophages. One hour of pre-treatment of cells in 1 μmol/L celastrol (CEL, treated) or DMSO (Control) was performed before LPS induction, the dosage of celastrol was determined based on previous studies [19-21].
Four biological independent replicates were performed. Total cellular proteins were extracted and tryptic digested into peptides following published methods with minor modifications [22], then analyzed in ultrahigh resolution Orbitrap Fusion Tribrid mass spectrometer. Raw data obtained were then searched by the MaxQuant (version 1.6.5.0) against the rat Uniprot protein sequence database (9924 entries). After eliminating low-scoring spectra, a total of 1767 proteins at the given thresholds (FDR < 0.01, probability > 0.99 with at least two identified peptides) in the combined datasets were selected for further analysis (Table S1.XLSX in Supporting information). Among these 1767 quantified proteins, 80 proteins were altered at least 1.5 fold (Table S1 in Supporting information), 28 and 52 proteins were significantly up- and down-regulated by celastrol, respectively (Fig. 1a).

|
Download:
|
| Fig. 1. Overview of the significantly changed proteins affected by celastrol. (a) Volcano plot of CEL-regulated proteome. Each dot represents a quantified protein from dimethyl labeled samples after normalization. The x axis specifies the log2 fold change (FC) of CEL-treated sample versus DMSO control sample, and the y axis represents the negative log10 of the p values. Red and green dots represent up-regulated (FC ≥ 1.5, p < 0.05) and down-regulated metabolites (FC ≤ 0.67, p < 0.05), respectively. Statistical analysis was performed by Student t-test and statistical significance was considered for p < 0.05. (b) Protein-protein interaction networks of CEL-regulated proteins. Results was obtained by webserver of STRING. To minimize false positives as well as false negatives, Proteins were clustered based on STRING evidence score. All interactions tagged as "low-confidence" (i.e., score < 0.4) have been eliminated from this diagram. Highly enriched protein function group were circled with black dashed lines and enriched to specific functions. | |
Gene ontology (GO) consortium analysis suggested multiple biological processes, such as protein folding and drug-induced response participated in CEL-regulated anti-inflammation response (Figs. S1a-c in Supporting information). For further functional classification, KEGG pathway analysis was performed (Fig. S1d in Supporting information). The enriched pathways were involved in spliceosome, endocytosis, purine metabolism, etc., especially the process of endocytosis, which was known to play an important role in LPS induced inflammation [23]. Additionally, a protein-protein interactions (PPIs) network of CEL-regulated proteins was constructed using the STRING server (version 11.0). As a result, four clusters were significantly enriched (Fig. 1b), and these clusters were responsible for underlying mechanisms of inflammation [24-26]. The bioinformatics analysis provided a view in various molecular networks associated with the anti-inflammation effect of CEL.
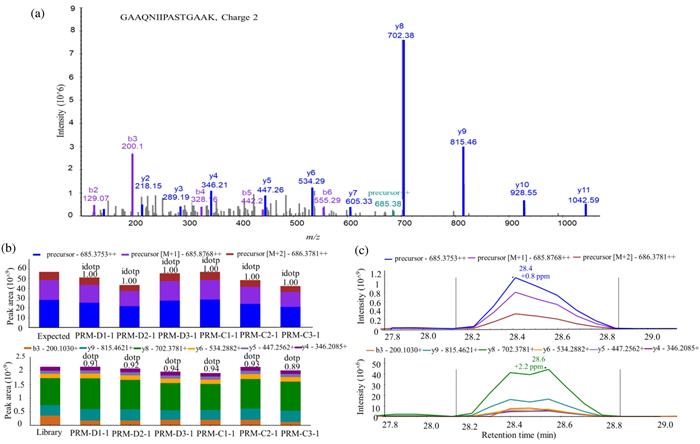
As our profiling analysis was performed on a single time point of treatment, we would like to investigate how the identified key regulatory proteins respond to LPS challenge in a time-dependent manner. It is therefore PRM method was used. Seven proteins were selected from the result of bioinformatics analysis and literature mining, these proteins were directly involved in regulating or associated with the inflammatory process. Specifically, protein S100-A4 (S100A4) has been reported as a potent factor implicated associated with various inflammation-associated diseases [27]. Beta 2 microglobulin (B2M) is a nonglycosylated polypeptide with a molecular weight of 11.7 kDa, which is elevated in high turnover states and infectious and chronic inflammatory diseases [28]. Tumor protein D52 (TPD52) modulates expression of pro-inflammatory genes to confer its pro-tumorigenic potential [29]. Phosphatidylethanolamine binding protein-1 (PEBP1, or RKIP) can interact with multiple signaling molecules to serve as one of inflammatory checkpoints [30]. High mobility group protein B2 (HMGB2), a member of the HMGB family, studies indicated that HMGB2 played a role in triggering the immune response and related to the development of inflammatory disease [31]. Coronins are a conserved family of actin cytoskeleton regulators, including Coronin1−7, which have a central role in inflammation and autoimmunity [32]. Active breakpoint cluster region-relate protein (ABR) has a function in the downregulation of inflammatory processes [33]. As house-keeping proteins could be used as normalization standards in PRM [34], Glyceraldehyde-3-phosphate dehydrogenase (GAPDH) was used for normalization across samples. The selection criteria for chosen targeted peptides were described in the experimental procedure, which resulted in 23 targeted peptides (Table S2 in Supporting information). Protein samples were harvested after 1 h CEL/DMSO pretreatment plus 0, 1 h or 2 h of LPS challenge. The samples were then digested to peptides for PRM analysis to examine the relative quantitation change in response to LPS challenge time. To illustrate in-details how the relative quantitation was performed, quantitation of a peptide from GAPDH, GAAQNIIPASTGAAK++ was shown in Fig. 2. Briefly, the profiling data in data-dependent acquisition (DDA) mode was firstly analyzed by Proteome Discoverer (version 1.4) to build a spectral library using Skyline-daily 3.7 (Fig. 2a). The six top fragment ions generated were integrated for peptide abundance calculation, while all three isotopic precursors were used for identifying confirmation (Fig. 2b). The ion intensity of both featured fragment ions from this peptide was recorded across all samples, which will then be normalized with that of control peptides within the same sample. The relative abundance of the peptide between samples could then be calculated based on the normalized intensity of featured ions (Fig. 2c).

|
Download:
|
| Fig. 2. PRM quantification example of a selected peptide. (a) A MS/MS spectrum of selected peptide GAAQNIIPASTGAAK (m/z 685.3753, 2+). (b) The total integrated fragment ion signal for the peptide at different concentrations is plotted as a bar graph; contribution from each individual fragment ion is displayed as a different color in the bars. Dot product (dotp) value indicates the degree of the match between spectral library MS/MS, the extracted ion chromatograms of the corresponding transitions; high dotp indicates the absence of interfering signals. Skyline was used to analyze the PRM data. (c) Peak area contributions of the individual fragment ions of the peptide, mass measurement error and retention time of the most intense transition is annotated above the peak. The vertical lines on either side of the peak indicate the integration boundaries for the peak. | |
PRM analysis showed that the trends of how targeted proteins were regulated were consistent with quantitative profiling (Table S2.XLSX in Supporting information). More specifically, as LPS treatment time increases, the expression of proteins S1004A, B2M, HMGB2, PEBP1 and TPD52 were significantly down-regulated in the CEL treatment group compared with the control group, while the protein level of CORO1B and ABR were constantly increased (Figs. 3a-g, red line). The PRM validation results confirmed the reliability of our profiling data and reveal the time-dependent pattern of how these targeted proteins were regulated. Interestingly, among seven proteins we monitored, down-regulation of S100a4 and B2m by CEL were observable within one hour of LPS treatment (Figs. 3a and b), therefore suggesting the proteins could be group into early/late respondents.

|
Download:
|
| Fig. 3. Time-dependent regulatory manner of selected proteins in response to LPS challenge. Time course of inflammatory proteins and their mRNA expression quantified by PRM and RT-PCR in CEL-treated NR8383 cells after stimulating with LPS for 1 h and 2 h. (a-g) The protein (red line) and mRNA (black) expression levels of S1004A, B2M, Hmgb2, Pebp1, Tpd52, Coro1b and Arb were quantified relative to the value obtained from control samples. Expression data were normalized to a housekeeping gene (GAPDH), Experiments were performed in triplicate and data was presented as mean±standard error of the mean. Significant differences were calculated shown with *p < 0.05, **p < 0.01. | |
To further explore the regulation pattern of selected CEL-regulated proteins, qRT-PCR was used to detect the mRNA abundance of selected proteins. According to the result of the PRM, seven proteins (B2M, S1004A, TPD52, PEBP1, HMGB2, CORO1B, ABR) were chosen for verification on the mRNA level (Table S3.XLSX in Supporting information). The trends in mRNA expression of selected genes basically matched with our proteomic quantitative data (Figs. 3a-g, black line). B2M, S1004A, TPD52, PEBP1 and HMGB2 were reported as promoters in inflammatory response [29, 35, 36]. Based on our results, decreased expression of these proteins may associate with the excessive inflammatory response in macrophages induced by LPS while treatment of celastrol, as an anti-inflammatory drug in pharmaceutical industry, displayed its anti-inflammation effects. In contrast, CORO1B and ABR were reported to be negative regulators of innate immune system [37, 38]. Consistent with proteomics data, mRNA of CORO1B and ABR were increased after CEL-pretreated rat macrophages in comparison with untreated group after LPS stimulation, indicating ABR and COR1B compensatory increased and displayed its function as anti-inflammatory potential to avoid the deterioration of LPS induced injury for self-protection. Therefore, CEL promoted up regulation of CORO1B and ABR expression in LPS-induced macrophages to exhibit its anti-inflammation effects.
Intriguingly, in our analysis we also observed a temporal order of the regulation for mRNA and protein abundance. The protein level of S100a4 and B2m quantified by PRM in CEL-treatment cells showed a significant downregulation within 1 h of LPS-induction (Figs. 3a and b), while their mRNA levels were only significantly down-regulated until 2 h, suggesting their protein abundance were regulated ahead of mRNA. In contrast, compared to the result of PRM, the relative mRMA level of Celastrol regulated proteins including HMGB2, PEBP1 and TPD52 showing a significant down-regulation trend generally earlier than the same change trend at the protein expression level (Figs. 3c-e), which suggested that CEL regulated the expression level of these proteins by regulating their transcriptional activity in LPS-induced inflammatory response. Coronin-1B and ABR showed strong consistency in the changes of protein and mRNA levels (Figs. 3f and g), and significantly up-regulated by CEL until two hours of LPS stimulation, which suggested that CEL may regulate their abundance via regulating their stability. The protein stability is an important determinant of total protein level [39]. Collectively, these results indicated that CEL could regulate inflammation-related genes on both mRNA and/or protein levels, which represented two different regulatory pathways (Fig. 4). This anti-inflammation compound could act on mRNA to regulate abundance of corresponding protein (HMGB2, PEBP1 and TPD52), or directly regulate protein abundance of key regulator (S100a4 and B2m) to exert its anti-inflammation function within 1 h.

|
Download:
|
| Fig. 4. The dual mechanisms of celastrol against acute inflammation. | |
In summary, a combinational strategy of both dimethyl-labeled quantitative proteome profiling and targeted PRM quantitation method was established to investigate the molecular mechanism of the anti-inflammation response of celastrol. In total there were 80 proteins differentially expressed in response to celastrol treatment. Seven proteins were selected and validated by PRM quantitation, which primarily involved in autophagy and physiological processes of inflammation. Data suggested that celastrol could inhibite the inflammatory response induced by LPS via regulating protein or mRNA level of selected proteins, probably by two independent different pathways. The integrated proteomic strategy presented in the current study constitutes an efficient workflow for discovering key components for drug response and monitoring their time-dependent regulatory pattern.
Declaration of competing interestThe authors declare that they have no known competing financial interests or personal relationships that could have appeared to influence the work reported in this paper.
AcknowledgmentsThis study was supported by grants from the National Natural Science Foundation of China (No. 21705137), China and donation from Kwok Chung Bo Fun Charitable Fund for the establishment of the Kwok Yat Wai Endowed Chair of Environmental and Biological Analysis.
| [1] |
L. Spel, F. Martinon, Immunol. Rev. 294 (2020) 48-62. DOI:10.1111/imr.12839 |
| [2] |
Nat. Immunol. 18 (2017) 825, doi: http://dx.doi.org/10.1038/ni.3798.
|
| [3] |
G.Y. Hou, L.H. Men, L. Wang, et al., Chin. Chem. Lett. 28 (2017) 1214-1219. DOI:10.1016/j.cclet.2016.12.039 |
| [4] |
J. Gao, X. Zhang, K. Shang, et al., Chin. Chem. Lett. 31 (2020) 427-430. DOI:10.1016/j.cclet.2019.09.020 |
| [5] |
Z. Guo, L. Shi, H. Feng, et al., Chin. Chem. Lett. 32 (2021) 1046-1050. DOI:10.1016/j.cclet.2020.03.066 |
| [6] |
J. Liu, J. Lee, M.A.S. Hernandez, R. Mazitschek, U. Ozcan, Cell 161 (2015) 999-1011. DOI:10.1016/j.cell.2015.05.011 |
| [7] |
S. Boridy, P.U. Le, K. Petrecca, D. Maysinger, Cell Death Dis. 5 (2014) e1216. DOI:10.1038/cddis.2014.182 |
| [8] |
H. Yang, D. Chen, Q.C. Cui, X. Yuan, Q.P. Dou, Cancer Res. 66 (2006) 4758-4765. DOI:10.1158/0008-5472.CAN-05-4529 |
| [9] |
Q. Zhao, Y. Ding, Z. Deng, et al., Chem. Sci. 6 (2015) 4124-4130. DOI:10.1039/C5SC00633C |
| [10] |
Z. Lu, L. Xu, N. He, et al., Chin. Chem. Lett. 30 (2019) 1320-1324. DOI:10.1016/j.cclet.2019.03.001 |
| [11] |
F. Jiang, H. Guan, D. Liu, et al., Food Funct. 8 (2017) 1313-1322. DOI:10.1039/C6FO01873D |
| [12] |
A.M. Altelaar, C.K. Frese, C. Preisinger, et al., J. Proteom. 88 (2013) 14-26. DOI:10.1016/j.jprot.2012.10.009 |
| [13] |
R. Aebersold, A.L. Burlingame, R.A. Bradshaw, Mol. Cell Proteomics 12 (2013) 2381-2382. DOI:10.1074/mcp.E113.031658 |
| [14] |
A.C. Peterson, J.D. Russell, D.J. Bailey, M.S. Westphall, J.J. Coon, Mol. Cell Proteomics 11 (2012) 1475-1488. DOI:10.1074/mcp.O112.020131 |
| [15] |
A. Bourmaud, S. Gallien, B. Domon, Proteomics 16 (2016) 2146-2159. DOI:10.1002/pmic.201500543 |
| [16] |
I.H. Chen, H. Xiao, T. Daly, N. Li, Anal. Chem. 92 (2020) 3751-3757. DOI:10.1021/acs.analchem.9b05081 |
| [17] |
H.A. Ebhardt, A. Root, C. Sander, R. Aebersold, Proteomics 15 (2015) 3193-3208. DOI:10.1002/pmic.201500004 |
| [18] |
A. Kisiala, S. Kambhampati, N.L. Stock, M. Aoki, R.J.N. Emery, Anal. Chem. 91 (2019) 15049-15056. DOI:10.1021/acs.analchem.9b03728 |
| [19] |
Z. Sun, Y. Li, Y. Qian, et al., Cell Death Discov. 5 (2019) 114. DOI:10.1038/s41420-019-0196-0 |
| [20] |
M. Tang, X. Cao, K. Zhang, et al., Cell Death Dis. 9 (2018) 1-12. DOI:10.1038/s41419-017-0012-9 |
| [21] |
Y.H. Li, D. He, X.J. Zhang, et al., Brain Res. 1464 (2012) 8-13. DOI:10.1016/j.brainres.2012.04.054 |
| [22] |
L. Zhu, S.Y. Fung, G. Xie, et al., Mol. Cell Proteomics 19 (2020) 1303-1309. DOI:10.1074/mcp.RA119.001897 |
| [23] |
H. Husebye, O. Halaas, H. Stenmark, et al., EMBO J. 25 (2006) 683-692. DOI:10.1038/sj.emboj.7600991 |
| [24] |
D.J. Stumpo, W.S. Lai, P.J. Blackshear, Wires RNA 1 (2010) 60-80. DOI:10.1002/wrna.1 |
| [25] |
D.H. Ostareck, A. Ostareck-Lederer, Front. Genet. 10 (2019) 31. DOI:10.3389/fgene.2019.00031 |
| [26] |
C. Xia, Z. Braunstein, A.C. Toomey, J.X. Zhong, X.Q. Rao, Front. Immunol. 8 (2018) 1908. DOI:10.3389/fimmu.2017.01908 |
| [27] |
M.W. Nasser, M. Elbaz, D.K. Ahirwar, R.K. Ganju, Cancer Lett. 365 (2015) 11-22. DOI:10.1016/j.canlet.2015.05.002 |
| [28] |
A.M. Wilson, E. Kimura, R.K. Harada, et al., Circulation 116 (2007) 1396-1403. DOI:10.1161/CIRCULATIONAHA.106.683722 |
| [29] |
C. Dasari, D.P. Yaghnam, R. Walther, R. Ummanni, Tumor Biol. 39 (2017) 1-16. |
| [30] |
M. Sisto, S. Lisi, D'Amore M., D.D. Lofrumento, Immunology 143 (2014) 42-51. DOI:10.1111/imm.12288 |
| [31] |
D.C. Avgousti, C. Herrmann, K. Kulej, .J N, et al., Nature 535 (2016) 173-177. DOI:10.1038/nature18317 |
| [32] |
W.D. Huang, S. Ghisletti, K.R. Saijo, et al., Nature 470 (2011) 414-418. DOI:10.1038/nature09703 |
| [33] |
J.M. Cunnick, S. Schmidhuber, G. Chen, et al., Mol. Cell. Biol. 29 (2009) 5742-5750. DOI:10.1128/MCB.00357-09 |
| [34] |
V. Lange, P. Picotti, B. Domon, R. Aebersold, Mol. Syst. Biol. 4 (2008) 222. DOI:10.1038/msb.2008.61 |
| [35] |
N. Ambartsumian, M. Grigorian, Mol. Biol. 50 (2016) 510-520. DOI:10.1134/S0026893316040026 |
| [36] |
H. Yin, X. Yang, W. Gu, et al., Oncotarget 8 (2017) 71642-71656. DOI:10.18632/oncotarget.17796 |
| [37] |
J.M. Cunnick, S. Schmidhuber, G. Chen, et al., Mol. Cell. Biol. 29 (2009) 5742-5750. DOI:10.1128/MCB.00357-09 |
| [38] |
S. Moriceau, C. Kantari, J. Mocek, et al., J. Immunol. 182 (2009) 7254-7263. DOI:10.4049/jimmunol.0803312 |
| [39] |
A.R. Kristensen, J. Gsponer, L.J. Foster, Mol. Syst. Biol. 9 (2013) 689. DOI:10.1038/msb.2013.47 |