 2021, Vol. 32


Hydrogen sulfide (H2S), a highly toxic gas usually produced from coal mines, oil refineries, and sewage plants [1]. Hence, effective removal of H2S prior to emission is critical to pollution control and human safety. Industrially, H2S is mainly removed by the Claus technology [2, 3]. However, about 4% of H2S is still left because of thermodynamic restriction. Among other advanced technologies, H2S selective oxidation process (H2S + 1/2O2 → S + H2O) appears to be the most promising candidate, because H2S could be wholly converted to elemental sulfur with low capital requirement [4]. Metal oxides, such as TiO2 and V2O5, were applied in H2S selective oxidation. Nevertheless, TiO2 is readily poisoned by H2O and the toxic nature of V2O5 is not desirable [5, 6].
With natural abundance, favorable redox and nontoxic property, Fe-based materials are widely investigated in desulfurization [7]. Nevertheless, the excessive oxygen consumption of Fe-based materials leads to poor sulfur selectivity [8]. Additionally, rapid deactivation caused by the strong interaction between iron and sulfur severely impedes the practical application of iron-based catalysts. For instance, Mikenin et al. reported that the considerable H2S conversion of FeOx-SiO2/GFC catalyst is attributed to the high sulfur capacity of iron [9]. Zhang et al. investigated the catalytic performance of Fe2O3 modified semi-coke catalyst, which exhibited complete H2S conversion at 180 ℃. Nevertheless, the stability was not satisfactory [10]. Various strategies have been proposed to address those issues, such as doping other metal components, decreasing the grain size of iron oxide and supported on carbon material with a large specific surface area [11]. The construction of composite oxide materials is an effective approach to improve the properties of iron oxide. Composite oxides can not only give play to the advantages of each component but also produce new properties that are not available in a single material due to the synergistic effect among components.
Tin oxide (SnO2), as an n-type semiconductor, in which oxygen in the lattice can be easily migrated to the surface, providing a movable oxygen species to facilitate various reactions [12]. Lv et al. reported improved HCHO conversion over Fe2O3@SnO2 composites compared with pure Fe2O3 and SnO2, and related the enhanced activity to the synergetic effects of Fe2O3 and SnO2 [13]. The Fe-Sn composite has been extensive studied in the field of electrocatalysis and photocatalysis due to its favorable properties caused by the synergetic effect of components [14, 15]. Nonetheless, it is seldom to come across studies on the selective oxidation of H2S. Considering the application of Fe-Sn composites in the H2S selective oxidation, the composites would give full play to the advantages of pure Fe2O3 and SnO2. Besides, it is possible for iron to enter the lattice of tin due to the radius of Fe ion is smaller than that of Sn ion, which would result in the adjustment of oxygen vacancy and reducibility. On the other hand, the lattice oxygen of SnO2 is easily migrated to the surface to effectively convert H2S to S, which is beneficial to compensate for the low sulfur selectivity of iron oxide. Therefore, it is possible to take advantage of the properties of Fe2O3 and SnO2 by constructing Fe-Sn composite material.
Toward this end, we fabricated a series of α-Fe2O3/SnO2 composites with hierarchical nanoflowers via a facile template-free hydrothermal process with the assistance of citric acid. The decomposition of citric acid during calcination would produce gases, which enables the formation of porous structures. This unique structure results in the H2S conversion, sulfur selectivity and durability of the obtained α-Fe2O3/SnO2 composites being superior to those of α-Fe2O3 and SnO2. We intrinsically clarified the effect of the interaction between Fe and Sn on the structures and physicochemical properties of the α-Fe2O3/SnO2 composites. In addition, the natures of active species and the reaction pathway are disclosed by the combination of the advanced characterizations.
The α-Fe2O3/SnO2 hierarchical nanostructures were prepared using a modified template-free hydrothermal strategy [16]. Typically, 1.5 g Na3C6H5O7·2H2O and designated amount of SnCl4·5H2O were dissolved in distilled water (100 mL). Then the temperature was raised to 50 ℃, followed by the addition of x mmol of FeCl3·6H2O and 1.92 g citric acid with further stirring for 30 min. After that, 50 mL of 6 wt% NH3·H2O solution was added dropwise into the above solution with vigorously stirred for 2 h. Subsequently, the obtained mixture was moved into a Teflon-sealed stainless steel autoclave and heated for 24 h at 100 ℃. The precipitate was washed by distilled water and alcohol for 3 times before drying overnight at 85 ℃. Finally, the hierarchical α-Fe2O3/SnO2 nanocomposites were harvested by calcined precipitates at 500 ℃ for 2 h in air (10 ℃/min). The resulted catalysts are herein denoted as FexSny (where x: y = 1:2, 1:1 and 2:1; x+y = 0.06 mol).
Briefly, 6 g C2H2O4·2H2O was dissolved in 100 mL distilled water, and 12.12 g Fe(NO3)3·9H2O was added to this solution with vigorous stirring for 2 h. The mixed solution was then sealed in a stainless-steel autoclave and heated for 24 h at 100 ℃. After washing and drying at 85 ℃ overnight, the dark-red solid was calcined at 500 ℃ under an air flow for 2 h. The obtained catalyst was denoted as α-Fe2O3.
Pure SnO2 was prepared as follows [17]: 1.073 g SnSO4 and 2.94 g Na2C6H5O7·2H2O were dissolved in a mixed solution containing 15 mL ethyl alcohol and 60 mL distilled water, then the obtained solution was sealed to 100 mL autoclave and aged at 180 ℃ for 24 h. The precipitate was centrifuged and washed with alcohol and distilled water for 3 times. Finally, the product was dried at 100 ℃ for 12 h, then calcined at 500 ℃ for 2 h under an air flow.
The structural information of catalysts was studied using an X'Pert3 Pro instrument equipped with X-ray source of Cu Kα (40 mA, 45 kV). N2-sorption measurements were performed to explore the texture parameters of catalysts by employing a 3Flex analyzer (U.S. Micromeritics). Scanning electron microscopy (SEM) images were given via Hitachi S-4800 electron microscope. Raman spectra were achieved on a Renishaw Viat Reflex spectrometer at room temperature (λ = 532 nm). The concentrations of Fe and Sn were measured by inductively coupled plasma-atomic emission spectrometry (ICP-AES) analysis on a Perkin-Elmer Optima 8000 analyzer. Transmission electron microscopy (TEM) images were obtained by a JEM-2100F microscope (200 kV). Electron paramagnetic resonance (EPR) measurements were conducted at –196.5 ℃ by an EMX-8/2.7C X-band spectrometer (Bruker). X-ray photoelectron spectroscopy (XPS) data were recorded with a Thermo Escalab250 electron spectrometer equipped with a C 1s X-ray source (284.8 eV). UV–vis diffuse reflectance spectroscopy (UV–vis DRS) was performed on a Lambda 950 spectrophotometer using BaSO4 as a reference. All the acquired spectra were transformed to Kubelka-Munk plots.
H2-temperature programmed reduction (H2-TPR) and O2-temperature programmed desorption mass-spectrometry (O2-TPD-MS) profiles were performed in an AutoChem 2920 (Micromeritics) instrument equipped with a Hiden HPR-20 mass spectrometer. Prior to H2-TPR experiment, the sample (0.1 g) was heated up to 300 ℃ in a He flow for 50 min (3 mL/min), and then cooled to 25 ℃. The TPR data were collected by heating the samples at 50–900 ℃ (10 ℃/min) in a 10 vol% H2/Ar flow. Before CO2-TPD-MS experiment, 0.1 g catalyst was heated in an Ar flow for 1 h at 300 ℃ and cooled to 25 ℃. Then the CO2 desorption profiles were recorded under Ar flow from 50 ℃ to 900 ℃ (10 ℃/min). As for O2-TPD-MS experiment, the pure O2 gas was fed to the reactor at 25 ℃ for 1 h, and then O2 profiles were recorded with the increase of temperature from 30 ℃ to 900 ℃ in a He flow.
H2S selective oxidation test of catalysts was performed in a fixed-bed reactor system from 100 ℃ to 250 ℃ (Fig. S1 in Supporting information). Typically, 0.2 g of catalyst (20−80 mesh) was taken into 8 mm round reactor. The reactant flow was composed of 2500 ppm O2, 5000 ppm H2S, 0–10 vol% H2O, 0–500 ppm SO2 and N2 (balance gas). The total gas flow rate is 40 mL/min and the weight hourly space velocity (WHSV) is 12, 000 mL g−1 h−1. The analysis of reactants and products were performed by a gas chromatograph with a TCD (thermal conductivity detector). A condenser was placed at the side of effluent to capture formed sulfur (S). The H2S conversion (XH2S), S selectivity (Ssulfur), and S yield were evaluated as follow:

|
(1) |

|
(2) |

|
(3) |
The turnover frequency (TOF, s−1) was performed to compare the catalytic performance of obtained catalysts. The TOF values of H2S oxidation over Fe atoms were calculated using the equation:

|
(4) |
Here, R means the proportional constant (8.314 J mol−1 K−1); C, T and P represent the H2S concentration, temperature (K) and standard atmospheric pressure (1.01×10⁵ Pa). MFe and βFe are the molar weight of Fe (55.85 g/mol) and Fe content (%).Vgas and mcat. are the total molar flow rate (mol/s) and catalyst weight in grams.
The crystal structure of FexSny composites was determined by X-ray diffraction (XRD) analysis, and compared with those of α-Fe2O3 and SnO2. As presented in Fig. 1A, all the diffraction peaks for SnO2 and α-Fe2O3 are consistent with those of standard XRD patterns of tetragonal SnO2 (JCPDS No. 41-1445, P42/MNM) and hexagonal α-Fe2O3 (JCPDS No. 03-0664, R-3C) crystalline structures [18], respectively. As for FexSny composites, the strong peaks at 2θ=24.1°, 33.1°, 35.6°, 40.8°, 49.4°, 54.1°, 57.6°, 62.4°, 63.9° and 71.9° can be related to the (012), (104), (110), (113), (024), (116), (112), (214), (300) and (220) crystal planes of α-Fe2O3. The distinct additional diffraction peaks at 2θ=26.7°, 33.7°, 37.8°, 51.7° and 65.9° are indexed to the (110), (101), (200), (211) and (301) crystal faces of SnO2. It can be observed that (110) plane of FexSny composites slightly shifts to higher 2θ value relative to pure SnO2, which is caused by the lattice contraction due to the ionic size of Fe3+ (0.064 nm) is smaller than Sn4+ (0.071 nm) [19]. In addition, the diffraction peaks of FexSny composites show a decreasing intensity in comparison with those of SnO2 and α-Fe2O3, which could be due to a portion of Fe3+ formed stable solid solutions with SnO2. The Fe ions can occupy SnO2 lattice sites, which leads to the change of stoichiometry and the introduction of point defects caused by charge imbalance [20]. Compared with the pure SnO2, the diffraction peaks of SnO2 over FexSny composites are broadened, indicating that the samples possess smaller crystal size (calculated values are shown in Table S1 (Supporting information).

|
Download:
|
| Fig. 1. (A) XRD pattern, (B) UV–vis DRS spectra, (C) Raman spectra, (D) EPR spectra, (E) XPS Sn 3d spectra, and (F) XPS Fe 2p spectra of as-synthesized SnO2, α-Fe2O3 and FexSny composites. | |
The UV–vis DRS analysis was performed to investigate the nature of Sn and Fe species. As displayed in Fig. 1B, SnO2 shows a band located at 275 nm, which could be ascribed to Sn4+ and/or Sn2+ species. The adsorption bands of α-Fe2O3 could be divided into three subcurves at ca. 280, 390 and 500 nm. The band at 280 nm is assigned to isolated Fe3+ species, and the bands at 390 nm and 500 nm are corresponding to oligonuclear Fex3+Oy complexes and larger α-Fe2O3 nanoparticles [21]. As for FexSny composites, the band intensity of FexSny composites increases with increasing the mole ratio of iron, indicating the increase of iron species.
The vibrational and structural properties of catalysts are studied by Raman spectroscopy. It is accepted that SnO2 possesses a rutile structure (tetragonal), which is ascribed to D4h14 space group. Therefore, SnO2 should display eight Raman vibration modes (Γ = A1g + 2A2u + A2g + B1g + 2B1u + B2g + 4Eu + Eg) in the structure. Nevertheless, several modes including A2u, A2g, B1u and B1g are Raman silent [22]. As presented in Fig. 1C, the peaks of SnO2 centered at ca. 305, 503, 632 and 778 cm–1 are assigned to Eu, Eg, A1g and B2g vibration modes of rutile SnO2 [23], respectively.α-Fe2O3 shows five bands (A1g, Eg, Eg, A1g and Eg) at 216, 282, 394, 483 and 597 cm–1 [24]. For FexSny composites, they show peaks containing α-Fe2O3 and SnO2. It can be noticed that the peaks of α-Fe2O3 dominate the Raman spectrum of Fe1Sn1 catalyst even for the mole ratio of Fe/Sn=1 in the sample, which is attributed to the high intrinsic Raman spectrum intensity ofα-Fe2O3 in comparison to that of SnO2 [25]. Compared with SnO2, the Raman peaks of FexSny composites show a slight shift to lower wavenumber with the increase of iron content, mainly arising from the partial doping of Fe into SnO2.
The EPR spectroscopy in Fig. 1D displays that the pristine SnO2 exhibits one signal at g=2.01, which is assigned to unpaired electrons trapped in singly ionized oxygen vacancies (Vo) [26]. The gaseous O2 can be adsorbed on the vacancies and get electrons from the neighboring lattice O2− species to form electrophilic oxygen species (O2− and O22−) [27]. The EPR spectrum ofα-Fe2O3 shows an intense resonance signal at g=2.03, which is assigned to the associates of Fe(Ⅲ) ions [28]. As for FexSny composites, the signal intensity of oxygen vacancy shows an increase compared with pure SnO2 and α-Fe2O3, indicating the higher oxygen vacancy concentration of FexSny composites. Among them, Fe1Sn1 catalyst is the highest in the oxygen vacancy concentration. The above results indicate that the Fe cations incorporate into SnO2 would increase the number of oxygen vacancies for the principle of electric neutrality. In addition, the SnO2/α-Fe2O3 composite would trigger the electron transfer from SnO2 to α-Fe2O3, which creates an electron accumulation layer on the side of α-Fe2O3, leading to the adsorption and activation of more oxygen [29]. The oxygen vacancies and activated oxygen species present in the catalysts are critical for their catalytic performance.
The survey of XPS spectrum (Fig. S2 in Supporting information) indicates that FexSny composites are composed of elements including Sn, Fe and O (C is observed due to the C 1s (284.8 eV) was referenced to the calibration of binding energy). The Sn 3d XPS spectra of SnO2 and FexSny composites are displayed in Fig. 1E. Clearly, there are two peaks centered at 485.7 eV and 494.2 eV, which are related to the spin-orbit splitting of Sn 3d5/2 and Sn 3d3/2, respectively. According to the NIST XPS database, the binding energy (BE) of SnO2 ranged from 484.8 eV to 487.6 eV, and that of SnO ranged from 484.2 eV to 486.3 eV [30]. Thus, the peaks at 485.3 eV and 486.0 eV in the Sn 3d5/2 region are ascribed to Sn2+ and Sn4+ species, respectively. The relative percentages of Sn2+ species in catalysts are listed in Table S1 (Supporting information), from which we observe that SnO2 exhibits low Sn2+ content (19.8 %), while the FexSny composites display increased Sn2+/(Sn2+ + Sn4+) ratio. Because Sn4+ is a scavenger of electrons and easily traps electrons, thus the electrons left by lattice O will combine with Sn4+ to form Sn2+.
As displayed in Fig. 1F, Fe 2p spectrum of α-Fe2O3 gives two main peaks at 724.1 eV and 710.5 eV with two satellite peaks at 732.2 eV and 718.6 eV, which are ascribed to the spin-orbit splitting of Fe 2p1/2 and Fe 2p3/2, respectively. FexSny composites show an additional peak at BE of 715.6 eV that is assigned to Sn 3p3/2 [31]. Importantly, the energy difference between Fe 2p1/2 and Fe 2p3/2 (13.6 eV) are predominantly of Fe3+. One additional peak at 709.1 eV is characteristic of Fe2+, which is caused by the redox equilibrium Sn2+ + 2Fe3+ ↔ Sn4+ + 2Fe2+. Note that the Fe 2p peak of FexSny composites shifts to lower BE in comparison with α-Fe2O3, which may be attributed to electron redistribution of the Fe-Sn structure. As compiled in Table S1 (Supporting information), the Fe/(Fe+Sn) molar ratio over the samples increase with the rise of Fe content, in accordance with the ratios in the preparation of catalyst.
Fig. S3 (Supporting information) exhibits the XPS spectra in the O 1s region. There are two kinds of oxygen species located at 530.5 eV and 532.1 eV, which are ascribed to the lattice oxygen (OLatt) and surface adsorbed oxygen (Oads) [32]. Thus, the XPS spectra confirm the coexistence of lattice oxygen and oxygen vacancy within theα-Fe2O3, SnO2 and FexSny composites. The Oads species from oxygen vacancy is known to be more mobile than OLatt, which is highly active in oxidation reactions [33]. The Oads/(Oads + OLatt) ratios (Table S1) show that Oads species of FexSny composites are larger than pure SnO2 and α-Fe2O3, which achieves a maximum for the Fe1Sn1. The increase of Oads species over FexSny composites could be attributed to the unique properties of SnO2: (i) Oads species in SnO2 is active, and OLatt species is mobile, which results in the facile formation of oxygen vacancies. The active electrophilic O22– would be produced via the equation: Vo + O2(gas) + 2e– ↔ O22– +2 h [34]. Then the active electrophilic O22– migrates to the surface of catalyst to form surface active oxygen; (ii) SnO2 acts as a favorable promoter with strong oxygen transfer ability. When Fe enters into the SnO2 lattice, the unstable lattice oxygen will transfer to the catalyst surface, which results in the formation of activated oxygen species [35]. Additionally, the binding energy of O 1s in FexSny composites is larger than that of pure α-Fe2O3, which could be due to the electronegativity of Sn (χ=1.96) is larger than that of Fe (χ = 1.83). Specifically, Sn possesses a stronger ability of capturing electrons than Fe, which causes the higher BE of O 1s in FexSny composites due to the smaller electron cloud density of oxygen [36].
The pore structure of SnO2, α-Fe2O3 and FexSny composites were investigated by N2 adsorption-desorption experiments. As displayed in Fig. S4A (Supporting information), all the isotherms are typical Ⅳ type with type-H1 hysteresis loop in P/P0=0.6–1.0, suggesting their mesoporous structure [37, 38]. Fig. S4B (Supporting information) shows that all the pore sizes of samples fall within the mesoporous distribution. Table S2 lists the specific surface area, average pore diameter and pore volume calculated via N2-sorption experiment. The specific surface area of SnO2 and α-Fe2O3 are 25.4 m2/g and 39.7 m2/g, respectively. The FexSny composites show a larger specific surface area than pure SnO2 and α-Fe2O3. Among them, the Fe1Sn1 sample exhibits the largest specific surface area (55.6 m2/g) and pore volume (0.33 cm3/g), while that of Fe2Sn1 decreases slightly due to pore blockage resulted from the aggregation of excessive Fe2O3.
Figs. 2A–D exhibits the SEM images of the SnO2 and FexSny composites, and all the catalysts show a flower-like 3D morphology with an average diameter of 2 μm. The flower-like architectures are comprised of a large number of short rods. The length of nanorods is 200–300 nm with a diameter of 80 nm. It can be seen that the rods of SnO2 are loosely packed, and the rods of FexSny composites are piling up tighter with the rise of iron oxide content. The Fe2Sn1 catalyst shows some small particles, which could be caused by the formation of iron oxide particles. In addition, the α-Fe2O3 possesses an irregular structure composed of nanoparticles (Fig. S5 in Supporting information). To get a closer observation of the growth processes for flower-like architectures, time-dependent studies were performed as shown in Fig. S6 (Supporting information). After 12 h reaction, the generated nanoparticles were elongated to form the rudiments of nanorods. Further prolonging the reaction time to 24 h, the hierarchical structures with a ca. 2 μm diameter were harvested. Based on the above results, the formation of hierarchical α-Fe2O3/SnO2 composites includes the generation of SnO2 precursors, accompanied by a hydrolysis process of Fe3+ on the SnO2 surface. The possible reaction pathway can be delineated as follow [39]:

|
(5) |

|
(6) |

|
Download:
|
| Fig. 2. SEM images of as-obtained catalysts: (A) SnO2, (B) Fe1Sn2, (C) Fe1Sn1 and (D) Fe2Sn1; (E) TEM images, (F) HRTEM image, and (G–I) elemental mapping images of representative Fe1Sn1 catalyst. | |
As shown in Fig. 2E, Fe1Sn1 catalyst exhibits a sphere-like architecture that is assembled by short-rods, in consistent with the SEM results. An inset TEM image shows that Fe1Sn1 possesses a porous structure, and its average pore diameter is ca. 24.7 nm, which coincides with the BET results. The HRTEM image in Fig. 2F shows that the fringe spacings of 0.27 nm and 0.33 nm match well with the (101) plane of SnO2 and (110) plane of α-Fe2O3, which are dovetail with the XRD spectra at 2θ=33.9° and 35.6°. There is not a clear interface between these two nanocrystals, indicating that the FexSny composites are not heterojunction structures. In addition, new lattice fringe of 0.24 nm appear in the HRTEM image of Fe1Sn1, this distorted lattice lines (marked by a dotted box) may be attributed to the incorporation of partial Fe atoms into SnO2 lattices, leading to the decrease of the lattice spacing or the formation of solid solutions [40]. The elemental mapping images presented in Figs. 2G–I suggest that the elements Fe, Sn and O are uniformly distributed throughout the whole nanoflower.
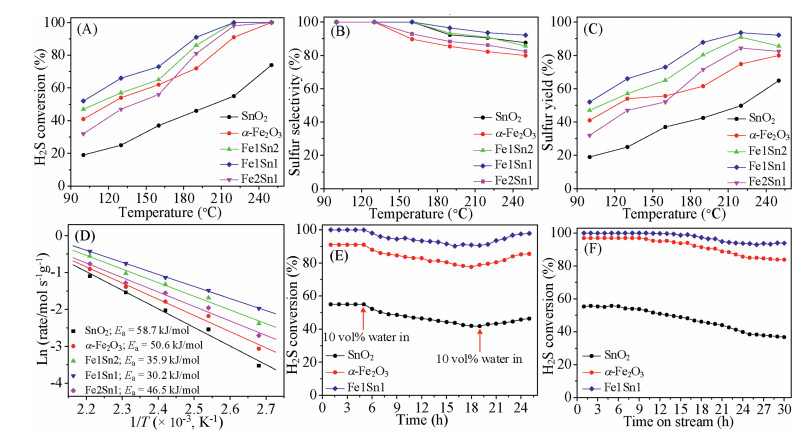
The influence of reaction temperature on the H2S conversion of SnO2, α-Fe2O3 and FexSny composites are displayed in Fig. 3A. The H2S conversion over SnO2 is only 19% at 100 ℃, and it is increased to 74% at 250 ℃. The H2S conversion of α-Fe2O3 increases from 41% to 100% with the reaction temperature rises from 100 ℃ to 250 ℃. For Fe1Sn2 and Fe2Sn1, the H2S conversion initially increases with the rise of temperature up to 220 ℃, and then remains constant at about 100%. The results indicate that the catalytic activity of FexSny composites is higher than those of SnO2 and α-Fe2O3. Among them, Fe1Sn1 exhibits the highest H2S conversion over the entire reaction temperature range, which is higher than reported Fe-based catalysts for the H2S selective oxidation (Table S3 in Supporting information).

|
Download:
|
| Fig. 3. (A) H2S conversion, (B) sulfur selectivity, (C) sulfur yield, and (D) Arrhenius plots for H2S oxidation over the SnO2, α-Fe2O3 and FexSny composites. (E) 10 vol% H2O tolerance test of the SnO2, α-Fe2O3 and Fe1Sn1 catalyst. (F) Stability test of the SnO2, α-Fe2O3 and Fe1Sn1 catalyst at 220 ℃. | |
Figs. 3B and C depict the sulfur selectivity and sulfur yield as a function of temperature. When the reaction temperature is below 130 ℃, the sulfur selectivity of all samples is 100%. As the temperature increases, the sulfur selectivity of α-Fe2O3 and Fe2Sn1 decreases. When the reaction temperature increases to 160 ℃, the sulfur selectivity of SnO2, Fe1Sn1 and Fe1Sn2 samples also decreases. This could be attributed to side reactions, including H2S deep oxidation (H2S + 3/2O2 → H2O+SO2) and sulfur oxidation (S+O2 → SO2) [41]. The sulfur selectivity of Fe1Sn1 sample decreases slowly compared with other samples, and shows relatively good sulfur selectivity within the reaction temperature range. Even at the reaction temperature of 250 ℃, it is sulfur selectivity (92.1%) is still higher than that of other samples. As shown in Fig. 3C, similar to H2S conversion, the sulfur yield of samples firstly rises with the increase of reaction temperature (100–220 ℃). As the temperature further increasing to 250 ℃, the sulfur yield of SnO2 and Fe1Sn2 increases, while that of α-Fe2O3, Fe1Sn1 and Fe2Sn1 decreases. This is attributed to a decrease in sulfur selectivity. Overall, the FexSny composites exhibit higher H2S conversion than that of α-Fe2O3 and SnO2. The sulfur has been recovered from condenser (Fig. S7 in Supporting information). In addition, an analysis of sulfur mass balance on the basis of sulfur in the used catalyst and recovered S was conducted, and the calculated data is close to the S yield.
To more closely get insight into the intrinsic reactivity of as-synthesized catalysts, the reaction rates under WHSV=36, 000 mL g−1 h−1 (H2S conversion is below 20% in order to eliminate external/internal diffusion effects) were calculated using the formula: 
Sulfur-containing streams in industry usually contain a certain amount of water vapor. Thus, it is crucial to investigate the effect of H2O on the H2S selective oxidation over SnO2, α-Fe2O3, and Fe1Sn1 at 220 ℃. As illustrated in Fig. 3E, H2S conversion of Fe1Sn1 decreases from 100% to 90.2% and remains stable after the introduction of 10 vol% H2O. As for α-Fe2O3 and SnO2, the H2S conversion decreases to 77.6% and 41.8% after the addition of H2O, respectively. The partial decrease of catalytic activity could be related to the competing adsorption of H2O and H2S on the same active sites [42]. Additionally, the introduction of H2O causes the reverse Claus reaction (3S + 2H2O ↔ 2H2S+SO2), which also results in the decline of catalytic activity for H2S oxidation. With the stop of H2O supply, the H2S conversion of Fe1Sn1 recovers toca. 97.8%, higher than that of α-Fe2O3 (85.5%) and SnO2 (46.4%). Overall, the Fe1Sn shows a high tolerance of H2O for the reaction of H2S oxidation.
The stability test over Fe1Sn1 catalyst is depicted in Fig. 3F. The H2S conversion of SnO2 catalyst is maintained at 55% for the first 6 h, after which the H2S conversion gradually decreases to only 36 % after 30 h reaction. Forα-Fe2O3 catalyst, the H2S conversion keeps at ~ 97% in the initial 9 h, then decreases with the extension of time. After 30 h reaction, the H2S conversion of α-Fe2O3 is 83%. The low stability of pure SnO2 and α-Fe2O3 is attributed to the deposition of sulfate and sulfur during reaction [43]. As for the Fe1Sn1 catalyst, the H2S conversion remains ca. 100% within 16 h, then it decreases slightly and remains constant at 94%. We can inferred that the higher concentration of oxygen vacancies in Fe1Sn1 would promote the O2 activation and hinder the formation of byproducts, ultimately leads to the higher stability of Fe1Sn1. Additionally, the porous structure facilitates the desorption of elemental sulfur and by-product SO2. After stability test, α-Fe2O3 displays an irregular structure composed of nanoparticles (Fig. S8 in Supporting information). As for SnO2, it shows a slight change in comparison with the fresh one. It can be seen that the as-prepared Fe1Sn1 catalyst maintains the original morphology after stability test, indicating the structure stability of Fe1Sn1.
To explore the impact of WHSV on the catalytic activity of Fe1Sn1, a series of tests were performed at WHSV=9000–15, 000 mL g−1 h−1. As displayed in Fig. S9A (Supporting information), Fe1Sn1 shows ca. 100% H2S conversion at WHSV below 12, 000 mL g−1 h−1. Subsequently, a further rise of WHSV causes a decline of H2S conversion (90% at 15, 000 mL g−1 h−1). Besides, sulfur selectivity shows a gradual decline in a WHSV range of 9000–15, 000 mL g−1 h−1. Though the sulfur yield decreases at higher WHSV, it is still larger than 80% because of the relatively high sulfur selectivity. Fig. S9B (Supporting information) presents the effect of H2S/O2 molar ratio on activities over Fe1Sn1 catalyst for H2S oxidation conducted at 220 ℃. Fe1Sn1 displays nearly 95% H2S conversion and 94% S selectivity at H2S/O2=3. When H2S/O2=2, H2S conversion increases to ca. 100% and S selectivity remains at 94%. Moreover, H2S conversion keeps close to 100%, while sulfur selectivity decrease to 86% with the H2S/O2 molar ratio decreases to 1:2. These results indicate that excessive oxygen is in favor of H2S deep oxidation, whereas insufficient oxygen causes the low H2S conversion [44].
To gain information about redox chemistry of the catalysts, H2-TPR measurements were carried out and the monitored TCD signals are delineated in Fig. 4A. Pure SnO2 shows a reduction peak at 645 ℃, which is related to the reduction of SnO2 to Sn metal [45]. For pure iron oxide, the peaks at 510 ℃ and 590 ℃ correspond to the reduction of Fe2O3 → FeO and FeO → Fe [46], respectively. As for FexSny composites, Fe1Sn2 catalyst exhibits two strong peaks at 340 ℃ and 635 ℃. The former peak is related to the reduction of Fe2O3 → FeO, and the latter peak is assigned to concurrent reduction of FeO and SnO2 into respective metals. The reduction peaks of Fe1Sn1 catalyst shift to lower temperatures in comparison with pure SnO2, α-Fe2O3 and other FexSny composites, which indicates that the strong interaction between Fe3+/Fe2+ and Sn4+/Sn2+ through the redox equilibrium of Sn2+ + 2Fe3+ ↔ Sn4+ + 2Fe2+, suggesting that the oxygen atoms of the Fe1Sn1 catalyst are easier to migrate to generate oxygen vacancy during the reduction process [47]. The strong interaction also makes both Fe3+ and Sn4+ become more reducible. In addition, the amount of H2 consumption (Table S5 in Supporting information) and initial H2 consumption rate (Fig. 4B) derived from H2-TPR profiles also confirm that the Fe1Sn1 possesses the highest H2 consumption and initial H2 consumption rate. The above results indicate that the FexSny composites (especially Fe1Sn1) show higher redox properties, which is beneficial for H2S oxidation.

|
Download:
|
| Fig. 4. (A) H2-TPR profiles, (B) initial H2 consumption rate, (C) O2-TPD-MS profiles and (D) the amount of desorbed O2 over SnO2, α-Fe2O3 and FexSny composites. | |
O2 activation is an important factor in oxidation reactions, thus O2-TPD-MS was measured to characterize the nature of surface oxygen species. As shown in Fig. 4C, SnO2 sample exhibits two peaks centered at 520 ℃ and 710 ℃, which are related to the decomposition of chemically adsorbed O2− (Oads) and lattice O2− (Olatt) [48], respectively. The TPD profile of α-Fe2O3 also appears two desorption peaks at 501 ℃ and 860 ℃ corresponding to Oads and Olatt species. As for FexSny composites, the peak intensity of Oads over Fe1Sn1 catalyst is higher than that of Fe2Sn1 and Fe1Sn2, which indicates that Fe1Sn1 catalyst possesses higher chemisorbed oxygen species. The enhancement of surface oxygen species could be released base on the equations: Fe2+-Vo-Sn2+ + 2O2 ↔ Fe2+-2O2−-Sn4+, Fe2+-2O2−-Sn4+ + O2 ↔ Fe3+-3O2−-Sn4+. Additionally, SnO2 can effectively convert adsorbed oxygen to O2− because of improved electron transfer performance of chemically adsorbed oxygen on the SnO2 surface. Noted that the lower desorption temperatures of the Fe1Sn1 are induced by the weaker bonding energy between the oxygen vacancies and adsorbed oxygen, which could result in better oxygen mobility. The amount of desorbed oxygen derived from O2-TPD-MS profiles (Fig. 4D and Table S6 in Supporting information) also confirms that the Fe1Sn1 catalyst exhibits the largest amount of available oxygen, which is accordance with the result of catalytic activities.
According to the results of H2-TPR and O2-TPD-MS measurements, it is concluded that the oxygen vacancies can be formed when the Fe cations incorporate into the SnO2 for the principle of electric neutrality. The oxygen vacancies in the Fe-Sn composites favors for the O2 adsorption and activation of oxygen species. In addition, the electron transfer between the Fe2+/Fe3+ and Sn2+/Sn4+ redox couples enhances the reducibility of Fe-Sn composites. Overall, the enrichment of active oxygen species and enhancement of reducibility improve catalytic performance toward H2S oxidation.
For detailed investigation of the chemistry status variation during the reaction, the XPS was conducted. As displayed in Fig. S10A (Supporting information), the Fe 2p spectra of fresh and used Fe1Sn1 catalyst indicate that the Fe species is still in a state of Fe3+/Fe2+ mixed valence. Besides, the peak intensity of Fe2+ increases after reaction (the molar ratio of Fe2+/Fe3+ increases from 8.7%–13.5%), which is attributed to the Fe diffusion from bulk to the surface [49]. As displayed in Fig. S10B (Supporting information), the Sn 3d spectrum of used Fe1Sn1 is similar to the fresh one, except for the decrease intensity of Sn2+ peak (the molar ratio of Sn2+/Sn4+ decreases from 28.3%–23.5% after reaction). The variation of Fe2+/Fe3+ and Sn2+/Sn4+ during the reaction demonstrates the electron transfer between the Fe2+/Fe3+ and Sn2+/Sn4+ redox couples, which also indicates the participation of Fe2+/Fe3+ and Sn2+/Sn4+ species in the reaction. As reported by Lu et al., the adsorbed O2 transforms into dissociated oxygen species by electron transfer, which occurs more easily on the surface of reduced SnO2−x than perfect SnO2 [50]. Therefore, the presence of Sn2+ cations on the SnO2 surface facilitates the catalytic activity. The O 1s spectra (Fig. S10C in Supporting information) imply that there is a decline of the Oads after the reaction, which confirms the participation of chemisorbed oxygen and lattice oxygen species in H2S selective oxidation.
The deposition of elemental sulfur and sulfate could be corroborated by XPS analysis. As shown in Fig. S10D (Supporting information), no S 2p signal is found in the fresh catalyst while the used one shows two discernible components relating to different sulfur species are observed at 163.5 eV and 168.2 eV, which are ascribed to the presence of S and SO42− species [51]. The XRD pattern (Fig. S11 in Supporting information) of the used Fe1Sn1 sample remains all the peaks of the fresh one, indicating that the structure of Fe1Sn1 could be sustained during the desulfurization process. Meanwhile, a new peak at 2θ=22.4° assigned to sulfur is found, confirming the formation of S during the reaction [52].
According to the above analysis, we propose that the plausible reaction pathway of H2S oxidation over the as-prepared α-Fe2O3/SnO2 nanocomposite is as follows (Fig. S12 in Supporting information). H2S molecules first adsorb on the Fe sites due to Fe (χ=1.83) is less electronegative than Sn (χ=1.96) [53]. Subsequently, the dissociated adsorbed H2S is oxidized into sulfur by surface adsorbed oxygen and activated lattice oxygen. Meanwhile, the consumed oxygen's neighboring surface Fe3+ and Sn4+ cations are reduced to Fe2+ and Sn2+. Finally, the consumed oxygen will be replenished by the gaseous O2 (O2(g) + Vo → 2O(ads)) with the formation of Fe3+ and Sn4+ to complete the reaction cycle [54]. Note that the electron transfer between the Fe2+/Fe3+ and Sn2+/Sn4+ redox couples can enhance the activation of oxygen in the catalyst. Moreover, the favorable catalytic activity and durability of the α-Fe2O3/SnO2 nanostructures are due mainly to the enhanced reducibility, abundant oxygen vacancies and strong interaction between the α-Fe2O3 and SnO2 phases over the catalyst. In addition, the porous structure facilitates the adsorption and diffusion of reactants, which also contributes to the high catalytic performance.
In summary, a series of porous α-Fe2O3/SnO2 nanostructures were synthesized by regulating the Fe/Sn molar ratio. The influence of the Fe/Sn molar ratio and chemical states of Fe and Sn on the active oxygen concentration and catalytic performance of α-Fe2O3/SnO2 nanostructures was investigated. The synergy between Fe2O3 and SnO2 leads to a higher concentration of oxygen vacancy, active oxygen species and enhanced redox properties. In addition, the constructed porous structure facilitates favorable mass transport during the reaction process. As a consequence, Fe1Sn1 catalyst is the most excellent among SnO2, α-Fe2O3 and FexSny composites, showing complete H2S conversion and 100% S selectivity at 220 ℃, superior to those of individual α-Fe2O3 and SnO2. More importantly, Fe1Sn1 catalyst shows high stability and water resistance. We can rationally anticipate that the porous α-Fe2O3/SnO2 nanocomposite is an efficient and promising catalyst for the oxidative desulphurization reaction.
Declaration of competing interestThe authors report no declarations of interest.
AcknowledgmentsThis work was supported by the National Natural Science Fund for Distinguished Young Scholars of China (No. 21825801), National Natural Science Foundation of China (Nos.21677036, 21878052 and 21773030).
Appendix A. Supplementary dataSupplementary material related to this article can be found, in the online version, at doi:https://doi.org/10.1016/j.cclet.2020.11.017.
| [1] |
P. Ding, D. Xu, N. Dong, et al., Chin. Chem. Lett. 31 (2020) 2050-2054. DOI:10.1016/j.cclet.2019.11.024 |
| [2] |
C. Lei, W. Zhou, L. Shen, et al., ACS Sustainable Chem. Eng. 7 (2019) 16257-16263. DOI:10.1021/acssuschemeng.9b03274 |
| [3] |
Y. Cao, X. Zheng, Z. Du, et al., Ind. Eng. Chem. Res. 58 (2019) 19353-19360. DOI:10.1021/acs.iecr.9b03430 |
| [4] |
Y. Pan, M. Chen, M. Hu, et al., Appl. Catal. B: Environ. 262 (2019) 118266. |
| [5] |
K.V. Bineesh, D.K. Kim, M.I. Kim, D.W. Park, Appl. Clay Sci. 53 (2011) 204-211. DOI:10.1016/j.clay.2010.12.022 |
| [6] |
X. Zhang, G. Dou, Z. Wang, et al., Catal. Sci. Technol. 3 (2013) 2778-2785. DOI:10.1039/c3cy00431g |
| [7] |
K.V. Bineesh, D.K. Kim, M.I. Kim, et al., Dalton Trans. 40 (2011) 3938-3945. DOI:10.1039/C0DT01144D |
| [8] |
F. Zhang, X. Zhang, G. Jiang, et al., Chem. Eng. J. 348 (2018) 831-839. DOI:10.1016/j.cej.2018.05.050 |
| [9] |
P. Mikenin, S. Zazhigalov, A. Elyshev, et al., Catal. Commun. 87 (2016) 36-40. DOI:10.1016/j.catcom.2016.08.038 |
| [10] |
X.Y. Zhang, L. Cui, D.H. An, et al., Energy Fuels 34 (2020) 2315-2322. DOI:10.1021/acs.energyfuels.9b03666 |
| [11] |
W. Zhao, X. Zheng, S. Liang, et al., Green Chem. 20 (2018) 4645-4654. DOI:10.1039/C8GC02184H |
| [12] |
Z. Zhao, B. Wang, J. Ma, et al., Chinese J. Catal. 38 (2017) 1322-1329. DOI:10.1016/S1872-2067(17)62864-X |
| [13] |
T. Lv, C. Peng, H. Zhu, W. Xiao, Appl. Surf. Sci. 457 (2018) 83-92. DOI:10.1016/j.apsusc.2018.06.254 |
| [14] |
C. Zhao, W. Hu, Z. Zhang, et al., Sens. Actuat. B: Chem. 195 (2014) 486-493. DOI:10.1016/j.snb.2014.01.084 |
| [15] |
M. Niu, F. Huang, L. Cui, et al., ACS Nano 4 (2010) 681-688. DOI:10.1021/nn901119a |
| [16] |
X.Y. Liu, Y.L. Han, Q. Li, D. Pan, Key Eng. Mater. 727 (2017) 718-725. DOI:10.4028/www.scientific.net/KEM.727.718 |
| [17] |
P. Sun, W. Zhao, Y. Cao, et al., Cryst. Eng. Comm. 13 (2011) 3718-3724. DOI:10.1039/c1ce05073g |
| [18] |
Y. Yin, S. Xin, L. Wan, et al., Sci. China Chem. 55 (2012) 1314-1318. DOI:10.1007/s11426-012-4659-x |
| [19] |
M.M. Bagheri-Mohagheghi, N. Shahtahmasebi, M.R. Alinejad, et al., Solid State Sci. 11 (2009) 233-239. DOI:10.1016/j.solidstatesciences.2008.05.005 |
| [20] |
L. Fang, X. Zu, Z. Li, et al., J. Alloys. Compd. 454 (2008) 261-267. DOI:10.1016/j.jallcom.2006.12.014 |
| [21] |
X. Zhang, G. Dou, Z. Wang, et al., J. Hazard. Mater. 260 (2013) 104-111. DOI:10.1016/j.jhazmat.2013.05.008 |
| [22] |
V. Bonu, A. Das, A. Sivadasan, et al., J. Raman Spectrosc. 46 (2015) 1037-1040. DOI:10.1002/jrs.4747 |
| [23] |
Y. Yan, F.H. Du, X.P. Shen, et al., J.Mater. Chem. A Mater. Energy Sustain. 2 (2014) 15875-15882. DOI:10.1039/C4TA02077D |
| [24] |
H. Liang, C. Xia, A.H. Emwas, et al., Nano Energy 49 (2018) 155-162. DOI:10.1016/j.nanoen.2018.04.032 |
| [25] |
M. Rumyantseva, V. Kovalenko, A. Gaskov, et al., Sens. Actuat. B: Chem. 109 (2005) 64-74. DOI:10.1016/j.snb.2005.03.017 |
| [26] |
M. D'Arienzo, D. Cristofori, R. Scotti, F. Morazzoni, Chem. Mater. 25 (2013) 3675-3686. DOI:10.1021/cm401895x |
| [27] |
J.W. Xu, Y. Zhang, X.L. Xu, et al., ACS Catal. 9 (2019) 4030-4045. DOI:10.1021/acscatal.9b00022 |
| [28] |
H. Mahmoud, I. Battisha, F. Ezz-Eldin, Spectrochim. Acta A 150 (2015) 72-82. DOI:10.1016/j.saa.2015.05.011 |
| [29] |
Y. Guo, J. Liang, Y. Liu, et al., Ind. Eng. Chem. Res. 58 (2019) 18569-18581. DOI:10.1021/acs.iecr.9b03687 |
| [30] |
S. Chai, X. Bai, J. Li, et al., Appl. Surf. Sci. 402 (2017) 12-20. DOI:10.1016/j.apsusc.2017.01.058 |
| [31] |
N. Wang, Y. Du, W. Ma, et al., Appl. Catal. B: Environ. 210 (2017) 23-33. DOI:10.1016/j.apcatb.2017.03.037 |
| [32] |
P. Wang, Y. Ji, Q. Shao, et al., Sci. Bull. (Beijing) 65 (2019) 350-358. |
| [33] |
H. Liu, Y. Wu, L. Liu, et al., Appl. Surf. Sci. 498 (2019) 143780. DOI:10.1016/j.apsusc.2019.143780 |
| [34] |
Y. Liu, Y. Liu, Y. Guo, et al., Ind. Eng. Chem. Res. 57 (2018) 14052-14063. DOI:10.1021/acs.iecr.8b03401 |
| [35] |
J.Y. Liu, M.J. Dai, T.S. Wang, et al., ACS Appl. Mater. Interfaces 8 (2016) 6669-6677. DOI:10.1021/acsami.6b00169 |
| [36] |
X. Yao, Y. Xiong, W. Zou, et al., Appl. Catal. B: Environ. 144 (2014) 152-165. DOI:10.1016/j.apcatb.2013.06.020 |
| [37] |
X. Zheng, X. Chen, J. Chen, et al., Chem. Eng. J. 297 (2016) 148-157. DOI:10.1016/j.cej.2016.03.146 |
| [38] |
Y. Xiao, X. Zheng, X. Chen, et al., Ind. Eng. Chem. Res. 56 (2017) 1687-1695. DOI:10.1021/acs.iecr.6b03799 |
| [39] |
P. Sun, Y. Cai, S. Du, et al., Sens. Actuat. B: Chem. 182 (2013) 336-343. DOI:10.1016/j.snb.2013.03.019 |
| [40] |
H. Kanai, H. Mizutani, T. Tanaka, et al., J. Mater. Chem. 2 (1992) 703-707. DOI:10.1039/JM9920200703 |
| [41] |
G. Lei, Z. Dai, Z. Fan, et al., Carbon 155 (2019) 204-214. DOI:10.1016/j.carbon.2019.08.052 |
| [42] |
X. Zheng, Y. Li, L. Zhang, et al., Appl. Catal. B: Environ. 252 (2019) 98-110. DOI:10.1016/j.apcatb.2019.04.014 |
| [43] |
X. Zheng, L. Shen, X. Chen, et al., Inorg. Chem. 57 (2018) 10081-10089. DOI:10.1021/acs.inorgchem.8b01232 |
| [44] |
F. Zhang, X. Zhang, Z. Hao, et al., J. Hazard. Mater. 342 (2018) 749-757. DOI:10.1016/j.jhazmat.2017.09.014 |
| [45] |
Q. Sun, X. Xu, H. Peng, et al., Chinese J. Catal. 37 (2016) 1293-1302. DOI:10.1016/S1872-2067(15)61119-6 |
| [46] |
Y. Xia, W. Zhan, Y. Guo, et al., Chinese J. Catal. 37 (2016) 2069-2078. DOI:10.1016/S1872-2067(16)62534-2 |
| [47] |
S. Singh, Bull. Mater. Sci. 27 (2004) 537-541. DOI:10.1007/BF02707282 |
| [48] |
C. Liu, H. Xian, Z. Jiang, et al., Appl. Catal. B: Environ. 176 (2015) 542-552. |
| [49] |
X. Zheng, Y. Li, Y. Zheng, et al., ACS Catal. 10 (2020) 3968-3983. DOI:10.1021/acscatal.9b05486 |
| [50] |
Z. Lu, D. Ma, L. Yang, et al., Phys. Chem. Chem. Phys. 16 (2014) 12488-12494. DOI:10.1039/C4CP00540F |
| [51] |
S. Li, Q. Gu, N. Cao, et al., J. Mater. Chem. A Mater. Energy Sustain. 8 (2020) 8892-8902. DOI:10.1039/D0TA00212G |
| [52] |
L. Shen, X. Zheng, G. Lei, et al., Chem. Eng. J. 346 (2018) 238-248. DOI:10.1016/j.cej.2018.03.157 |
| [53] |
M.V. Vaishampayan, R.G. Deshmukh, P. Walke, I. Mulla, Mater. Chem. Phys. 109 (2008) 230-234. DOI:10.1016/j.matchemphys.2007.11.024 |
| [54] |
X. Zheng, Y. Li, S. Liang, et al., J. Catal. 389 (2020) 382-399. DOI:10.1016/j.jcat.2020.06.010 |