 2021, Vol. 32


b Department of Chemistry, Shanghai Key Lab of Molecular Catalysis and Innovative Materials iChEM, Fudan University, Shanghai 200433, China;
c School of Chemical Engineering and Graduate School of Biomedical Engineering, The University of New South Wales, NSW 2052, Australia;
d Department of Chemical Engineering, University of Waterloo, Waterloo, Ontario N2L 3G1, Canada
Water pollution has been perplexing people for a long time. A large number of dyeing wastewater has been discharged into the environment with the rising of textile, printing and chemical industries which could cause serious damages to human health and ecological environment due to its high concentration, difficult degradation and high toxicity [1-3]. Precipitation [4], filtration [5], oxidation [6] and microbial [7] methods are used to remove dyes from water in common with the expense of high cost, low efficiency and high operational difficulty [8]. Adsorption method has become one of the widely used methods because of its low cost, high efficiency and simple operation [9]. Although the traditional adsorbents such as clay [10], activated alumina [11], bentonite [12], zeolite [13] and charcoal [14] have good adsorption properties for dyes in water, they also have the disadvantages of short effective life, difficulty in regeneration and large consumption, therefore it is necessary to develop new adsorbents with high practicability.
Cellulose is one of the most abundant natural renewable polymers on the earth, which exists widely in wood, cotton, cotton linters, wheat straw, straw, reeds, mulberry and so on [15, 16]. Fabrication of cellulose aerogels (CAs) is a common application route of this resources as the CAs are low cost, non-toxic and biocompatible [17]. In recent years, cellulose nanofibers (CNFs) aerogels have been developed and utilized in flame-retardant, oil-water separation and flexible film electrode [18, 19]. Besides the above applications, the utilization of CNFs aerogel in the field of adsorption also had positive prospects [20]. For example, Wang et al. [21] used 2, 2, 6, 6-tetramethyl-1-piperidinyloxy (TEMPO)-oxidized cellulose nanofibers (TOCN) to successfully prepared aerogels with a high adsorption capacity to organic solvents. Kim and coworkers [22] prepared CNFs aerogel through the cross-linking between maleic acid and sodium hypophosphite, displaying good maximum ion adsorption capacity for the nickel cation (0.79 mmol L−1g−1). Li's group [23] fabricated CNFs and TiO2 based aerogels, which showed an efficient adsorption capacity for methylene blue (MB). However, the CNFs aerogels still have the limitations of poor mechanical properties, fragile nature and high cost. In recent years, montmorillonite K10 (M-K10), a modified montmorillonite belongs to clay, has gained more and more interest in adsorption of pollutants from water owing to the outstanding characteristics such as inexpensive, high yield, non-corrosive [24-26].
Here, we report a simple and efficient technique to fabricate an aerogel with high mechanical strength by super-assembly [27-29] of TOCN, PVA and M-K10. To assess the mechanical property and adsorption efficiency of the prepared TOCN/PVA/M-K10 aerogel (TPMA), the compression property and the effect of adsorbent dosage, solution pH, inorganic salts and contacting time on MB adsorption capability were systematically tested. The results indicated that the TPMA exhibited excellent mechanical performance and high adsorption capacity. Moreover, the adsorption kinetics and adsorption isotherms were used to study the adsorption mechanism of TPMA. Finally tested the regeneration and reuse property of TPMA.
In this work, the softwood kraft pulp was provided by Northwood Pulp and Timber Co., Ltd. The 2, 2, 6, 6-tetramethylpiperidyl-1-oxyl (TEMPO) was purchased from Sigma-Aldrich. Sodium hypochlorite solution (NaClO, 6%–14%), phosphoric acid (H3PO4, 85 wt%) and methylene blue (MB) were received from Aladdin Industrial Corporation. Polyvinyl alcohol (PVA, Mw=88000), citric acid (CA, C6H8O7) and Montmorillonite K-10 (M-K10) were supplied by Macklin Industrial Corporation. Sodium bromide (NaBr), hydrochloric acid (HCl) and sodium hydroxide (NaOH) were obtained from Sinopharm Chemical Reagent Co., Ltd. Ultrapure water (resistivity: 18.2MΩ/cm) was used to prepare aqueous solutions. All reagents were used as received without further purification.
The TEMPO-oxide CNF (TOCN) were prepared from softwood kraft pulp which were oxidized by TEMPO-NaClO-NaBr oxidation system. The details were described as follows [30]. Softwood kraft pulp (1 g), TEMPO (0.0016 g) and NaBr (0.1 g) were added to water (100 mL) under stirring 25 ℃. Then the NaClO solution (5.0 mmol/L) was added slowly with stirring. After using HCl solution (0.5 mol/L) to adjusted the pH of solution, the NaOH solution (0.5 mol/L) was continuously added to maintain the pH at 10 until the oxidation reaction was finished. Subsequently the sample was filtered and washed several times with deionized water, and the unmixed sample was homogenized at 100MPa for 5 cycles by a high-pressure homogenizer (APV-2000) and the TOCN suspensions were obtained. The carboxylate content of the TOCN was detected as 0.052 mmol/g by an electric conductivity titration process.
To prepare the TOCN/PVA/M-K10 aerogel (TPMA), PVA (0.5 g) was added to the TOCN suspensions (0.5 wt%, 100 mL) with the constantly stirring at 95 ℃ for 2 h. Then H3PO4 (1 mL), C6H8O7 (1 g) and M-K10 (0.025 g) were added to the mixed solution with high speed stirring for 30 min. Thereafter, the sample was frozen at −64 ℃ for 2 h in ultra-low temperature freezer. The frozen sample was freeze-dried for 48 h to obtain an aerogel, then placed in room temperature for 12 h. Eventually, the TPMA was obtained by heating at 40 ℃ for 20 min in a dryer until completed its esterification crosslinking. As a control, TOCN aerogel (TA) was prepared by directly freeze-dried TOCN suspensions (0.5 wt%) and TOCN/PVA aerogel (TPA) was prepared without M-K10 during the preparation of TPMA.
The characterization of the sample was as follows: transmission electron microscopy (TEM) measurements were performed on a Hitachi HF5000. Scanning electron microscopy (SEM) measurements were characterized on a Hitachi S4800 instrument operated at 2 kV for gold-sputtered samples. X-ray diffraction patterns (XRD) were recorded on a Bruker D8 ADVANCE X-ray diffractometer with a Cu Kα radiation at 36 kV and 20 mA. Powder was leveled on sample holders and scanned with a 2θ angle from 10° to 90° with a step speed of 5°/min. Fourier transform infrared spectroscopy (FTIR) measurements were conducted on a NICOLET 5700 Fourier transform infrared spectrometer with a range of 4000–500 cm−1. X-ray photoelectron spectroscopy (XPS) was obtained with an ESCALAB 250Xi X-ray photoelectron spectroscopy, using monochromatic Al Kα (1486.6 eV) radiation as the excitation source. Binding energy was charge corrected to 284.6 eV for C 1 s. The mechanical property of TPMA was examined using a TAXT PLUS texture analyzer at a speed of 100 mm/min.
In the adsorption experiments, 50 mL solutions contained MB at different concentrations were prepared, and then mixed with a certain amount of adsorbent in a 100 mL conical flask placed on a constant temperature shaker with a speed of 200 r/min until the system reached equilibrium at 25 ℃. A tiny amount of MB solution supernatant was taken when each time the adsorption experiments was ended, and the wavelength was measured at 664 nm by a UV–vis spectrophotometer to calculated the concentration of MB solution. According to the change of solution concentration before and after adsorption, the adsorption amount and MB removal rate when reached equilibrium were calculated by the following equations:

|
(1) |

|
(2) |
where Q is the adsorption capacity at equilibrium (mg/g); C0 and C are the concentration of MB solution before and after adsorption (mg/L); V is the volume of MB solution (L); m is the weight of adsorbent (g); R is the adsorption efficiency of MB (%).
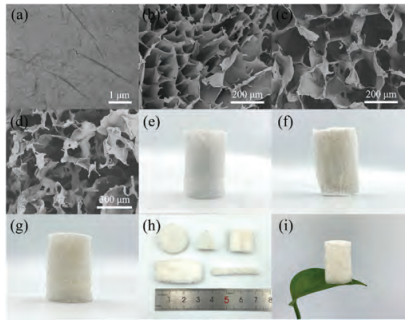
The illustration of the synthetic routes employed for the preparation of TPMA is shown in Fig. S1 (Supporting information). As shown in Fig. 1a, TEMPO-oxide cellulose nanofibers were dispersed into strips with averaging 3−5 nm of diameter and 200 nm of length. SEM micrographs of the structure of the TA, TPA and TPMA are shown in Figs. 1b–d. The SEM image (Fig. 1b) shows the network structure of TA with pore sizes of tens of micrometers to hundreds of micrometers [30]. The TPA and TPMA have obvious smaller pore sizes than TA (Figs. 1c and d) because of the partial melting of PVA in the aerogel during heating esterification. The morphology of TA, TPA and TPMA are shown in Figs. 1e–g, compared with TPA and TPMA, TA has a smoother surface with pure CNF aerogel. Fig. 1x reveals the photograph of TA, where TA has a brittle structure with white color and smooth surface. Figs. 1f and g show the photograph of TPA and TPMA. Both TPA and TPMA have a rough surface with soft and elastic structure and the surface of TPMA was slightly yellowish because of the addition of M-K10. In addition, TPMA can be designed into various shapes, such as circular, triangle, square, rectangle and long strip by using different molds in freeze drying which can made the TPMA to adapted different situations (Fig. 1h). Moreover, TPMA has a low density (19.32 mg/cm3), and it can be stably placed on a leaf (Fig. 1i).

|
Download:
|
| Fig. 1. (a) TEM image of TOCN. (b-d) SEM images of TA, TPA and TPMA, respectively. (e-g) Morphology of TA, TPA and TPMA, respectively. (h) TPMA with various shapes. (i) TPMA stand on the top of the leaf in a steady way. | |
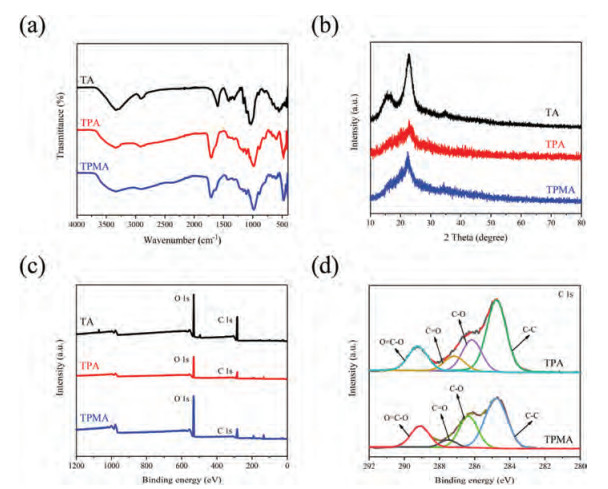
The chemical composition and other physical properties of obtained aerogels were also characterized by FTIR.Fig. 2a shows characteristic peaks of TA, TPA and TPMA in the FTIR spectra. For example, FTIR spectra of TA showing characteristic peaks at 3289, 2903, 1404, 1125, 1050 and 900 cm−1 are regarded as the typical cellulose peaks [20]. For TPA, the O-H stretching vibration at 3318 cm−1 and C-H tensile vibration at 2921 cm−1were observed [31]. The 1710 cm−1 ester carbonyl peak indicates that an esterification reaction took place between hydroxyl groups on nanocellulose and carboxyl groups of CA to produce carboxyl (-COOH) on the surface of CNF [32]. For TPMA, silica-oxygen tetrahedrons (Si-O-Si) stretching vibration at 981 cm−1 and the Al-O vibration at 800 cm−1 were observed. The bands at 625 and 480 cm−1 were corresponded to Si-O-Si and Al-O-Si vibrations, respectively [33].

|
Download:
|
| Fig. 2. (a) FTIR spectra, (b) XRD patterns, (c) XPS survey spectra, (d) C 1 s spectra of TPA and TPMA. | |
XRD patterns were used to analyze the crystal structure of the aerogels [34].Fig. 2b depicts the XRD patterns of TA, TPA and TPMA. All the TA, TPA and TPMA have a peak at 2θ=21.87° which could be ascribed to the characteristic peak of cellulose [16]. TA also have a peak at 2θ=16.89° which could be assigned as the characteristic peak of cellulose. The reason why TPA and TPMA do not have this peak may be that the reaction of cellulose, PVA and CA produces ester bonds and partial hydrogen bonds, which leads to the disappearance of the cellulose peaks. Besides, the addition of M-K10 enhanced the crystallinity of TPMA which reflected that the TPMA have more stronger diffraction intensity than TPA.
The surface chemical composition of the aerogels was also determined by XPS analysis. The C 1 s (284.8 eV) and O 1 s (532.0 eV) can be observed in the survey scan of the XPS (Fig. 2c) [35]. From the C 1 s spectra of TPA and TPMA (Fig. 2d), the C 1s spectra of TPA and TPMA could be split to four parts, corresponding to C-C, C-O, C=O and O=C-O parts [31].
The compression and fatigue resistance of the material are demonstrated by stress-strain measurements. As shown in Fig. 3a, after releasing the stress, TPMA quickly returned to its initial height which shown the better mechanical properties than traditional nanocellulose aerogel (TA) in Fig. S2 (Supporting information). The stress-strain curves of TPMA at the strain of 20%, 40%, 60% and 80% were presented in Fig. 3b. It can be clearly seen that the cyclic compressive loading-unloading cycles with strains up to 80% show that the stress-strain curve was divided into three typical regions: an elastic region (ε < 10%) with barely change in stress, a following yield region (10% < ε < 60%) with slightly increasing stress, and the densification region (ε > 60%) with steeply increasing stress [36]. In addition, the stress-strain curve of TPMA at the strain of 80% is very smooth because of the great compression property of TPMA, which shown that TPMA is very soft and has no collapse during compression. As revealed in Figs. 3c and d, the stress-strain behaviors of TPMA were tested after 1, 10, 50 and 100 cycles at 60% strain. After 50 cycles of compression at 60% strain, the TPMA showed a little deformation of about 6%, and the maximum compression stress at the 50th cycle only decreased by 19.5% of the first cycle. Even after 100 cycles of compression at 60% strain, the TPMA could maintain 93% of its original height, and the maximum compression stress at the 100 th cycle was retained at 78% of the first cycle, proving the excellent mechanical stability and fatigue resistance property. More interestingly, the maximum compressive stresses of TPMA were about 9.5 kPa under 60% strain (43.58 kPa under 80% strain) and its density was only 19.32 mg/cm3. Then the TPMA could completely recover to its initial shape and size after being compressed by a 1000 g weight (Fig. 3e), which demonstrated that the TPMA could bear a large pressure force of about 3.3×10³ times higher than its self-weight. Fig. S3 (Supporting information) also shows that TPMA has great compressibility and shape recovery ability underwater. It is further expounded an extraordinarily compressive property of TPMA which contributed from the high-strength skeleton between PVA and CNF [37].

|
Download:
|
| Fig. 3. (a) The compression and releasing process of TPMA at 60% strain. (b) The stress-strain curves of TPMA at the strain of 20%, 40%, 60% and 80%. (c) The stress-strain curves of TPMA at the maximum strain of 60% after 1, 10, 50 and 100 cycles. (d) Shape recovery ratio of TPMA at the maximum strain of 60% after 1, 10, 50 and 100 cycles. (e) Pictures exhibiting the compression and full shape recovery process of TPMA. | |
The concentration standard curve of MB solution, effect of adsorbent dosage on adsorption capacity, efficiency of MB in water, effect of solution pH value on adsorption capacity and effect of inorganic salts on adsorption capacity of TPMA are shown in Figs. S4–S7 (Supporting information). It can be seen from the Fig. 4a that 0–40 min was the rapid adsorption stage. In the rapid adsorption phase, the amount of MB were adsorbed by the aerogel increases with time. At the same time, the increase in the initial concentration of MB in the solution leads to an increase in the adsorption rate. This is because there is a higher dye concentration difference between the aerogel and the solution, which makes MB easier to be adsorbed. After the rapid adsorption stage, the adsorption sites on the aerogel have been occupied by MB, resulting in insufficient remaining adsorption sites, and the adsorption rate is significantly slowed down. In the 120−300 min stage, there is almost no change in the adsorption capacity. At 120 min, the adsorption has reached an equilibrium state. Fig. S8 (Supporting information) shows the photos after adsorption with different aerogels when the concentration of MB was 20 mg/L. The adsorption capacity of TA shows in Fig. S9 (Supporting information).

|
Download:
|
| Fig. 4. (a) Effect of contacting time on the adsorption of MB. (b) FTIR spectra. (c) Proposed adsorption mechanisms. | |
The pseudo-first-order and pseudo-second-order kinetic models were important models commonly used to infer the rate constant and equilibrium adsorption capacity of the adsorption process, as well as the reaction adsorption mechanism [38, 39].
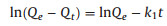
Pseudo-first-order:
|
(3) |
Where Q and Q respectively represent the adsorption equilibrium and the adsorption amount of the dye on the aerogel at time t (mg/g); k1 is the rate constant of the pseudo-first-order (min−1). Use t as the abscissa and ln (Q − Q) as the ordinate to draw the graph. k1 and Q can be calculated by the slope and intercept of the fitted straight line.
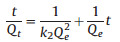
Pseudo-second-order:
|
(4) |
Where k2 is the rate constant of the pseudo-second-order (g mg−1min−1). Use t as the abscissa and t/Q as the ordinate to draw the graph. The slope and intercept of the straight line can be calculated as k2 and Q respectively. The results are shown in Figs. S10 and S11 (Supporting information), and the relevant kinetic parameters are shown in Tables S1 and S2 (Supporting information).
According to the correlation coefficients (R2) in Figs. S10 and S11 and Tables S1 and S2, when the initial mass concentration of MB is 10 mg/L and 20 mg/L, the complex correlation coefficients (R2 > 0.99) obtained by pseudo-second-order kinetic model fitting is higher than the pseudo-first-order kinetic model (R2: 0.892−0.928), and the difference between the equilibrium adsorption capacity Q obtained by fitting and the measured value of adsorption experiment is smaller. It can be concluded that the pseudo-second-order kinetic model was more suitable for explaining the adsorption process and mechanism of MB on TPMA.
The adsorption isotherm is a commonly used relationship curve for studying the equilibrium mechanism between adsorbent and adsorbate under certain temperature conditions. The Langmuir isotherm model is based on the assumption that adsorption occurs on homogeneous surface which belongs to mono-layer adsorption. The Freundlich isotherm model is based on the assumption that adsorption occurs on heterogeneous surface which belongs to multi-layer adsorption. Langmuir isotherm model and Freundlich isotherm model are two commonly used adsorption isotherms [40, 41]. The linear forms of these isotherms are given by the following equations:
Langmuir isotherm:
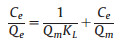
|
(5) |
Where C is the equilibrium concentration of MB in aqueous solution (mg/L), Q is the adsorption capacity at equilibrium (mg/g), Q is the maximum adsorption capacity (mg/g), and K is the Langmuir constant (L/mg). Taking C as abscissa and C/Q as ordinate, Q and K can be calculated respectively by the slope and intercept of the fitted line.
Freundlich isotherm:
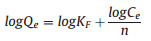
|
(6) |
Where K is the Freundlich constant related to the adsorption capacity (mg/g), and n is the parameter related to the adsorption strength. Taking logC as abscissa and logQ as ordinate, K and n can be calculated respectively by the slope and intercept of the fitted line. The Langmuir model and Freundlich model were used to fit the experimental data to explore the way of interaction between TPMA and MB. The result of fitting is shown in Figs. S12 and S13 (Supporting information), and the correlation coefficient is shown in Tables S3 and S4 (Supporting information).
For TPMA, Freundlich isotherm model (R2=0.908) could better describe the adsorption of MB on TPMA than Langmuir isotherm model (R2=0.847), meaning that the adsorbent surface was heterogeneous and the adsorption energy of each point was different with multi-layer adsorption. In addition, the value calculated from Freundlich isotherm model (1/n < 1) which indicated that the TPMA adsorption of MB was favorable.
In order to illustrate the adsorption mechanism of TPMA, the SEM image of MB-loaded TPMA and FTIR spectra were studied. The SEM image of MB-loaded TPMA was shown in Fig. S14 (Supporting information). The FTIR spectra of MB-loaded TPMA in Fig. 4b shows structural changes in the TPMA after MB adsorption. The absorption peak of TPMA at 1710 cm−1 corresponding to -COO- stretching was slightly shifted to 1714 cm−1, indicating the negatively charged carboxyl groups of TPMA played a role in the adsorption of MB through electrostatic interaction. The band at 3318 cm−1 of TPMA belonged to O-H was shifted to 3328 cm−1, implying additional adsorption mechanisms including hydrogen bond was involved in MB adsorption. Moreover, the presence of new peak at 1316 cm−1, which corresponds to the symmetric deformation of -CH3 in MB. These results strongly confirmed the successful adsorption of MB onto TPMA. The SEM and FTIR analysis confirm that the MB adsorption occurs possibly through electrostatic attraction and hydrogen bond as depicted in Fig. 4c. Moreover, the regeneration and reuse property of the TPMA has also been tested, as shown in Fig. S15 (Supporting information).
In conclusion, an originally robust TPMA was fabricated through PVA, M-K10 and harmless TOCN by a convenient super-assembly method which could use as an efficiency adsorbent for the removal of MB in water. The results showed that after cycle 100 times under 60% strain, the TPMA still has excellent shape recovery at 93% which declares its great mechanical property. The pseudo-second-order kinetic model fitted better than pseudo-first-order kinetic model to describe the adsorption process of the MB on TPMA. The Freundlich isotherm is confirmed as a more suitable model to describe the adsorption equilibrium of TPMA than Langmuir isotherm model. Thus, such a compressible and durable TPMA is a very prospective material for MB cleanup and industrial wastewater purification.
Declaration of competing interestThe authors declare that they have no known competing financial interests or personal relationships that could have appeared to influence the work reported in this paper.
AcknowledgmentsThis work was supported by the National Key Research and Development Program of China (Nos. 2019YFC1604601, 2019YFC1604600, 2017YFA0206901, 2017YFA0206900, 2018YFC1602301), the National Natural Science Foundation of China (Nos. 21705027, 21974029), the Natural Science Foundation of Shanghai (No. 18ZR1404700), and Construction Project of Shanghai Key Laboratory of Molecular Imaging (No. 18DZ2260400), Shanghai Municipal Education Commission (Class II Plateau Disciplinary Construction Program of Medical Technology of SUMHS, 2018-2020); National Natural Science Foundation of China Found (No. 51703109) and the Major Scientific and Technological Innovation Project of Shandong (No. 2018CXGC1406).
Appendix A. Supplementary dataSupplementary material related to this article can be found, in the online version, at doi:https://doi.org/10.1016/j.cclet.2021.03.024.
| [1] |
M.C. Collivignarelli, A. Abba, M. Carnevale Miino, et al., J. Environ. Manage. 236 (2019) 727-745. DOI:10.1016/j.jenvman.2018.11.094 |
| [2] |
V.K. Gupta, J. Suhas, Environ. Manage. 90 (2009) 2313-2342. |
| [3] |
D.A. Yaseen, M. Scholz, Int. J. Environ. Sci. Technol. 16 (2018) 1193-1226. |
| [4] |
C. Shen, Y. Pan, D. Wu, et al., Chem. Eng. J. 374 (2019) 904-913. DOI:10.1016/j.cej.2019.05.203 |
| [5] |
J. Li, J.L. Gong, G.M. Zeng, et al., Chemosphere 237 (2019) 124517. DOI:10.1016/j.chemosphere.2019.124517 |
| [6] |
P.V. Nidheesh, M. Zhou, M.A. Oturan, Chemosphere 197 (2018) 210-227. DOI:10.1016/j.chemosphere.2017.12.195 |
| [7] |
Z.B. Bouabidi, M.H. El-Naas, Z. Zhang, Environ. Chem. Lett. 17 (2018) 241-257. |
| [8] |
K. Piaskowski, R. Swiderska-Dabrowska, P.K. Zarzycki, J. AOAC Int. 101 (2018) 1371-1384. DOI:10.5740/jaoacint.18-0051 |
| [9] |
S. Dawood, T.K. Sen, C. Phan, Environ. Technol. 40 (2019) 3762-3772. DOI:10.1080/09593330.2018.1491065 |
| [10] |
A. Kausar, M. Iqbal, A. Javed, et al., J. Mol. Liquid 256 (2018) 395-407. DOI:10.1016/j.molliq.2018.02.034 |
| [11] |
S.M. Safwat, M.E. Matta, J. Dispersion Sci. Technol. 39 (2018) 1699-1709. DOI:10.1080/01932691.2018.1461644 |
| [12] |
D. Shen, J. Fan, W. Zhou, et al., J. Hazard. Mater. 172 (2009) 99-107. DOI:10.1016/j.jhazmat.2009.06.139 |
| [13] |
J. Vahid, S.M. Ghoreishi, M. Javanbakht, Theor. Found. Chem. Eng. 53 (2019) 1057-1066. DOI:10.1134/S0040579519060046 |
| [14] |
H. Patel, Separation Sci. Technol. 53 (2018) 2797-2812. DOI:10.1080/01496395.2018.1473880 |
| [15] |
R.J. Moon, A. Martini, J. Nairn, et al., Chem. Soc. Rev. 40 (2011) 3941-3994. DOI:10.1039/c0cs00108b |
| [16] |
J. Cai, S. Kimura, M. Wada, et al., ChemSusChem 1 (2008) 149-154. DOI:10.1002/cssc.200700039 |
| [17] |
Y. Li, C. Guo, R. Shi, et al., Carbohydr. Polym. 223 (2019) 115048. DOI:10.1016/j.carbpol.2019.115048 |
| [18] |
T. Abitbol, A. Rivkin, Y. Cao, et al., Curr. Opin. Biotechnol. 39 (2016) 76-88. DOI:10.1016/j.copbio.2016.01.002 |
| [19] |
B. Thomas, M.C. Raj, A.K. B, et al., Chem. Rev. 118 (2018) 11575-11625. DOI:10.1021/acs.chemrev.7b00627 |
| [20] |
R.M.Y. Saeed, Z. Bano, J. Sun, et al., J. Appl. Polym. Sci. 136 (2019) 47404. DOI:10.1002/app.47404 |
| [21] |
M. Wang, C. Shao, S. Zhou, et al., RSC Adv. 7 (2017) 38220-38230. DOI:10.1039/C7RA05506D |
| [22] |
C.H. Kim, H.J. Youn, H.L. Lee, Cellulose 24 (2017) 2895-2902. DOI:10.1007/s10570-017-1321-y |
| [23] |
S. Li, X. Hao, X. Dai, et al., J. Nanomater. 2018 (2018) 1-12. |
| [24] |
C.S. Rani, N. Suresh, M.V.B. Rao, et al., Arab. J. Chem. 12 (2019) 3911-3920. DOI:10.1016/j.arabjc.2016.02.014 |
| [25] |
A. Mattar Knesebeck, R.W.P. Ortiz, F. Wypych, et al., Ind. Eng. Chem. Res. 58 (2019) 9257-9265. DOI:10.1021/acs.iecr.9b00583 |
| [26] |
S. Bonacci, G. Iriti, S. Mancuso, et al., Catalysts 10 (2020) 845. DOI:10.3390/catal10080845 |
| [27] |
B. Yang, S. Zhou, J. Zeng, et al., Nano Res. 13 (2020) 1013-1019. DOI:10.1007/s12274-020-2736-6 |
| [28] |
Y. Hou, J. Wang, J. Liu, et al., Adv. Energy Mater. 9 (2019) 1901751. DOI:10.1002/aenm.201901751 |
| [29] |
R. Zhang, Y. Li, L. Qiao, et al., Energy Storage Mater. 37 (2021) 123-134. DOI:10.1016/j.ensm.2021.01.028 |
| [30] |
A. Isogai, T. Saito, H. Fukuzumi, Nanoscale 3 (2011) 71-85. DOI:10.1039/C0NR00583E |
| [31] |
X. Liu, Y. Zhou, W. Nie, et al., J. Mater. Sci. 50 (2015) 6113-6123. DOI:10.1007/s10853-015-9166-y |
| [32] |
D. Wang, H. Yu, X. Fan, et al., ACS Appl. Mater. Interfaces 10 (2018) 20755-20766. DOI:10.1021/acsami.8b04211 |
| [33] |
R. Cui, S. Ma, J. Wang, et al., Chemosphere 234 (2019) 302-309. DOI:10.1016/j.chemosphere.2019.06.029 |
| [34] |
M.A. Fauziyah, W. Widiyastuti, R. Balgis, et al., Cellulose 26 (2019) 9583-9598. DOI:10.1007/s10570-019-02753-x |
| [35] |
M. Wang, Y. Chen, Y. Qin, et al., ACS Sustain. Chem. Eng. 7 (2019) 12726-12733. DOI:10.1021/acssuschemeng.9b00814 |
| [36] |
Q. Fu, Y. Si, C. Duan, et al., Adv. Funct. Mater. 29 (2019) 1808234. DOI:10.1002/adfm.201808234 |
| [37] |
F. Qian, P.C. Lan, M.C. Freyman, et al., Nano Lett. 17 (2017) 7171-7176. DOI:10.1021/acs.nanolett.7b02790 |
| [38] |
X. Zhang, Y. Yang, X. Lv, et al., J. Hazard. Mater. 366 (2019) 140-150. DOI:10.1016/j.jhazmat.2018.11.099 |
| [39] |
L. Aljerf, J. Environ. Manage. 225 (2018) 120-132. DOI:10.1016/j.jenvman.2018.07.048 |
| [40] |
Q.S. Liu, T. Zheng, P. Wang, et al., Chem. Eng. J. 157 (2010) 348-356. DOI:10.1016/j.cej.2009.11.013 |
| [41] |
P. Senthil Kumar, S. Ramalingam, C. Senthamarai, et al., Desalination 261 (2010) 52-60. DOI:10.1016/j.desal.2010.05.032 |