 2021, Vol. 32


b Hunan Provincial Key Lab of Dark Tea and Jin-Hua, School of Materials and Chemical Engineering, Hunan City University, Yiyang 413000, China;
c Hunan Key Laboratory of Biomedical Nanomaterials and Devices, Hunan University of Technology, Zhuzhou 412007, China
Carbaryl is a class of carbamate pesticides that has been widely used in agriculture due to its high effectiveness for insect eradication and low price. However, the extensive use of carbaryl pesticides in agriculture could lead to their accumulation in vegetables, fruits or water, which will further have the risk to both human health and environment [1, 2]. The carbaryl is a neurotoxin, which can inhibit acetylcholinesterase (AChE) inhibition and makes acetylcholine accumulate in tissues [3, 4]. Therefore, developing a reliable, sensitive, and convenient approach for carbaryl detection is of great significance not only in environment studies but also in food studies and agriculture.
So far, numerous detection methods have been developed for analysis of carbaryl in food and environmental samples. One is traditional instrumental analysis such as liquid chromatography-tandem mass spectrometry (LC–MS/MS) [5], high performance liquid chromatography (HPLC) [6], HPLC coupled with mass spectrometry (HPLC–MS) [7], and gas chromatography-mass spectrometry (GC–MS) [8]. Even these instrumental methods are sensitive and reliable but their expensive equipment and professional operators restrict the on-site rapid detection of carbaryl. Besides, based on the principle of specific enzyme activity inhibition, the AChE biosensors have been a hot research field in biosensor technology for rapid pesticide detection [9-11]. However, these AChE biosensors always involved other materials, such as quantum-dot [12], sol-gel [13], membrane [14] and nanomaterials [15-18] to improve the detecting sensitive, which make these biosensors complicated to prepare.
Aptamers, a class of single strand nucleic acids, are selected by systematic evolution of ligands by exponential enrichment (SELEX) [19, 20], which present high specificity [21, 22] and affinity [23] towards their respective target ions or molecules [24-27], as well as many advantages over traditional recognition molecules, such as nontoxicity, lack of immunogenicity, and ease of synthesis and modification. At the same time, aptasensors have been employed to overcome the limitations of the above-mentioned methods owing to their excellent specificity and sensitivity, and have been recently employed to detect small molecules [28-30]. Several studies have proposed aptamer biosensors for pesticide detection [31], such as fluorescent aptasenor for malathion [32] and acetamiprid [33], colorimetric aptasensor for acetamiprid [34], electrochemical aptasensor for chlorpyrifos [35]. Nevertheless, the apatsensor for carbaryl has not been reported.
In this article, we selected a specific aptamer for carbaryl using ssDNA library immobilized SELEX and developed a sensitive fluorescence aptasensor. The SELEX process and detection mechanism were shown in Fig. 1A. After nine rounds of SELEX, the strong binding aptamer to carbaryl was obtained. The binding properties of the selected aptamer to carbaryl were characterized. Besides, an aptamer-based turn-on fluorescence biosensor (Fig. 1B) was established to demonstrate the potential use of the selected aptamer to carbaryl capture and detection in aqueous solution and real samples.

|
Download:
|
| Fig. 1. Schematic illustration of (A) the SELEX process and (B) the fabricated aptasensor for carbaryl detection. | |
Carbaryl was purchased from Aladdin (Shanghai, China). DNA denaturing PAGE kit, emulsion polymerase chain reaction (E-PCR) microdroplet generation oil, and 2×TBE-urea loading buffer were purchased from Anhui Aptamy Biotechnology Co., Ltd. (Hefei, China), DynabeadsTM MyOneTM Streptavidin C1 were purchased from Thermo Fisher Scientific Ltd. (Shanghai, China). DNA Marker and TBE buffer were purchased from Sangon Biotechnology (Shanghai, China), and all of the oligonucleotides (Table S1 in Supporting information), including the initial ssDNA library, the binding primer P1, the forward primer P2, the reverse primer P3, the FAM labelled P2, the poly A labelled P3, the selected and truncated aptamers were synthesized and HPLC-purified by Sangon Biotechnology (Shanghai, China). Polymerase chain reaction (PCR) mix and quantitative real-time polymerase chain reaction (Q-PCR) mix were purchased from Nanjing Vazyme Biotechnology Co., Ltd. (China). Other reagents were obtained from Sinopharm Chemical Reagent Co., Ltd. (Shanghai, China). All reagents were of analytical grade and were used without further purification. Solutions were prepared with doubly distilled (DI) water (18 MΩcm).
Gel electrophoresis was performed in a PowerPac Basic Power Supply from Beijing Liuyi Biotechnology Co., Ltd. (China). PCR amplification was carried out in a T100 Thermal cycler (Bio-Rad, USA), Q-PCR experiments were conducted on StepOnePlusTM Real-Time PCR System (Thermo Fisher Scientific, USA). The amount of separated ssDNA was measured by OneDrop OD-1000 spectrophotometer (Nanjing, China). A LabSolutions RF-6000 fluorescence spectrometer (Shimadzu, Japan) was used to record the fluorescence intensity, with an excited slit and emission slit of 5.0 nm.
Briefly, each round of carbaryl SELEX selection including the procedure of ssDNA library immobilization, carbaryl incubation and separation of specific ssDNA, asymmetric emulsion polymerase chain reaction (E-PCR) amplification of ssDNA, polyacrylamide gel electrophoresis and ssDNA recovery.
The initial ssDNA library with 1300 pmol was hybridized with the biotin labelled strand P1 with the molar ration of 1:2 in DPBS (Dulbeccos Phosphate-Buffered) binding buffer (NaCl 136.89 mmol/L; KCl 2.67 mmol/L; Na2HPO4 8.10 mmol/L; KH2PO4 1.47 mmol/L; CaCl2 0.90 mmol/L; MgCl2 0.49 mmol/L, pH 7.4). The mixture annealed under following procedure: 95 ℃ for 10 min, 60 ℃ for 1 min, and 25 ℃ for 10 min. The streptavidin magnetic beads (SA-MNPs) were washed 4 times with DPBS binding buffer, and incubated with the above the mixture for 50 min, then the suspension solution was collected, the library binding efficiency was given by testing initial ssDNA library and suspension solution after incubated with P1. Later the ssDNA coated SA-MNPs were washed 4 times with DPBS binding buffer to remove the unbound and weakly bound DNAs, each eluent was collected and marked as Wn (n means washing time, n=1, 2, 3, 4) respectively. The trapped beads then incubated with 100 μmol/L carbaryl (containing 2% methyl alcohol) in 100 μL DPBS binding buffer for 50 min. After incubation, the elution of containing carbaryl-bound sequences was collected through magnetic separation. All of the detailed experimental conditions were listed in Table 1. The negative selection was added from the second selection by incubating with 100 μL DPBS binding buffer (including 2% n-butyl alcohol) before incubated with carbaryl to improve the selectivity of aptamers to carbaryl. All the incubated condition was at room temperature.
|
|
Table 1 The conditions for carbaryl aptamer selection. |

To monitor the screening efficiency, the collected eluents were Q-PCR amplified to calculate the retention rate [36]. 20 μL Q-PCR mixture containing: 2 μL template, 0.4 μL P2 (10 μmol/L), 0.4 μL P3 (10 μmol/L), 10 μL qPCR-mix, 7.2 μL ultrapure water. Then the Q-PCR reaction was carried out as follows: It denatured at 95 ℃ for 3 min, followed by 35 cycles of denaturation at 95 ℃ for 10 s, annealing at 60 ℃ for 30 s, and extension at 72 ℃ for 30 s. Then, the Ct value was analyzed. Besides, the eluents were PCR-amplified and checked by 5% agarose gel electrophoresis. The PCR mixture and procedure was the same with Q-PCR except using PCR-mix, then extended at 72 ℃ for 5 min, cooled at 4 ℃.
Since E-PCR has the advantages of reduce PCR bias and the formation of by-products to a non-detectable level [37], the rest of the ssDNA elution was E-PCR amplified to obtain secondary ssDNA library. The E-PCR mixture containing: 90 μL template, 1 mL 2 ×PCR mix, 10 μL P2-FAM (100 μmol/L), 10 μL P3-polyA (100 μmol/L), with ultrapure water added to make a final volume of 2 mL, then 8 mL of E-PCR microdroplet generation oil was added. The mixture was vertical vibrated for 5 min to make sure the mixture was emulsified thoroughly. The E-PCR performed under following procedure: 95 ℃ for 3 min, followed by 25 cycles of 95 ℃ for 60 s, 60 ℃ for 60 s, 72 ℃ for 60 s, then extended at 72 ℃ for 5 min. After that, the E-PCR product was collected and concentrated with n-butyl alcohol to reduce the volume to 100 μL and further mixed with equal volume of 2 ×TBE-urea loading buffer. To get better quality of ssDNA, 8% PAGE was carried out after the mixture was boiled for 10 min. The separated ssDNA library with fluorescence was cut off, further concentrated and purified. The concentration of purified ssDNA library was quantified by OneDrop OD-1000 spectrophotometer for the next selection round.
After nine rounds of selection, the enriched ssDNA library was PCR amplified under the same condition described above except using unlabeled primers. About 30 clones were randomly picked and cultured, subsequently sequenced by Sangon Biotechnology (Shanghai, China). The homology and secondary structures of 30 sequences were performed using DNAMAN software and M-fold software (http://unafold.rna.albany.edu/?q=mfold/DNA-Folding-Form) respectively. All the aptamers labelled with 6-carboxy fluorescein (FAM) at 5′ end, further were immobilized onto SA-MNPs and then incubated with 100 μmol/L carbaryl. The retention rate of each aptamer was calculated through fluorescence intensity. The highly binding aptamer Apta3 was truncated and labelled with FAM at 5′ end, and a partially complementary strand was labeled with 4-[4-(dimethylamino) phenylazo] benzoic acid (Dabcyl) at 3' end for further assays.
The dissociation constant Kd of Apta3S was measured by monitoring the increase of the fluorescence intensity of FAM-Apta3S-Dabcyl complex after binding with different concentration of carbaryl. Firstly, the FAM-Apta3S (0.1 μmol/L) was mixed with the Dabcyl quenching strand (0.3 μmol/L). Then incubated with various concentrations of carbaryl (from 20 nmol/L to 20 μmol/L) in 100 μL of DPBS buffer at room temperature for 50 min, respectively. The fluorescence intensity was then plotted against the carbaryl concentration, and Kd can be determined by fitting the binding curve using the following equation: F = Fmax∙c/(Kd + c). Where F is the fluorescence intensity of Apta3S-Dabcyl complex after incubated with different concentration of carbaryl, c is the concentration of carbaryl, and the Kd was obtained by nonlinear fitting using the Origin v8.0.
Fluorescence spectra were obtained at room temperature by a LabSolutions RF-6000 fluorescence spectrometer (Shimadzu, Japan). 0.1 μmol/L of FAM-Apta3S was mixed with 0.3 μmol/L of Dabcyl quenching strand, and then incubated with 2.0 μmol/L of carbaryl in 100 μL of SELEX binding buffer, respectively. After incubation 50 min at room temperature, the solutions were excited at 485 nm, and the emission was monitored in the 500−650 nm wavelength range. The scan speed was 6000 nm/min. The increase of fluorescence was determined by comparing the intensity of the fluorescence emissions at 519 nm in the absence or presence of carbaryl.
The specificity of the selected and truncated Apta3S was determined with different analogues (aldicarb, isoprocarb, bendiocarb, methiocarb, 1-naphthol, carbosulfan, pirimicarb, carbofuran), respectively. The water samples were collected from Xuanwu Lake of Nanjing and tap water, which were filtered with a 0.24 μm membrane (Millipore) and further diluted 10 times using DPBS binding buffer containing different amounts of carbaryl standard solution to simulate carbaryl-contaminated water. Then the treated samples were analyzed using the above-fabricated aptasensor.
In this work, we selected aptamers for carbaryl based on ssDNA library immobilized to SA-MNPs. The selection principle is shown in Fig. 1A. The selection details of each round were shown in Table 1. The negative selection (2% n-butyl alcohol in DPBS binding buffer) was added to remove the solution preference. The eluents of DPBS buffer, negative selection and positive selection were collected and Q-PCR amplified to calculate the retention rate.
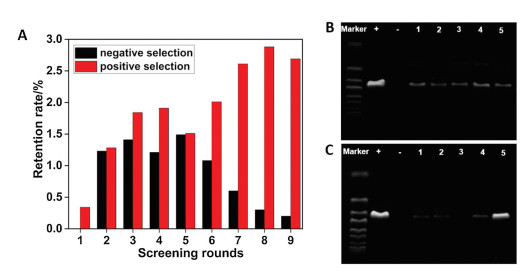
As shown in Fig. 2A, with the increase of selection pressure, such as increasing negative selection incubating time, reducing ssDNA library input and carbaryl incubating time, the retention rate of positive selection increases except the fifth selection round, which is due to the insufficient enrichment among the first four selection rounds and the decrease of ssDNA library input. Later on, the retention rate of positive selection reached to maximum at the eighth round. As we continued another round selection, the retention rate of positive selection was slightly decreased as well as the retention rate of negative selection, which means the selection reached saturation point. Therefore, the selection process was stopped at the ninth round. Besides, the eluents were PCR amplified and checked by 5% agarose gel electrophoresis. As shown in Fig. 2B, in the second round, all bands (the eluents of W1, W2, W5, negative solution and carbaryl solution respectively) were almost at the same intensity, which means the ssDNA library is not specifically binding to carbaryl. From Fig. 2C, we can found that the band of carbaryl eluent was deeply brighter than other bands, and the eluent of W5 and negative solution without intensity. Obviously, the ssDNA library is enriched significantly by carbaryl.

|
Download:
|
| Fig. 2. (A) The retention rate for each round of selection. The comparison of the elution profile by 5% agarose gel electrophoresis for the second (B) and ninth (C) selection round. The bands (1~3) stand for the samples eluted by SELEX buffer (W1, W2, W5). The bands (4) stand for the samples eluted by negative solution. The bands (5) stand for the samples eluted by carbaryl solution. | |
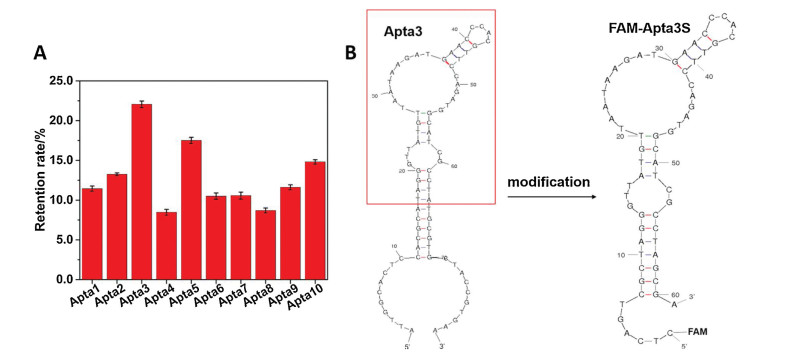
After nine rounds of selection, the ssDNA library was amplified and cloned, and 30 individual aptamers were sequenced. The thirty sequences were divided into ten families, which were shown in Table S2 (Supporting information). To analyse the sequences, 20 pmol FAM labelled aptamers were immobilized onto SA-MNPs according to SELEX procedure. The immobilized aptamers were further incubated with 100 μmol/L carbaryl, the eluted ssDNAs were quantified through fluorescence intensity, and further the retention rate of each aptamer was calculated. As shown in Fig. 3A, among ten aptamers, Apta3 has the highest retention rate, which indicating the Apta3 has the highest sensitivity towards carbaryl.

|
Download:
|
| Fig. 3. (A) The eluted ssDNA from different immobilized aptamer candidates incubated with 100 μmol/L carbaryl. (B) The second structure of Apta3 and the modified Apta3S. | |
In order to facilitate the modification of aptamer and fabricate a sensitive aptasensor, the Apta3 was truncated to 54 bases from the original 80 bases sequence based on its secondary structure, then the 5′ end was lengthened by 6 bases (CTCAGT) and further labelled with FAM. A quenching strand with 13 bases complemented with FAM-Apta3S was labelled with Dabcyl at 3' end (5'-CCTAGCGACTGAG-Dabcyl-3'). The second structure of Apta3 and the truncated Apta3S modified with FAM are shown in Fig. 3B. In addition, the Apta3S showed a low micromolar dissociation constant (Kd=0.364±0.055 μmol/L). Therefore, we transformed Apta3S into a probe and designed a fluorescent aptasensor to detect carbaryl.
In this part, we developed a turn-on fluorescent aptasensor. Fig. 1B is the principal for carbaryl detection. The Dabcyl quenching strand was applied to quench the fluorescence of FAM-Apta3S thus to reduce the background fluorescence via the principle of Watson-Crick base pairing. The presence of carbaryl could trigger Apta3S conformation change causing the FAM-Apta3S-quenching complex to free FAM-Apta3S, hence restoring the fluorescence of FAM, and the fluorescence intensity enhanced along with the increase in concentration of carbaryl.
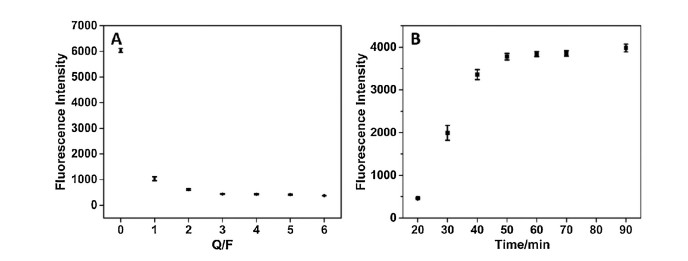
To fabricate a sensitive aptasensor, the concentration ratio between quenching strand and FAM-Apta3S (Q/F) and the incubation time was optimized. Firstly, 0.1 μmol/L of FAM-Apta3S was hybridized with different concentration of quenching strand (0.1 μmol/L to 0.6 μmol/L), respectively. As shown in Fig. 4A, the fluorescence intensity of FAM-Apta3S decreases along with the increase of its quenching strand. When the ratio increased to 3:1, the fluorescence intensity of FAM was almost quenched to minimum. Thus, the concentration ratio of 3:1 (Q/F) was selected for further experiments. Then, 2 μmol/L carbaryl was incubated with FAM-Apta3S-quenching complex in 100 μL DPBS binding buffer. The incubation time was studied from 20 min to 90 min.

|
Download:
|
| Fig. 4. The optimization of (A) the concentration ratio between quenching strand and FAM-Apta3S, and (B) the incubation time of FAM-Apta3S-quenching complex with 2 μmol/L carbaryl. | |
From Fig. 4B, we can see the fluorescence intensity of FAM was increased with the increase of incubation time at first 50 min, then almost stabilized after incubating for 50 min–70 min, and increased just a little after incubating for 90 min, indicating that the binding interaction between carbaryl and Apta3S basically reaches saturation at 50 min. So 50 min was selected as a reasonable incubation time.
Subsequently, the fluorescence enhancements of the FAM-Apta3S-quenching complexes after incubated with carbaryl were measured. As shown in Fig. 5A, the fluorescence intensity of FAM-Apta3S (black line) decreased 92.71% when mixing with quenching strand (green line) in a ratio of 1:3. In the presence of 2 μmol/L carbaryl in FAM-Apta3S-quenching strand complex, the fluorescence intensity is restored to 62.6% (blueviolet line) of initial fluorescence intensity of FAM-Apta3S (0.1 μmol/L), and the restored fluorescence intensity is 8.55 times than FAM-Apta3S-quenching strand complex, demonstrates the Apta3S could use to develop a fluorescent aptasensor. It should be noticed that the fluorescence intensity of FAM-Apta3S was decreased 2.52% in the presence of 2 μmol/L carbaryl (red line) alone.

|
Download:
|
| Fig. 5. (A) The Fluorescence intensity of FAM-Apta3S (black and red) and the FAM-Apta3S-quenching strand complex (blue and blueviolet) in the absence and presence of carbaryl (2 μmol/L). The quenching strand was present in a 3:1 ratio to FAM-Apta3S (100 nmol/L). (B) The specificity of the Apta3S for carbaryl comparing with its analogues. The concentration of all other analogues is 20 μmol/L, while the carbaryl is 2 μmol/L. Blank represent solution without carbaryl or analogues. | |
The specificity of this aptamer sensing system was evaluated by comparing the fluorescence intensity of solutions containing 2 μmol/L carbaryl with its analogues at concentrations 10 times higher, such as aldicarb, isoprocarb, bendiocarb, methiocarb, 1-naphthol, carbosulfan, pirimicarb, and carbofuran. The structures of all analogues were shown in Fig. S1 (Supporting information). A DPBS binding buffer without any of the above analogues was used as the blank. As shown in Fig. 5B, a remarkable fluorescence intensity response was obtained for the solution containing carbaryl, while almost the same fluorescence intensity of the solutions containing analogues at 20 μmol/L with the fluorescence intensity of blank solution were observed. The result indicates the Apta3S has excellent specificity for carbaryl against other analogues with similar structures.
Furthermore, the FAM-Apta3S based fluorescent aptasensor was established for carbaryl standard solution analysis. As shown in Fig. 6A, the proposed aptasensor was incubated with various concentration of carbaryl (ranging from 0.02 nmol/L to 20 μmol/L) respectively. The fluorescence intensity of FAM increased with the increase in carbaryl concentration. The scatterplot of the fluorescence intensity with different concentration of carbaryl was shown in Fig. 6B. Plot in linear relationship is marked with a red border. The insert graph illustrates the good linear relationship between fluorescence intensity and the concentration of carbaryl with the linearization equation F=691.6+1834.2c (R2=0.996). The limit of detection (LOD) is as low as 15.23 nmol/L, which is given by the equation: LOD=3 × SB/b, where SB is the standard deviation of twenty independent blank samples and b is the sensitivity of the calibration graph.

|
Download:
|
| Fig. 6. (A) Fluorescence spectra of FAM-Apta3S with carbaryl at the concentrations of 0.02, 0.05, 0.1, 0.2, 0.3, 0.5, 0.8, 1.2, 1.5, 3.0, 5.0, 10.0 and 20.0 μmol/L (from bottom to up) in binding buffer. (B) Scatterplot of the fluorescence intensity with different concentration of carbaryl. Plot in linear relationship is marked with a red border. Insert is the linear relationship between the fluorescence intensity and carbaryl concentration (0.1-1.5 μmol/L). | |
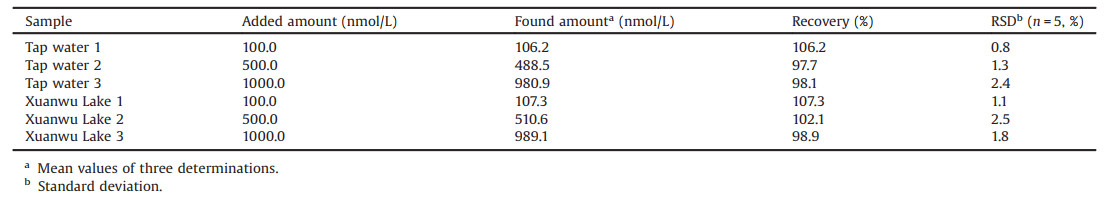
In order to validate and evaluate the accuracy as well as practical application of the constructed fluorescent aptasensor, the water samples, which were collected from Xuanwu Lake of Nanjing and tap water, were tested. The results are shown in Table 2. It was confirmed that the developed aptasensor displays excellent capability for the accurate detection of carbaryl in water samples. The high recovery percentage with acceptable RSD values below 5% demonstrates that the carbaryl detection is not affected by neither tap water samples nor lake samples, thus demonstrating that the proposed aptasensor could be applied to detect carbaryl in real samples.
|
|
Table 2 Determination of carbaryl in real samples. |
In summary, this study successfully obtained a DNA aptamer for carbaryl by using ssDNA library immobilized SA-MNPs SELEX technique, and using Q-PCR and agarose gel electrophoresis to monitor the overall selection progress, which has significant advantages for small molecules aptamer selection. Besides, the highly binding aptamer Apta3 was truncated and further modified with FAM at 5′ terminal to develop a fluorescent aptasensor for quantitative detection of carbaryl. The linear range for carbaryl was from 100 nmol/L to 1500 nmol/L, with the limit of detection was as low as 15.23 nmol/L. Moreover, the aptasensor was validated for the carbaryl spiked real water samples, and the recoveries were between 97.7% and 107.3%, demonstrates that the fabricated fluorescent aptasensor is a promising candidate for carbaryl detection in the area of biosensors, which also showed great potential in the practical application.
Declaration of competing interestThe authors declare no competing financial interests.
AcknowledgmentsThis work was financially supported by the National Key Research and Development Program of China (No. 2018YFC1602905) and the National Natural Science Foundation of China (Nos. 61527806 and 61871180).
Appendix A. Supplementary dataSupplementar ymaterial related to this article can be found, in the online version, at doi:https://doi.org/10.1016/j.cclet.2021.01.016.
| [1] |
M.P.R. Lima, D.N. Cardoso, A.M.V.M. Soares, S. Loureiro, Ecotox. Environ. Safe. 114 (2015) 263-272. DOI:10.1016/j.ecoenv.2014.04.004 |
| [2] |
C. Zhang, G. Ma, G. Fang, Y. Zhang, S. Wang, J. Agric. Food Chem. 56 (2008) 8832-8837. DOI:10.1021/jf801645m |
| [3] |
I. Lee, P. Eriksson, A. Fredriksson, S. Buratovic, H. Viberg, Toxicol. Appl. Pharm. 288 (2015) 429-438. DOI:10.1016/j.taap.2015.08.014 |
| [4] |
I. Palchetti, A. Cagnini, M. DelCarlo, et al., Anal. Chim. Acta 337 (1997) 315-321. DOI:10.1016/S0003-2670(96)00418-7 |
| [5] |
S. Venu, K. Santhi, A. Rawson, R. Paranthaman, K. Sureshkumar, Pharmacogn. Mag. 15 (2019) 205-211. DOI:10.4103/pm.pm_641_18 |
| [6] |
K.A. Massey, D.L. VanEngelen, I.M. Warner, Talanta 42 (1995) 1457-1463. DOI:10.1016/0039-9140(95)01595-3 |
| [7] |
Q.W. Yu, S.J. Liu, F. Zheng, et al., Chin. Chem. Lett. 31 (2020) 482-486. DOI:10.1016/j.cclet.2019.07.065 |
| [8] |
D. Garcia-Rodriguez, R. Cela-Torrijos, R.A. Lorenzo-Ferreira, A.M. Carro-Diaz, Food Chem. 135 (2012) 259-267. DOI:10.1016/j.foodchem.2012.04.088 |
| [9] |
I. Cesarino, F.C. Moraes, M.R.V. Lanza, S.A.S. Machado, Food Chem. 135 (2012) 873-879. DOI:10.1016/j.foodchem.2012.04.147 |
| [10] |
Y. Liu, K.K. Liu, H.M. Dong, et al., Nanosci. Nanotechnol. Lett. 8 (2016) 785-790. DOI:10.1166/nnl.2016.2264 |
| [11] |
Y. Rui, X.M. Wu, B.D. Ma, Y. Xu, Chin. Chem. Lett. 29 (2018) 1387-1390. DOI:10.1016/j.cclet.2017.10.033 |
| [12] |
Z. Zheng, Y. Zhou, X. Li, S. Liu, Z. Tang, Biosens. Bioelectron. 26 (2011) 3081-3085. DOI:10.1016/j.bios.2010.12.021 |
| [13] |
H.F. Cui, W.W. Wu, M.M. Li, et al., Biosens. Bioelectron. 99 (2018) 223-229. DOI:10.1016/j.bios.2017.07.068 |
| [14] |
L.K. Yotova, I.I. Stoykova, S.A. Yaneva, J. Biotechnol. 231 (2016) S28-S29. |
| [15] |
N. Yang, T. Tang, H. Yu, et al., Mater. Express 9 (2019) 451-458. DOI:10.1166/mex.2019.1510 |
| [16] |
G. Wang, X. Tan, Q. Zhou, et al., Sens. Actuators B: Chem. 190 (2014) 730-736. DOI:10.1016/j.snb.2013.09.042 |
| [17] |
Y. Song, J. Chen, M. Sun, et al., J. Hazard. Mater. 304 (2016) 103-109. DOI:10.1016/j.jhazmat.2015.10.058 |
| [18] |
X. Lai, S. Yan, N. Ye, Y. Xiang, Food Anal. Method. 12 (2019) 2161-2171. DOI:10.1007/s12161-019-01563-y |
| [19] |
X. Zhou, C. Zhang, H. Jiang, et al., Nanosci. Nanotechnol. Lett. 10 (2018) 596-602. DOI:10.1166/nnl.2018.2695 |
| [20] |
Z. Xi, R. Huang, Z. Li, et al., ACS Appl. Mater. Inter. 7 (2015) 11215-11223. DOI:10.1021/acsami.5b01180 |
| [21] |
T. Li, J. Yang, Z. Ali, et al., Sci. China Chem. 60 (2017) 370-376. DOI:10.1007/s11426-016-0159-2 |
| [22] |
D. Yang, M. Liu, J. Xu, et al., Talanta 185 (2018) 113-117. DOI:10.1016/j.talanta.2018.03.045 |
| [23] |
D.S. Zhen, F.F. Zhong, D. Yang, Q.Y. Cai, Y. Liu, Mater. Express 9 (2019) 319-327. DOI:10.1166/mex.2019.1499 |
| [24] |
Y. Liu, Y.X. Lai, G.J. Yang, et al., J. Biomed. Nanotechnol. 13 (2017) 1253-1259. DOI:10.1166/jbn.2017.2424 |
| [25] |
Y. Liu, Y. Deng, T.T. Li, et al., J. Biomed. Nanotechnol. 14 (2018) 156-161. |
| [26] |
X. Yu, L. He, M. Pentok, et al., Nanoscale 11 (2019) 15589-15595. DOI:10.1039/C9NR04050A |
| [27] |
N. Duan, S. Wu, X. Chen, et al., J. Agric. Food Chem. 61 (2013) 3229-3234. DOI:10.1021/jf400767d |
| [28] |
R.R. Huang, L. He, Y.Y. Xia, et al., Small 15 (2019) 1900735. DOI:10.1002/smll.201900735 |
| [29] |
S.W. Wang, R. Niu, Y.M. Yang, et al., Int. J. Biol. Macromol. 153 (2020) 583-590. DOI:10.1016/j.ijbiomac.2020.03.035 |
| [30] |
M. Arvand, J. Gholami, Anal. Methods 12 (2020) 1237-1243. DOI:10.1039/D0AY00011F |
| [31] |
M. Liu, A. Khan, Z. Wang, et al., Biosens. Bioelectron. 130 (2019) 174-184. DOI:10.1016/j.bios.2019.01.006 |
| [32] |
R. Bala, A. Swami, I. Tabujew, et al., Biosens. Bioelectron. 104 (2017) 45-49. |
| [33] |
K.M. Fan, W.K. Kang, S.F. Qu, et al., Talanta 197 (2019) 645-652. DOI:10.1016/j.talanta.2019.01.069 |
| [34] |
H. Shi, G. Zhao, M. Liu, L. Fan, T. Cao, J. Hazard. Mater. 260 (2013) 754-761. DOI:10.1016/j.jhazmat.2013.06.031 |
| [35] |
G.L. Xu, D.Q. Huo, C.J. Hou, et al., Talanta 178 (2017) 1046-1052. |
| [36] |
Z. Luo, L. He, J. Wang, X. Fang, L. Zhang, Analyst 142 (2017) 3136-3139. DOI:10.1039/C7AN01131H |
| [37] |
T. Wang, C. Chen, L.M. Larcher, R.A. Barrero, R.N. Veedu, Biotechnol. Adv. 37 (2019) 28-50. DOI:10.1016/j.biotechadv.2018.11.001 |