 2021, Vol. 32


b Key Laboratory for Advanced Technology in Environmental Protection of Jiangsu Province, Yancheng Institute of Technology, Yancheng 224051, China;
c Institute of Physical Science and Information Technology, Anhui University, Hefei 230601, China;
d Anhui Golden Sun Biochemical Pharmaceuticals Limited Company, Fuyang 236000, China
Autophagy plays a crucial role in maintaining the balance of normal physiological state and disease regulation. Autophagy can also be used for adjusting the cell's morphology, preventing diseases and has potential applications in cancer therapy [1-6]. Therefore, monitoring autophagy is of great importance in biological research. At present, the classical methods for monitoring autophagy including transmission electron microscopy (TEM), western blot, and plasmid transfection, etc. [7-10]. However, due to the technical difficulties, using TEM and western blot to detect autophagy cannot be realized in live cells [7, 10]. Plasmid transfection is a biological method to visually detect autophagy, however, its operation requires complicated transfection technology and is very time-consuming. The reagents and drugs used in plasmid transfection are also quite expensive. More importantly, the fluorescence of LC3 protein will be reduced or quenched in an acidic environment (autolysosomes for example), indicating it is not suitable to monitor autophagy of live cells for a long time [8, 11, 12]. In order to overcome the limitations of existing methods, efficient and low-cost tools for real-time long-term monitoring autophagy are highly desired.
In the early stage of autophagy process, a variety of cell substances such as protein, sugar and damaged organelles are phagocytized by autophagosomes [1, 11, 13, 14]. When the membrane fusion of lysosomes and autophagosomes subsequently happens, the changes in the microenvironment of lysosome (such as pH, viscosity and polarity) are accompanied [15-24]. That is to say, the changes of lysosome polarity can be deemed as the feedback of autophagy process. Therefore, detecting the changes of lysosomal polarity during autophagy can be considered as an efficient strategy to monitor autophagy.
Fluorescent probe has become a promising means of studying biological processes or medical diseases due to their superior performance [25-29]. Recently, fluorescent probes have been developed for detecting polarity [30-41]. However, most of them are based on the one-photon (OP) excitation and only a few of them were used to detect the changes of polarity during autophagy [23, 24, 41]. Compared with one-photon microscopy (OPM), two-photon microscopy (TPM) has become a more efficient imaging tool for cells and tissues. TPM has the advantages of less photobleaching and phototoxicity, higher resolution and deeper tissue penetration, therefore is more befitting for long-term dynamic observation of living cells [42-47]. For these reasons, it is of our great interest to develop a polarity-specific two-photon fluorescent probe for monitoring autophagy.
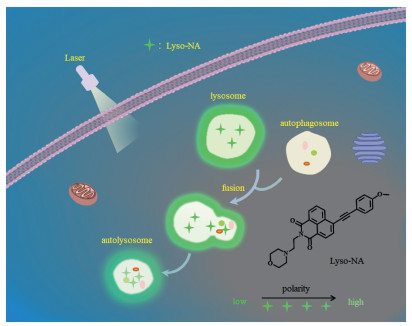
Based on the work of our group in monitoring autophagy with two-photon fluorescent probe for microenvironment response [21-24], we developed a new two-photon fluorescent probe Lyso-NA. As shown in Scheme 1, we chose naphthalimide as the fluorescence chromophore, which has the advantages of solvatochromic property, high fluorescence quantum yield and photostability [48-52]. Morpholine was used as the lysosome-targeting group. An electron donor group 4-methoxyphenylacetylene was introduced into the 4-position of naphthalimide to enlarge the conjugated system and build a push-pull ICT system, which will provide the probe with a sensitive and specific response to polarity. By characterizing its performance, we conclude that the newly developed probe is polarity-specific, low cytotoxic, and lysosome-targeted. Our aim is to provide an efficient and alternative imaging tool for real-time long-term visualization of autophagy by detecting the changes of lysosomal polarity in the autophagy process.

|
Download:
|
| Scheme 1. A schematic diagram of Lyso-NA for real-time long-term visualization of autophagy. | |
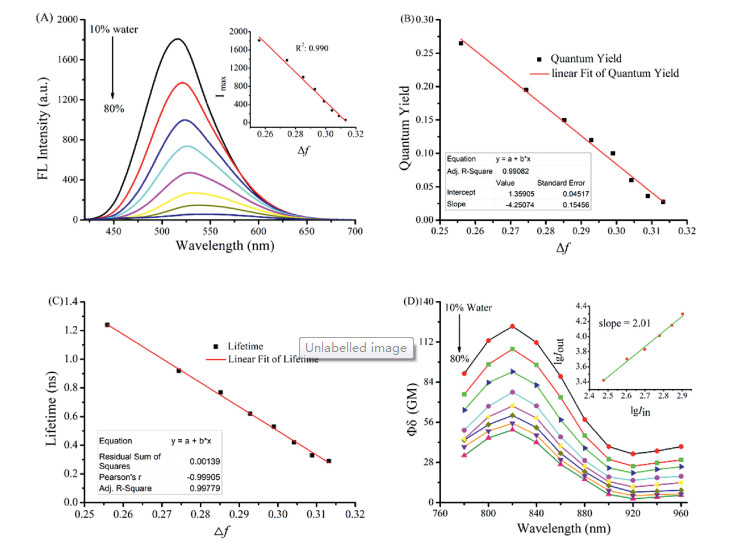
Reagents, solvents, instruments, synthetic route and characterization of Lyso-NA (Scheme S1, Figs. S11-S13 in Supporting information) can be found in the Supporting information. First, we tested the optical response of the probe to polarity. Absorption spectra of Lyso-NA were measured in a mixed solvent of H2O and THF with different polarities (Fig. S1 in Supporting information). The probe showed the maximum absorption at 400 nm in different H2O/THF mixed solvents, which indicated that the polarity of solvent makes little influence on the UV-vis absorption of Lyso-NA in H2O/THF system. However, the fluorescence varied a lot accompany to the changes of polarity. As shown in Fig. 1A, with the increase of water content in the mixed solvent (the polarity of solvent increased accordingly), the emission maximum of probe Lyso-NA had a red-shift from 515 nm to 542 nm, and the fluorescence intensity decreased by about 18 folds. The relationship between maximum fluorescence intensity and polarity value (Δƒ) followed a good linear correlation (R2=0.990, inset of Fig. 1A). Photophysical properties of Lyso-NA in different solvents also confirmed that the fluorescence emission of Lyso-NA is sensitive to the solvent polarity (Fig. S2 and Table S1 in Supporting information). With the increase of solvent polarity (from toluene to H2O), the maximum emission peak of Lyso-NA red-shifted from 463 nm to 545 nm, coupled with the decrease in fluorescence intensity. The probable interfering factors of Lyso-NA to polarity, such as pH and viscosity, was further investigated (Figs. S3 and S4 in Supporting information). It is noticeable that the fluorescence intensity of Lyso-NA in the same polar solvent (100% water) barely changes with the different pH conditions (pH 5.0 and 7.0). On the contrary, the fluorescence intensity of the probe was enhanced significantly while in different polarity (50% water vs. 100% water) at the same pH value (pH 7.0). The results showed that the probe does not respond to pH. The influence of viscosity was similar as that of pH. The viscosity of THF and MeOH are almost same, but the polarity is different. The fluorescence intensity of Lyso-NA displayed huge difference between them. However, the fluorescence intensity varied little with decreasing viscosity from 100 cP to about 0.6 cP in methanol-glycerol system. The above results indicated that Lyso-NA is insensitive to variation of both pH and viscosity. Moreover, the probe is not responsive to metal cations, anions and other biological species (Fig. S5 in Supporting information). Then, we further tested the effect of polarity (Δƒ from 0.25 to 0.32) on the quantum yield and fluorescence lifetime of Lyso-NA, and their relationships with polarity were consistent with that of probe's optical behavior (Figs. 1B and C). In consequence of the increase of polarity, the quantum yield and fluorescence lifetime of the probe decreased (quantum yield decreased from 0.27 to 0.027 and fluorescence lifetime decreased from 1.24 to 0.28, respectively), and both of them kept a good linear relationship with polarity.

|
Download:
|
| Fig. 1. (A) Changes of fluorescence intensity of Lyso-NA (10 μmol/L) with the solvent polarity (H2O/THF system). Inset: The linearity of maximum fluorescence intensity versus the solvent polarity. λex=400 nm. (B) Linear relationship between fluorescence quantum yield of Lyso-NA and polarity. (C) Linear relationship between fluorescence lifetime of Lyso-NA and polarity. (D) Changes of two-photon action cross-section of Lyso-NA in H2O/THF mixtures. Inset: Linear relationship between two-photon excited fluorescence intensity (Iout) and the input power (Iin = 0.3-0.8 W). | |
In addition, the two-photon absorption properties of Lyso-NA in H2O/THF system were examined by two-photon induced fluorescence technique. Fig. 1D, it is clearly suggested that the maximum two-photon action cross-section of Lyso-NA decreases from 120 GM to 40 GM with the increase of water content. With the increase of laser power (0.3-0.8 W), the two-photon excitation fluorescence intensity had a good square relationship with laser energy at the maximum excitation wavelength (820 nm). It showed that Lyso-NA has good two-photon absorption properties and the two-photon fluorescence of Lyso-NA is connected with the value of polarity. All above results testified that the fluorescence of probe Lyso-NA is specific response to the environmental polarity.
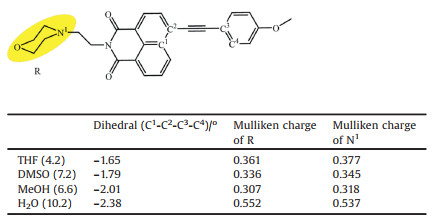
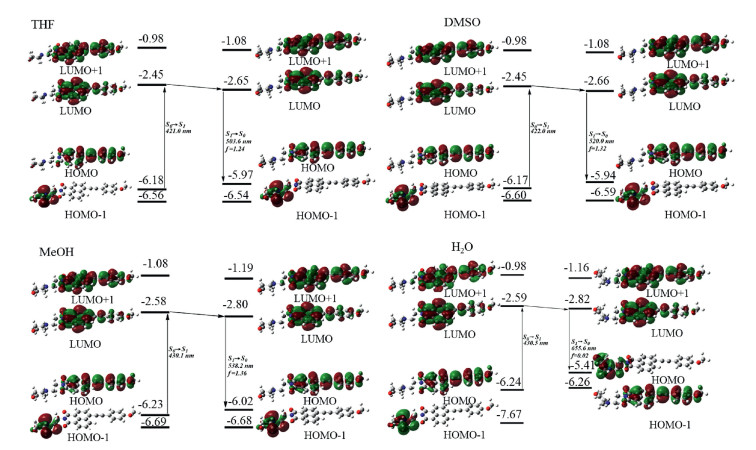
The photophysical properties of probe Lyso-NA (Table S1) are further studied by theoretical calculation. DFT calculations (with Gaussian 09 software) were carried out to explore the origin of the polarity sensitivity of Lyso-NA. According to the calculation results, the UV-vis absorption spectrum of Lyso-NA is not significantly affected by the solvent (THF=421.0 nm, DMSO=422.0 nm, MeOH=430.1 nm, H2O=430.5 nm), whereas the fluorescence emission spectrum is significantly interfered by different solvents (THF=503.6 nm, DMSO=520.0 nm, MeOH=538.2 nm, H2O=655.6 nm). The results are consistent with the experimental observations. The frontier orbital analysis (Fig. 2) indicates that the HOMO (i.e., highest occupied molecular orbital) energy of S1 state of the optimized structure of Lyso-NA in THF, DMSO and MeOH is similar, but is significantly higher than that in H2O. Meanwhile, LUMO (lowest unoccupied molecular orbital) energy decreases in the sequences of THF, DMSO, MeOH and H2O, resulting in the red shift of its emission spectrum in turn. The reason for the significantly higher energy of HOMO (S1) Lyso-NA in water is assumed to originate from the stronger electron transfer from the R-group to the naphthalimide group during the photo-excitation. This assumption is supported by the relatively higher Mulliken charge of R-group in Lyso-NA in water than that in all other solvents (0.552, 0.361, 0.336, 0.307 in H2O, THF, DMSO and MeOH, Table 1). To this end, the corresponding orbital energy relating the R-group was critically increased, and becomes HOMO in water solvent. In this context, the lowered LUMO energy and the higher HOMO energy in water results in the significantly decreased emission energy, and thus the red shift of the fluorescence emission maximum. In addition, the significantly deviation of the distribution of HOMO from that of LUMO in water (Fig. 2) results in the optically forbidden transition of S1→S0. Therefore, it is understandable that the fluorescence intensity of Lyso-NA is almost negligible in water. Besides, comparing the optimized geometry of S1 state of Lyso-NA, the dihedral angle of C1-C2-C3-C4 (the deviation of the two conjugated aromatic ring from planar structure) is -1.65, -1.79, -2.01 and -2.38 in THF, DMSO, MeOH and H2O (Table 1). Therefore, the most efficient conjugation of the donor-acceptor system in THF induces the strongest fluorescence therein. In other words, the different polarity of solvent significantly perturbs the conjugation of the D-A systems, and thus the fluorescence intensity.

|
Download:
|
| Fig. 2. Optimized structures, HOMO-1, HOMO, LUMO, LUMO+1 of Lyso-NA in THF, DMSO, MeOH and H2O. | |
|
|
Table 1 Dihedral angle and Mulliken charge parameter of Lyso-NA. |
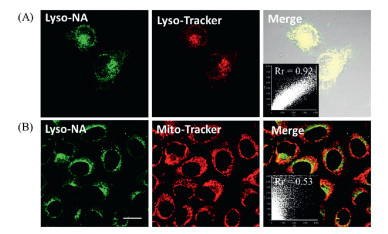
In order to evaluate whether probe Lyso-NA is suitable for biological application, we conducted cytotoxic test and lysosomal co-localization experiment. The results of MTT assay showed that the probe has low cytotoxicity (Fig. S6 in Supporting information). In the co-localization experiment of Lyso-NA and commercial dye Lyso-Tracker Red incubated with MCF-7 cells, we observed that the overlapping rate of fluorescence images of probe and Lyso-Tracker Red was high, and the co-localization coefficient (Rr) value was 0.92. In contrast, the fluorescence image of probe and Mito-Tracker Red overlapped a bit low (Fig. 3), and it was only 0.53. This indicates that Lyso-NA has accurate lysosomal localization ability. On the other hand, the two-photon fluorescence microscopic imaging of mouse liver tissue slices showed that the fluorescence penetration depth of Lyso-NA was as high as 150 μm (Fig. S7 in Supporting information). It was advantageous for us to research deeper tissue imaging.

|
Download:
|
| Fig. 3. (A) Co-localization experiments co-stained with Lyso-NA (10.0 μmol/L) and Lyso-Tracker Red (0.5 μmol/L) in MCF-7 cells. Green channel: λex=820 nm, λem=490-550 nm. Red channel: λex=559 nm, λem=580-650 nm. (B) Co-localization experiments co-stained with Lyso-NA (10.0 μmol/L) and Mito-Tracker Red (0.5 μmol/L) in MCF-7 cells. Green channel: λex=820 nm, λem=490-550 nm. Red channel: λex=633 nm, λem=670-750 nm. Scale bars: 20 μm. | |
We then explored the practical effect of lysosomal polarity changes in cells detected by Lyso-NA. It was found that the fluorescence intensity of MCF-7 cells significantly increased after added 10 μL of DMSO (DMSO was rapidly absorbed by cells and resulted in the decrease of lysosomal polarity in living cells [23]) (Fig. S8 in Supporting information), which indicated that Lyso-NA could detect the change of lysosomal polarity well.
In order to further prove the changes of lysosomal polarity in autophagy, the autophagy model was established by starvation induction. Western blot is a classical method to monitor autophagy. The expression level of glyceraldehyde-3-phosphate dehydrogenase (GAPDH) in autophagy is almost constant, but the expression level of LC3-Ⅱ protein is usually considered as the level of autophagy [53, 55]. We observed that the expression quantity of LC3-Ⅱ in starving group gradually increased in the early stage of the experiment and reached the maximum value after 1 h, which indicated that the membrane fusion of lysosome and autophagosome happened [53] (Fig. 4B). With the development of autophagy, the expression level of LC3-Ⅱ protein declined continually due to the role of hydrolase in lysosome. The above experimental data showed that the model of starvation autophagy is successful established. Then, MCF-7 cells were respectively incubated in serum-free medium and rich-nutrient medium, and stained with Lyso-NA. After this stage, the changes of fluorescence in MCF-7 cells were observed at different times. In two-photon (TP) fluorescence imaging of cells in starvation, we clearly noticed a strong fluorescence, which began to weaken after 1 h, and almost disappeared after 4 h (Fig. 4A). However, the fluorescence of MCF-7 cells kept basically unchanged under the condition of adequate nutrition for cells. Changes in the expression level of LC3-Ⅱ protein and the fluorescence intensity of cells under different culture conditions were clearly observed in Fig. 4C, which indicated a clear increase in lysosomal polarity during autophagy. To prove this conclusion, an autophagy inhibition test was carried out. Lyso-NA and 3-methyladenine (3-MA, which can inhibit autophagy [55]) were co-incubated in starvation group. The result shows that the fluorescence of cells almost remained unchanged in autophagy inhibition assay, which further verified the increase of lysosomal polarity during autophagy process.

|
Download:
|
| Fig. 4. (A) TP Fluorescence images of MCF-7 cells stained with Lyso-NA (10 μmol/L) in rich-nutrient, serum-free and serum-free + 3MA for different times. (B) Western blot showing the expression of GAPDH and LC3-Ⅱ in MCF-7 cells. (C) Fluorescence intensity ratio (I/I0) of Lyso-NA in rich-nutrient, serum-free and serum-free + 3MA at different time nodes. I represent the fluorescence intensity of Lyso-NA at different time nodes and I0 represent the fluorescence intensity of Lyso-NA at 0 h. Quantification data (green line) of the western blot results at different time nodes. λex=820 nm, λem=490-550 nm. Scale bars: 20 μm. | |
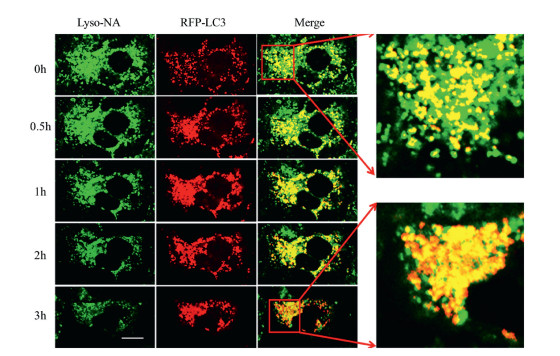
Finally, the superiority of the probe was evaluated by plasmid transfection. A recombinant plasmid was formed by labeling LC3 protein with red fluorescent protein (RFP). MCF-7 cells were transfected with RFP-LC3 and incubated with Lyso-NA. LC3-Ⅱ (LC3-phospholipid conjugate) is usually regarded as a marker for autophagy and located both in cytosol and autophagosomes [53]. In Fig. 5, we found that the fluorescence of red channel was weak and dispersive at 0 h. This is because LC3-Ⅱ already exists on the inner and outer membrane when the autophagosome is still a cup-shaped preautophagosome, and spot fluorescence can be observed even under normal conditions [13, 53, 54]. In the contrary, when probe Lyso-NA entered the lysosome, we immediately observed a strong green fluorescence. The overlap rate of red fluorescence and green fluorescence was low at 0 h. Since the red fluorescence of LC3-Ⅱ proteins are mainly distributed in autophagosomes at the beginning, whereas green fluorescence mainly exists in lysosomes. They exist in different areas, so the overlap rate of two channels was low. On the condition of starvation, the cells were induced to start autophagy on a large scale. More autophagosomes were formed and more LC3 was lapidated to produce LC3-Ⅱ, hence the fluorescence of red channel was getting stronger and stronger from 0 h to 1 h, which reached its maximum at about 1 h. After inducing autophagy for more than 1 h, lysosomes and autophagosomes began to undergo membrane fusion process and LC3-Ⅱ would be hydrolyzed in lysosomes. The red fluorescence weakened slowly during 1-3 h hinting the abatement of LC3-Ⅱ, which was also consistent with the experimental results of western blot (Fig. 4B). This shows that we have successfully detected autophagy by plasmid transfection. Simultaneously, the lysosomal polarity increased accompanied with the progress of autophagy and green fluorescence of Lyso-NA was found to decrease from 0 h to 3 h. As time went on, the fluorescence overlap rate of two channels was getting better. That is because starvation induces the acceleration of autophagy and the emergence of autolysosomes. During the membrane fusion process, both red and green fluorescence mainly existed in autolysosomes, so the overlapped yellow fluorescence was increasing. Two channels were almost completely overlapped at 3 h, which shows that Lyso-NA can achieve the equal experimental results compared with those of plasmid transfection. However, plasmid transfection has an obvious disadvantage, LC3 protein labeled by RFP can be degraded by acidic hydrolase in lysosome, therefore cannot monitor autophagy for a long time. We noticed a clear decrease of red fluorescence in 2-3 h. Contrarily, probe Lyso-NA cannot be hydrolyzed by acidic hydrolases, but also it has a function of real-time detection of autophagy. Compared with plasmid transfection, the method of monitoring autophagy by using Lyso-NA is more efficient, time-saving and easier to operate.

|
Download:
|
| Fig. 5. Fluorescence images of MCF-7 cells for tracking the starvation-induced autophagy process. MCF-7 cells were pretreated with RFR-LC3 for 24 h and then incubated with Lyso-NA in serum-free medium for 3 h. Fluorescence images were recorded at different times. Green channel: λex=820 nm, λem=490-550 nm, red channel: λex=558 nm, λem=583±20 nm. Scale bar: 20 μm. | |
In summary, we designed and synthesized a novel two-photon fluorescent probe Lyso-NA and the results indicated that it is sensitive to polarity, has good two-photon absorption characteristics and can be located in lysosomes. Visualization of autophagy through detecting the changes of lysosomal polarity was achieved, showing advantages over the methods of western blot and plasmid transfection. Probe Lyso-NA can be considered as an efficient and economical tool for real-time long-term monitoring autophagy in living cells. These results also provide a new strategy for monitoring autophagy from chemical point of views other than biological perspectives.
Declaration of competing interestThe authors report no declarations of interest.
AcknowledgmentsThis work was supported by the National Natural Science Foundation of China (Nos. 22077001, 21778001 and 21672001), the Natural Science Foundation of Anhui Province (No. 2008085J08), the Natural Science Foundation of Education Department of Anhui Province (No. KJ2019A0010), Joint Open Fund of Jiangsu Collaborative Innovation Center for Ecological Building Material and Enviro nmental Protection Equipments, Key Laboratory for Advanced Technology in Enviro nmental Protection of Jiangsu Province (No. JH201803) and the Open fund for Discipline Construction in Institute of Physical Science and Information Technology of Anhui University.
Appendix A. Supplementary dataSupplementary material related to this article can be found, in the online version, at doi: https://doi.org/10.1016/j.cclet.2020.12.012.
| [1] |
P. Wang, B.Z. Shao, Z. Deng, et al., Prog. Neurobiol. 163-164 (2018) 98-117. DOI:10.1016/j.pneurobio.2018.01.001 |
| [2] |
T. Kimura, Y. Isaka, T. Yoshimori, Autophagy 13 (2017) 997-1003. DOI:10.1080/15548627.2017.1309485 |
| [3] |
M. Duszenko, M.L. Ginger, A. Brennand, et al., Autophagy 7 (2014) 127-158. |
| [4] |
X.J. Zhou, D.J. Klionsky, H. Zhang, Autophagy 15 (2019) 908-912. DOI:10.1080/15548627.2019.1580512 |
| [5] |
C.M. Dower, C.A. Wills, S.M. Frisch, H.G. Wang, Autophagy 14 (2018) 1110-1128. DOI:10.1080/15548627.2018.1450020 |
| [6] |
B. Levine, G. Kroemer, Cell 176 (2019) 11-42. DOI:10.1016/j.cell.2018.09.048 |
| [7] |
J.M. Swanlund, K.C. Kregel, T.D. Oberley, Autophagy 6 (2014) 270-277. |
| [8] |
D.J. Klionsky, H. Abeliovich, P. Agostinis, et al., Autophagy 4 (2008) 151-175. DOI:10.4161/auto.5338 |
| [9] |
N. Mizushima, T. Yoshimori, B. Levine, Cell 140 (2010) 313-326. DOI:10.1016/j.cell.2010.01.028 |
| [10] |
Y.X. Lin, S.L. Qiao, Y. Wang, et al., ACS Nano 11 (2017) 1826-1839. DOI:10.1021/acsnano.6b07843 |
| [11] |
V. Rogov, V. Dotsch, T. Johansen, V. Kirkin, Mol. Cell 53 (2014) 167-178. DOI:10.1016/j.molcel.2013.12.014 |
| [12] |
S. Kimura, T. Noda, T. Yoshimori, Autophagy 3 (2007) 452-460. DOI:10.4161/auto.4451 |
| [13] |
B. Levine, G. Kroemer, Cell 132 (2008) 27-42. DOI:10.1016/j.cell.2007.12.018 |
| [14] |
B. Levine, D.J. Klionsky, Dev. Cell 6 (2004) 463-477. DOI:10.1016/S1534-5807(04)00099-1 |
| [15] |
S.S. Li, M. Zhang, J.H. Wang, et al., Anal. Chem. 91 (2019) 8398-8405. DOI:10.1021/acs.analchem.9b01250 |
| [16] |
M. Tian, C. Liu, B. Dong, Y. Zuo, W. Lin, Chem. Comm. 55 (2019) 10440-10443. DOI:10.1039/C9CC03679B |
| [17] |
X. Wang, L. Fan, Y. Wang, et al., J. Mater. Chem. B 8 (2020) 1466-1471. DOI:10.1039/C9TB02551K |
| [18] |
L. Yang, Y. Chen, Z. Yu, et al., ACS Appl. Mater. Interfaces 9 (2017) 27512-27521. DOI:10.1021/acsami.7b08223 |
| [19] |
M.H. Lee, N. Park, C. Yi, et al., J. Am. Chem. Soc. 136 (2014) 14136-14142. DOI:10.1021/ja506301n |
| [20] |
Y. Liu, J. Zhou, L. Wang, et al., J. Am. Chem. Soc. 138 (2016) 12368-12374. DOI:10.1021/jacs.6b04048 |
| [21] |
L. Hou, P. Ning, Y. Feng, et al., Anal. Chem. 90 (2018) 7122-7126. DOI:10.1021/acs.analchem.8b01631 |
| [22] |
P. Ning, L. Hou, Y. Feng, et al., Chem. Comm. 55 (2019) 1782-1785. DOI:10.1039/C8CC09517E |
| [23] |
C. Jiang, L. Li, J. Jiang, et al., Chin. Chem. Lett. 31 (2020) 447-450. DOI:10.1016/j.cclet.2019.07.046 |
| [24] |
J. Jiang, X. Tian, C. Xu, et al., Chem. Comm. 53 (2017) 3645-3648. DOI:10.1039/C7CC00752C |
| [25] |
Z.J. Zhang, F. Wang, X.Q. Chen, Chin. Chem. Lett. 30 (2019) 1745-1757. DOI:10.1016/j.cclet.2019.08.035 |
| [26] |
K.J. Wang, Q. Kong, X.Q. Chen, et al., Chin. Chem. Lett. 31 (2020) 1087-1090. DOI:10.1016/j.cclet.2019.11.013 |
| [27] |
C.T. Liu, F. Wang, T. Xiao, et al., Sens. Actuators B 256 (2018) 55-62. DOI:10.1016/j.snb.2017.09.198 |
| [28] |
J. Li, J.J. Ge, Z.J. Zhang, et al., Sens. Actuators B 296 (2019) 126578. DOI:10.1016/j.snb.2019.05.055 |
| [29] |
D.Y. Lee, K. Jeong, X. Guo, et al., J. Mater. Chem. B 6 (2018) 2541-2546. DOI:10.1039/C7TB01560G |
| [30] |
M. Collot, S. Bou, T.K. Fam, et al., Anal. Chem. 91 (2019) 1928-1935. DOI:10.1021/acs.analchem.8b04218 |
| [31] |
N. Jiang, J. Fan, F. Xu, et al., Angew. Chem. Int. Ed. 54 (2015) 2510-2514. DOI:10.1002/anie.201410645 |
| [32] |
L. Fan, X. Wang, J. Ge, et al., Chem. Comm. 55 (2019) 4703-4706. DOI:10.1039/C9CC00962K |
| [33] |
A.H. Ashoka, P. Ashokkumar, Y.P. Kovtun, A.S. Klymchenko, J. Phys. Chem. Lett. 10 (2019) 2414-2421. DOI:10.1021/acs.jpclett.9b00668 |
| [34] |
S.J. Park, V. Juvekar, J.H. Jo, H.M. Kim, Chem. Sci. 11 (2020) 596-601. DOI:10.1039/C9SC04859F |
| [35] |
H. Xiao, P. Li, W. Zhang, B. Tang, Chem. Sci. 7 (2016) 1588-1593. DOI:10.1039/C5SC04099J |
| [36] |
J. Valanciunaite, E. Kempf, H. Seki, et al., Anal. Chem. 92 (2020) 6512-6520. DOI:10.1021/acs.analchem.0c00023 |
| [37] |
M. Li, J. Fan, H. Li, et al., Biomaterials 164 (2018) 98-105. DOI:10.1016/j.biomaterials.2018.02.044 |
| [38] |
J. Yin, M. Peng, W. Lin, Chem. Comm. 55 (2019) 11063-11066. DOI:10.1039/C9CC04739E |
| [39] |
H. Xiao, C. Wu, P. Li, et al., Chem. Sci. 8 (2017) 7025-7030. DOI:10.1039/C7SC02330H |
| [40] |
J. Yin, M. Peng, W. Lin, Sens. Actuators B 288 (2019) 251-258. DOI:10.1016/j.snb.2019.02.122 |
| [41] |
X. Li, X. Li, H. Ma, Chem. Sci. 11 (2020) 1617-1622. DOI:10.1039/C9SC05505C |
| [42] |
H. Wang, J. Wei, C. Zhang, et al., Chin. Chem. Lett. 31 (2020) 759-763. DOI:10.1016/j.cclet.2019.09.021 |
| [43] |
A.R. Sarkar, C.H. Heo, E. Kim, et al., Chem. Comm. 51 (2015) 2407-2410. DOI:10.1039/C4CC09416F |
| [44] |
G. Li, Q. Lin, L. Sun, et al., Biomaterials 53 (2015) 285-295. DOI:10.1016/j.biomaterials.2015.02.106 |
| [45] |
S. Wu, Y.J. Wei, Y.B. Wang, et al., Chin. Chem. Lett. 25 (2014) 93-98. DOI:10.1016/j.cclet.2013.10.005 |
| [46] |
Q. Liu, L. Xue, D.J. Zhu, G.P. Li, H. Jiang, Chin. Chem. Lett. 25 (2014) 19-23. DOI:10.1016/j.cclet.2013.11.024 |
| [47] |
Y. Dai, B.K. Lv, X.F. Zhang, Y. Xiao, Chin. Chem. Lett. 25 (2014) 1001-1005. DOI:10.1016/j.cclet.2014.05.020 |
| [48] |
L. Zhou, L. Xie, C. Liu, Y. Xiao, Chin. Chem. Lett. 30 (2019) 1799-1808. DOI:10.1016/j.cclet.2019.07.051 |
| [49] |
Y. Wen, W.J. Zhang, T. Liu, F.J. Huo, C.X. Yin, Anal. Chem. 89 (2017) 11869-11874. DOI:10.1021/acs.analchem.7b03612 |
| [50] |
X.R. Shi, C.X. Yin, Y. Wen, F.J. Huo, Dyes Pigm. 165 (2019) 38-43. DOI:10.1016/j.dyepig.2019.02.014 |
| [51] |
W.J. Zhang, F.J. Huo, C.X. Yin, Org. Lett. 21 (2019) 5277-5280. DOI:10.1021/acs.orglett.9b01879 |
| [52] |
H.F. Zhang, F.J. Huo, Y.B. Zhang, C.X. Yin, Sens. Actuators B 269 (2018) 180-188. DOI:10.1016/j.snb.2018.04.155 |
| [53] |
I. Tanida, N. Minematsu-Ikeguchi, T. Ueno, E. Kominami, Autophagy 1 (2005) 84-91. DOI:10.4161/auto.1.2.1697 |
| [54] |
A. Kuma, M. Matsui, N. Mizushima, Autophagy 3 (2007) 323-328. DOI:10.4161/auto.4012 |
| [55] |
W. Yu, Y. Wang, J. Zhu, et al., Biomaterials 192 (2019) 128-139. DOI:10.1016/j.biomaterials.2018.11.019 |