 2021, Vol. 32


b Department of Chemistry, State Key Laboratory of Molecular Engineering of Polymers, Institutes of Biomedical Sciences & Collaborative Innovation Center of Chemistry for Energy Materials, Fudan University, Shanghai 200433, China
Hydrogen sulfide (H2S) has been recognized as the third gas transmitter after nitric oxide (NO) and carbonmonoxide (CO) [1], which has an unpleasant smell of rotten eggs. Normal levels of H2S are important for physiological processes such as angiogenesis [2], vasodilation [3], antioxidant [4], apoptosis [5] and inflammation [6], however, abnormal levels of H2S are associated with diseases such as Alzheimer's disease [7], cirrhosis [8] and down syndrome [9]. Therefore, it is necessary to develop a simple and effective method for detecting H2S.
At present, methods for detecting H2S include electrochemical methods [10], gas chromatography [11], sulfide precipitation [12] and colorimetry [13], which suffer from some limitations in terms of complicated processes and cannot be used for biological analysis. Fluorescence method has received extensive attention in recent years due to its high sensitivity and noninvasiveness characteristics [14-16]. Many fluorescent probes have been developed for the detection of H2S, including the following strategies: (1) Reduction of azide/nitro by H2S [17-22], (2) H2S addition reaction to unsaturated bond [23, 24], (3) complex formation of H2S with Cu2+ [25-27], aromatic nucleophilic substitution [28].
As a typical fluorophore, 4-bromo-1, 8-naphthalic anhydride has good optical characteristics and a large Stokes shift [29-31]. In this manuscript based on 4-bromo-1, 8-naphthalic anhydride, we have developed a novel fluorescent probe (IDNA) for monitoring H2S according to the modified reported synthesis method [32-35]. Compound IDNA was prepared via six steps starting from 4-bromo-1, 8-naphthalic anhydride (Scheme S1 in Supporting information) and the detailed synthesis procedures and characterization data can be seen in Supporting information. This article has performed a series of investigations on IDNA. The results show that IDNA has excellent sensing performance: Ratio-based spectral change effectively reduces background autofluorescence interference and has been demonstrated to be useful in imaging exogenous H2S in HeLa cells.
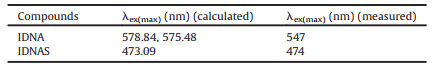
We investigated the UV–vis absorption and fluorescence emission spectra of IDNA in the presence and absence of H2S. As shown in Fig. 1a, In the mixed solution of IDNA (10 μmol/L) in DMSO and H2O (v/v, 4:6), 0–1 mmol/L Na2S (the H2S donor) was gradually added, after 30 min of response, the absorption band at 550 nm was significantly decreased, accompanied by the absorption band at 475 nm was highlighted. Correspondingly, as the concentration of H2S increased, the color of IDNA was noticed to change from purple to light yellow under naked eyes (Fig. 1e). When the concentration of H2S was in the range of 0.3–0.5 mmol/L, the absorption spectrum showed a good linear relationship, R2=0.9978 (Fig. 1b). Fig. 1c indicated the fluorescence emission spectrum of IDNA (10 μmol/L). The addition of H2S resulted a decrease in the peak at 620 nm and an increase in the peak at 510 nm, and when the concentration of H2S reached 1 mmol/L, the peak at 510 nm increased to saturation. Therefore, the fluorescence intensity ratio (I510/I620) was used as a monitor for H2S. The signal of the IDNA exhibited a good linear relationship when the concentration of H2S was 0.3–0.47 mmol/L, while exhibiting a high sensitivity to H2S at a low detection limit of 7 μmol/L (Fig. 1d) [36]. The change in fluorescence color under the 365 nm portable UV lamp, from pink to green, could be obtained from Fig. 1f. As indicated in Fig. S1 (Supporting information), IDNA had good photostability within 15 min, if the irradiation time lasted longer, the photosability was not satisfactory. Meanwhile using fluorescein (quantum yield Φs=79%) as a standard reference (dissolved in 0.1 mol/L NaOH), the fluorescence quantum yield of IDNA (Φx) was measured to be about 8% [37]. All these spectral results provided a theoretical basis for IDNA as a ratiometric fluorescent probe for highly sensitive monitoring of H2S.

|
Download:
|
| Fig. 1. (a) UV–vis absorption spectra of IDNA upon addition of different concentrations of H2S (0–1 mmol/L) in DMSO/H2O solution (4/6, v/v, 10 μmol/L). Response time: 30 min. (b) Linear relationship between the absorbance of IDNA (DMSO/H2O, 4/6, v/v, 10 μmol/L) at 550 nm and the concentration of H2S (0.3–0.5 mmol/L). (c) Fluorescence emission spectra of IDNA upon addition of different concentrations of H2S (0–1 mmol/L) in DMSO/H2O solution (4/6, v/v, 10 μmol/L). λex=450 nm. Response time: 30 min. (d) Linear relationship between fluorescence intensity of IDNA at I510/I620 and the concentration of H2S (0.3–0.47 mmol/L). Detection limit: 7 μmol/L. Add different concentrations of H2S (from left to right the final concentration of H2S is 0, 0.1, 0.2, 0.3, 0.4, 0.5, 0.6, 0.7, 0.8, 0.9, 1 mmol/L) in the IDNA solution (DMSO/H2O, 4/6, v/v, 10 μmol/L). Photographs under natural light (e) and portable 365 nm UV lamp (f), respectively. Response time: 30 min. | |
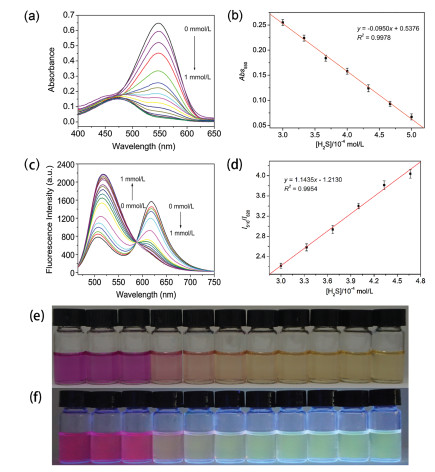
Selectivity is an important parameter for evaluating the sensing characteristics of IDNA. 1 mmol/L of metal cations (K+, Ca2+, Na+, Mg2+) (Fig. S2a in Supporting information), anions (F−, Cl−, Br−, I−, NO2−, NO3−, C2O42−, BrO3−, SCN−, SO42−, ClO−) (Fig. S2b in Supporting information), small biomolecules (Ala, His, Val, Trp, Leu, Met, Pro, Gln, Phe, Gly, Ile, Ser, Thr, Lys, Arg, H2O2, N2H4, GSH, Hcy, Cys, and CN−) (Figs. 2a and b) and H2S were added to the IDNA solution (10 μmol/L), respectively. It was noticed that there was no significant optical change in the fluorescence intensity of IDNA at 510 nm and 620 nm after the addition of other analytes. Only the addition of H2S caused a decrease in the fluorescence intensity at 620 nm and an increase in the peak at 510 nm, which indicated that IDNA had high selectivity for H2S. Further, 1 mmol/L H2S was added to the IDNA solution containing the interfering substance, and the ratio of the fluorescence intensity at 510 nm and 620 nm was recorded (Fig. 2b and Fig. S3 in Supporting information). Optical changes could only be caused by the addition of H2S, although the presence of biomolecules slightly affects the increase in the fluorescence intensity ratio, but they cannot provide false information for the presence of H2S, except GSH and Cys. These competitive experiments indicated that IDNA monitors H2S to be virtually unaffected by interfering substances.

|
Download:
|
| Fig. 2. (a) Fluorescence emission spectra of IDNA (DMSO/H2O, 4/6, v/v, 10 μmol/L) in the presence of H2S (1 mmol/L) and other biological molecule (1 mmol/L, Ala, His, Val, Trp, Leu, Met, Pro, Gln, Phe, Gly, Ile, Ser, Thr, Lys, Arg, H2O2, N2H4). (b) Fluorescence intensity changes at I510/I620 of IDNA in DMSO/H2O solution (4/6, v/v, 10 μmol/L). Dark columns: in the presence of 1 mmol/L different biological molecule; red columns: continue to addition 1 mmol/L H2S. The species from 1 to 22 are blank, Ala, His, Val, Trp, Leu, Met, Pro, Gln, Phe, Gly, Ile, Ser, Thr, Lys, Arg, H2O2, N2H4, GSH, Hcy, Cys, and CN−. λex=450 nm. Response time: 30 min. (c) pH values on the fluorescence intensity at I510/I620 of IDNA (DMSO/H2O, 4/6, v/v, 10 μmol/L) in the presence (red) and absence (black) of H2S. λex=450 nm. Response time: 30 min. (d) Time-dependent fluorescence intensity ratio (I510/I620) of IDNA with addition of different concentrations of H2S (0, 0.2, 0.4, 0.6, 1 mmol/L) in DMSO/H2O solution (4/6, v/v, 10 μmol/L). | |
Then the sensing characteristics of IDNA (10 μmol/L) for monitoring H 2S were investigated in different pH solutions. As shown in Fig. 2c. IDNA was able to detect H2S in a wide pH range (4–11), which provided a basis for its application in biology.
Fluorescence kinetics experiments were carried out to measure the response time of probe INDA toward H2S (Fig. 2d). As shown in Fig. 2d, the fluorescence ratio I510/I620 of INDA only displayed no significant change in about 150 min, suggesting its good stability under experimental condition. Upon addition of different concentrations of H2S, the ratio I510/I620 of INDA was dramatically increased over 30 min and kept stable within 150 min. Thus, probe IDNA could quickly detect H2S via ratiometric fluorescence method.
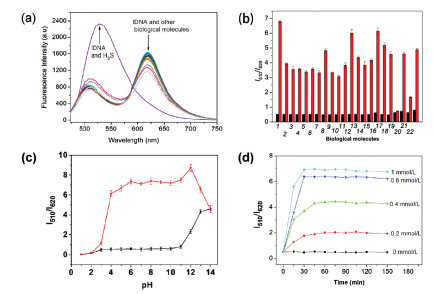
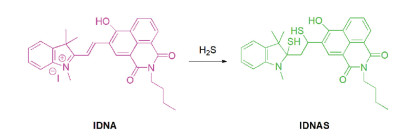
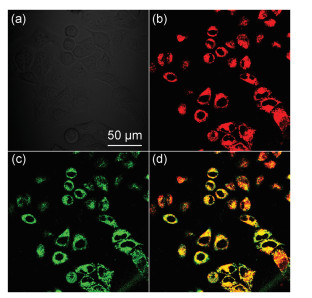
Compound IDNAS was supposed to be the product of reaction between probe IDNA and H2S. The binding pattern between probe and H2S was examined by the 1H NMR titration experiment. The pretty stack plot powerfully proved the mechanism (Fig. S4 in Supporting information). H1, H2 greatly shifted to up field and came at 6.45 and 6.30 ppm after addition of HS−, indicating that conjugated double bond took place reaction. Time dependent DFT (TD-DFT) was carried out to calculate the maximum excitation wavelengths, energies, excited states and expansion coefficients of the 80–120 lowest-energy electronic transitions [38]. As shown in Fig. S5 and Table S1 (Supporting information), the lowest-energy transition of IDNA comes from the HOMO-2→LUMO and HOMO-1→LUMO orbital transitions. As shown in Fig. S6 and Table S2 (Supporting information), the lowest-energy transition of IDNAS comes from the HOMO→LUMO orbital transition. The calculated maximum absorption-peak positions of IDNA and IDNAS are in good agreement with the experimental results (Table 1), which prove that hydrogen sulfide addition reaction occur in IDNA and H2S (Scheme 1). We investigated the cytotoxicity of IDNA in HeLa cells using standard MTT assay. As shown in Table 2, after incubating HeLa cells with 40 μmol/L IDNA for 24 h, the cell viability could still reach 75.4%, which indicated that IDNA had great potential in biological imaging. In addition, 20 μmol/L IDNA and HeLa cells were incubated for 6 h. After irradiation with 488 nm laser for 100 min, the morphology of the cells showed no significant change, and the fluorescence quenching was very weak (Fig. 3). These results signified that the photostability of IDNA remains stable during the working hours with negligible impact on HeLa cells. We explored co-localization fluorescence imaging experiments of IDNA in HeLa cells (Fig. 4). Figs. 4b and c showed the results of staining HeLa cells with IDNA and commercial mitochondrial-localizing dye, respectively. Confocal imaging results suggested that IDNA overlaps well with commercial mitochondrial-localizing dye (Fig. 4d), which may be attributed to the fact that the positively charged structure was relatively easy to enter the mitochondria.
|
|
Table 1 Maximum absorption-peak positions (λex) in IDNA and IDNAS that calculated and measured. |

|
Download:
|
| Scheme 1. Possible detection mechanism of IDNA toward H2S. | |
|
|
Table 2 Cell viability of HeLa cells after 24 h and 48 h incubation with 0, 2, 5, 10, 15, 20, 25, 30, 35 and 40 μmol/L IDNA. |


|
Download:
|
| Fig. 3. Photostability of IDNA (20 μmol/L) at 510 nm and 620 nm as a function of time. λex=488 nm. | |

|
Download:
|
| Fig. 4. Mitochondrial co-localization imaging of IDNA in HeLa cells. HeLa cells were incubated with 20 μmol/L IDNA for 6 h, and 100 nmol/L mitochondrial probes for 30 min. (a) Bright field image. (b) IDNA fluorescence image. (c) Mitochondrial probe fluorescence image. (d) b and c overlay image. The pearson's coefficient was 0.753. | |
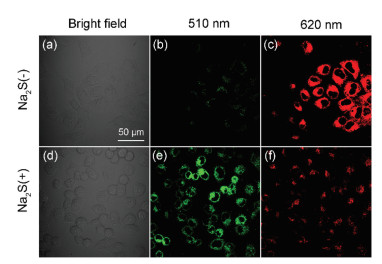
After incubating IDNA in HeLa cells for 6 h, significant fluorescence was clearly observed in the red channel (600–650 nm), while the fluorescence in the green channel (500–550 nm) was barely visible (Fig. 5). As shown in Fig. 5, the addition of H2S induced sharp fluorescence decrease in the red channel, accompanied by an increase in the green channel. All these results indicated that IDNA as a ratiometric fluorescent probe of intracellular H2S was satisfactory. Compared with the recent reported H2S-fluorescent probes (Table 3) [39-43], probe IDNA could quantitatively detect H2S in wide concentration range of H2S via ratiometric fluorescent method, has good photostability in solution and cells. In summary, 4-bromo-1, 8-naphthalic anhydride was used as raw material to design and synthesize a proportional fluorescent probe IDNA for detecting H2S. IDNA has good selectivity and anti-interference ability, corresponding to a low detection limit of 7 μmol/L. When detecting H2S, significant color changes can be observed by the naked eye and under fluorescence lamp. The satisfactory photostability of IDNA in HeLa cells increases its potential for application in vivo. Furthermore, the detection of exogenous H2S and mitochondrial co-localization in HeLa cells were successfully achieved.

|
Download:
|
| Fig. 5. Confocal fluorescence imaging of IDNA in HeLa cells. (a–c) HeLa cells were incubated with 20 μmol/L IDNA for 6 h. (d–f) then incubated with 4 mmol/L H2S for 30 min. (a, d) Bright field image. (b, c) Fluorescence images (green channel, λem=500–550 nm). (c, f) Fluorescence image (red channel, λem=600–650 nm). λex=488 nm. | |
|
|
Table 3 Comparison of various fluorescent probes for H2S detection. |

The authors report no declarations of interest.
AcknowledgmentsWe are grateful for the financial supports from the National Natural Science Foundation of China (Nos. U1704161, U1504203, 21601158), and Zhengzhou University (No. 32210431).
Appendix A. Supplementary dataSupplementary material related to this article can be found, in the online version, at doi:https://doi.org/10.1016/j.cclet.2020.12.044.
| [1] |
O. Kabil, R. Banerjee, J. Biol. Chem. 285 (2010) 21903-21907. DOI:10.1074/jbc.R110.128363 |
| [2] |
A. Katsouda, S.I. Bibli, A. Pyriochou, et al., Pharmacol. Res. 113 (2016) 175-185. DOI:10.1016/j.phrs.2016.08.026 |
| [3] |
G. Yang, L. Wu, B. Jiang, et al., Science 322 (2008) 587-590. DOI:10.1126/science.1162667 |
| [4] |
L. Xie, H. Feng, S. Li, et al., Antioxid. Redox Sign. 24 (2016) 329-343. DOI:10.1089/ars.2015.6331 |
| [5] |
D. Wu, N. Luo, L. Wang, et al., Sci. Rep. 7 (2017) 455. DOI:10.1038/s41598-017-00557-2 |
| [6] |
F. Comas, J. Latorre, O. Cusso, et al., Food Chem. Toxicol. 131 (2019) 110543. DOI:10.1016/j.fct.2019.05.051 |
| [7] |
X.J. Cheng, J.X. Gu, Y.P. Pang, et al., ACS Chem. Neurosci. 10 (2019) 3500-3509. DOI:10.1021/acschemneuro.9b00120 |
| [8] |
M. Babaei-Karamshahlou, B. Hooshmand, S. Hajizadeh, et al., Eur. J. Pharmacol. 696 (2012) 130-135. DOI:10.1016/j.ejphar.2012.09.039 |
| [9] |
T. Panagaki, E.B. Randi, F. Augsburger, et al., PNAS 116 (2019) 18769-18771. DOI:10.1073/pnas.1911895116 |
| [10] |
M.D. Brown, J.R. Hall, M.H. Schoenfisch, Anal. Chim. Acta 1045 (2019) 67-76. DOI:10.1016/j.aca.2018.08.054 |
| [11] |
T. Ubuka, T. Abe, R. Kajikawa, et al., J. Chromatogr. B 757 (2001) 31-37. DOI:10.1016/S0378-4347(01)00046-9 |
| [12] |
M.L.D. Jayaranjan, A.P. Annachhatre, Water Sci. Technol. 67 (2013) 311-318. DOI:10.2166/wst.2012.546 |
| [13] |
C. Wei, Q. Zhu, W. Liu, et al., Org. Biomol. Chem. 12 (2014) 479-485. DOI:10.1039/C3OB41870G |
| [14] |
L. Zhou, L. Xie, C. Liu, et al., Chin. Chem. Lett. 30 (2019) 1799-1808. DOI:10.1016/j.cclet.2019.07.051 |
| [15] |
Z. Shao, C. Zhang, X. Zhu, et al., Chin. Chem. Lett. 30 (2019) 2169-2172. DOI:10.1016/j.cclet.2019.06.023 |
| [16] |
L. Tu, Y. Xu, Q. Ouyang, et al., Chin. Chem. Lett. 30 (2019) 1731-1737. DOI:10.1016/j.cclet.2019.05.022 |
| [17] |
H.A. Henthorn, M.D. Pluth, J. Am. Chem. Soc. 137 (2015) 15330-15336. DOI:10.1021/jacs.5b10675 |
| [18] |
M.D. Hammers, M.J. Taormina, M.M. Cerda, et al., J. Am. Chem. Soc. 137 (2015) 10216-10223. DOI:10.1021/jacs.5b04196 |
| [19] |
G.J. Mao, T.T. Wei, X.X. Wang, et al., Anal. Chem. 85 (2013) 7875-7881. DOI:10.1021/ac401518e |
| [20] |
K. Xiang, Y. Liu, C. Li, et al., Dyes Pigm. 123 (2015) 78-84. DOI:10.1016/j.dyepig.2015.06.037 |
| [21] |
H. Zhang, L. Xu, W. Chen, et al., Anal. Chem. 91 (2019) 1904-1911. DOI:10.1021/acs.analchem.8b03869 |
| [22] |
J. Lv, F. Wang, J. Qiang, et al., Biosen. Bioelectron. 87 (2017) 96-100. DOI:10.1016/j.bios.2016.08.018 |
| [23] |
Y. Chen, C. Zhu, Z. Yang, et al., Angew. Chem. Int. Ed. 52 (2013) 1688-1691. DOI:10.1002/anie.201207701 |
| [24] |
Y. Yang, C. Yin, F. Huo, et al., Sens. Actuators B: Chem. 203 (2014) 596-601. DOI:10.1016/j.snb.2014.07.025 |
| [25] |
Y. Feng, Y. Yang, Y. Wang, et al., Sens. Actuators B: Chem. 288 (2019) 27-37. |
| [26] |
K. Sasakura, K. Hanaoka, N. Shibuya, et al., J. Am. Chem. Soc. 133 (2011) 18003-18005. DOI:10.1021/ja207851s |
| [27] |
D.H. Joo, J.S. Mok, G.H. Bae, et al., Ind. Eng. Chem. Res. 56 (2017) 8399-8407. DOI:10.1021/acs.iecr.7b01115 |
| [28] |
C. Zhao, X. Zhang, K. Li, et al., J. Am. Chem. Soc. 137 (2015) 8490-8498. DOI:10.1021/jacs.5b03248 |
| [29] |
Y. He, Z. Li, Q. Jia, et al., Chin. Chem. Lett. 28 (2017) 1969-1974. DOI:10.1016/j.cclet.2017.07.027 |
| [30] |
H. Song, W. Du, C. Liu, et al., Sens. Actuators B: Chem. 273 (2018) 927-934. DOI:10.1016/j.snb.2018.07.009 |
| [31] |
R.M. Duke, E.B. Veale, F.M. Pfeffer, et al., Chem. Soc. Rev. 39 (2010) 3936-3953. DOI:10.1039/b910560n |
| [32] |
C. Liu, J. Xu, F. Yang, et al., Sens. Actuators B: Chem. 212 (2015) 364-370. DOI:10.1016/j.snb.2015.02.010 |
| [33] |
L. Feng, P. Li, J. Hou, et al., Anal. Chem. 90 (2018) 13341-13347. DOI:10.1021/acs.analchem.8b02857 |
| [34] |
W. Zhang, F. Huo, T. Liu, et al., J. Mater. Chem. B 6 (2018) 8085-8089. DOI:10.1039/C8TB02536C |
| [35] |
Y. Li, Y. Ban, R. Wang, et al., Chin. Chem. Lett. 31 (2020) 443-446. DOI:10.1016/j.cclet.2019.07.047 |
| [36] |
M. Yu, W. Du, H. Li, et al., Biosen. Bioelectron. 92 (2017) 385-389. DOI:10.1016/j.bios.2016.10.090 |
| [37] |
Y. Hou, H. Liu, Z. Li, et al., Anal. Methods 12 (2020) 2835-2840. DOI:10.1039/D0AY00622J |
| [38] |
Z. Li, W. Zhao, X. Li, et al., Inorg. Chem. 51 (2012) 12444-12449. DOI:10.1021/ic3018453 |
| [39] |
P. Wang, S. Xue, X. Yang, Biosen. Bioelectron. 163 (2020) 112283. DOI:10.1016/j.bios.2020.112283 |
| [40] |
X. Yue, J. Wang, J. Han, et al., Chem. Commun. 56 (2020) 2849-2852. DOI:10.1039/C9CC10028H |
| [41] |
L.L. Zhang, H.K. Zhu, C.C. Zhao, et al., Chin. Chem. Lett. 28 (2017) 218-221. DOI:10.1016/j.cclet.2016.07.008 |
| [42] |
J. Li, C. Yin, Y. Zhang, et al., Dyes Pigm. 172 (2020) 107826. DOI:10.1016/j.dyepig.2019.107826 |
| [43] |
T. Zhou, Y. Yang, K. Zhou, et al., Sens. Actuators B: Chem. 301 (2019) 127116. DOI:10.1016/j.snb.2019.127116 |