 2021, Vol. 32


b Key Laboratory of Optoelectronic Devices and Systems of Ministry of Education and Guangdong Province, College of Optoelectronic Engineering, Shenzhen University, Shenzhen 518060, China
Fluorescent bio-probes can concern the localization and quantity of targeted biomacromolecules due to their high sensitivity, specificity, and fast response, which are powerful visualization tools for both analytical sensing and optical imaging [1-3]. Intercalating fluorophores has been widely employed to detect and quantify the presence of duplex DNA or RNA [4-6]. Nucleus imaging is of great importance for understanding cellular processes of genetic expression, proliferation, and growth, etc. Examples of commonly used as fluorophores include quinones, organic conducting salts, SYBR-based dyes, ethidium bromide (EB) and propidium iodide (PI), ferrocene, ruthenium complexes, and ferricyanide derivatives [7-9]. Recently, RNA aptamers have been reported to selectively recognize and detect multiple RNA targets from the nucleus in live cells [10-13]. However, these fluorogenic RNA aptamers probes are currently limited by their low selectivity and specificity toward RNA versus DNA. Poor membrane permeability or potential cytotoxicity is another defect for intracellular imaging. Selectively targeting probes of the cell nucleus remains a challenge, owing to which the small number of fluorogenic dyes are suitable to use in live cells.
Au nanoclusters-incorporated D-peptides and topology-controlled cyclic peptide nanoassemblies were also developed to effectively target and exhibit the fluorescence imaging of the cell nucleus [14, 15]. Further, fluorescent carbon quantum dots-based nanosystems hold great potential in nucleus imaging and nucleus-targeted drug delivery, and cancer therapy [16, 17]. With careful design, some fluorescent nucleobases can be crafted to retain some or most of these properties: hydrogen-bonded base pairing, enzyme and protein recognition, and purine/pyrimidine pairing architecture. Based on these, a large number of nucleus-targeting nucleoside analogues were designed in the last decade. Some have been developed to be important candidates in the searching of antiviral and anticancer drugs due to a strong ability in locating the nucleus in live-cells [18-22].
The AIE luminogens-based bioprobes with lower background noise, higher sensitivity, and nontoxic properties have also been constructed as bimolecular markers for bioimaging and theranostics [23-26]. Different from other intercalating fluorophores listed cyclic peptide, poisonous organic dyes, organometallic complex, carbon quantum dots, metal nanoparticles, or artificial nucleosides, herein we established a novel bioorthogonal nucleus localization system of AIEgens molecular probes. Two nucleoside derivatives named TPE-dU and TPE-dC were synthesized by using 5-iodo-2'-deoxyuridine (5-IdU, 1) or 5-iodo-2'-deoxycytosine (5-IdC, 2) and ethynyl tetraphenylethene (TPE-alkyne, 3) via the Sonogashira cross-coupling reaction (Scheme 1, Figs. S1 and S2 in Supporting information). TPE-dU and TPE-dC were comprised of two components: hydrophobic TPE moiety serves as the "turn-on" long-wavelength fluorescence imaging agent, and ribonucleoside moiety acts as a specific recognition part for targeted DNA/RNA. Regarding present and potential applications of nucleic acid detection and nucleus-targeting cell imaging, we provide the first case in which nucleoside-TPE forms "turn-on" luminescent sensors.

|
Download:
|
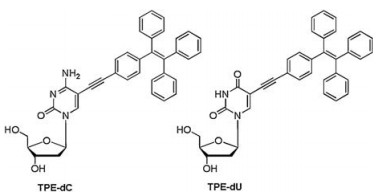
| Scheme 1. Chemical structures of TPE-dC and TPE-dU. | |
To explore their potential biological application of TPE-dC and TPE-dU, the interaction with nucleic acids in an aqueous solution was investigated. In a weak acidic buffer at pH 6.5, the nonemissive TPE-dC and TPE-dU possess good solubility. Calf thymus DNA (ctDNA) as a marker was early used for screening of tumors [27], and RNA from torula yeast as models was applied for the spectrometric titrations. The TPE-dC and TPE-dU in phosphate-buffered saline (PBS) buffer at pH 6.5 are virtually non-luminescent (Figs. 1A and C). Increasing contents of DNA and RNA drive TPE-dC or TPE-dU to aggregate in the areas where are concentrated through affinity between non-canonical nucleosides and nucleic acids, then an increased luminescent occurred. The result shows TPE-mediated luminescence is activated by the addition of ctDNA with low concentration. Increasing the ctDNA concentration further enhances the fluorescence intensity (Figs. 1A and C). In a low concentration of ctDNA with 4−48 ng/μL, the fluorescence intensity records a rapid increase at 470 nm. The fluorescence signal was gradually saturated when the ctDNA concentration is about 40 ng/μL for TPE-dC and 50 ng/μL for TPE-dU, respectively. According to the change of I/I0-1 versus ctDNA concentration, the plot can be satisfactorily fitted to logistic regressive and displays a good linear relationship with an R2 values of 0.996 and 0.997, respectively (Figs. 1B and D).

|
Download:
|
| Fig. 1. (A) Fluorimetric titration of ctDNA to an aqueous solution of TPE-dC in PBS buffer at pH 6.5. (B) A plot of I/I0-1 at 470 nm versus the ctDNA concentration in TPE-dC. I0 = emission intensity in the absence of ctDNA. (C) Fluorimetric titration of ctDNA to an aqueous solution of TPE-dU in PBS buffer at pH 6.5. (D) A plot of I/I0-1 at 470 nm versus the ctDNA concentration in TPE-dU. Concentrations of TPE-dC and TPE-dU are 5 μmol/L; Ex = 365 nm. | |
The main skeletons of TPE-dC and TPE-dU are deoxyribonucleoside, and the interaction affinity between the two above nucleosides analogues and DNA is expected. Both TPE-dC and TPE-dU can bind with ctDNA and TPE-dC is more sensitive than that of TPE-dU, which might be a stronger affinity between TPE-dC and ctDNA. More TPE-dC accumulating closely ctDNA result in the restriction of intramolecular motions and enhance the fluorescence signal, which is equal to the AIE effect. A relatively weak intramolecular interaction occurred between TPE-dU and ctDNA.
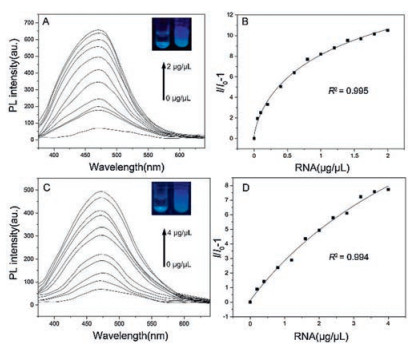
Both TPE-dC and TPE-dU are also applied for RNA detection. The range of detected concentrations was found much higher than that of DNA. It might be most rRNA are single-strand and lacks secondary structure. Although TPE-dC and TPE-dU can attach with rRNA, the intramolecular motions are not strongly restricted in the low concentration of rRNA. The result shows that fluorescence intensity at 470 nm increases with increasing rRNA concentration without a maximum limit, thus indicating a wide dynamic range of rRNA detection by using TPE-dC or TPE-dU (Figs. 2A and C). The TPE-dC can be used to sensitively detect rRNA with the concentration range of 0−2 μg/μL. The plot can be satisfactorily fitted to logistic regressions and displays a good linear relationship with R2 value of 0.995. TPE-dU shows less sensitivity and a higher resolution of rRNA compared with TPE-dC, and displays a good linear relationship with R2 value of 0.994 (Figs. 2B and D).

|
Download:
|
| Fig. 2. (A) Fluorimetric titration of yeast rRNA to an aqueous solution of TPE-dC in PBS buffer at pH 6.5. (B) A plot of I/I0-1 at 470 nm versus the yeast rRNA concentration in TPE-dC. = emission intensity in the absence of yeast rRNA. (C) Fluorimetric titration of yeast rRNA to an aqueous solution of TPE-dU in PBS buffer at pH 6.5. (D) A plot of I/I0-1 at 470 nm versus the yeast rRNA concentration. = emission intensity in the absence of yeast rRNA in TPE-dU. Concentrations of TPE-dC and TPE-dU are 5 μmol/L; Ex = 350 nm. | |
Almost all nucleoside analogues share common characteristics including transport mediated by membrane transporters, activation by intracellular metabolic steps that retain the nucleotide residues in the cell. The potential of the identified nucleoside analogues transport system even could improve patient survival across multiple cancer types where nucleoside analogues are used in cancer treatment [28, 29]. To further explore the potential of AIEgens bio-probes to image nucleus in living cells, fibroblasts L929 are carried out as an example. The properties of AIEgens bio-probes preserving as TPE-dC or TPE-dU can easily penetrate live cells with a compromised plasma membrane and cluster in the nucleus by endocytosis. Firstly, the concentration of bio-probes was been inquired to screen, the AIE efficiency is very obvious with 10 μmol/L of TPE-dC or TPE-dU incubated for 12 h at 37 ℃ (Fig. S3A in Supporting information). Further, the effect of incubation time has also been explored by time course (Fig. S3B in Supporting information).
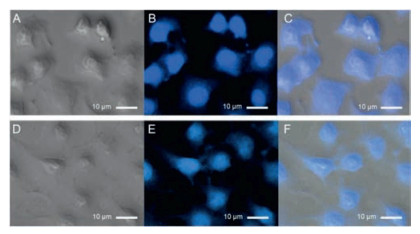
After analyzing the effect of concentration and incubated time, fibroblasts L929 cells were treated with 10 μmol/L of TPE-dC for 4h at 37 ℃ as optimized condition, strong fluorescence has exhibited an emission at 460 nm by CLSM imaging, and TPE-dU was used as a comparison (Figs. 3B and E). The AIE efficiency of TPE-dC is obviously higher than that of the same concentration for TPE-dU (Figs. 3C and F).

|
Download:
|
| Fig. 3. In vitro confocal laser scanning microscopy (CLSM) images of L929 cells treated with TPE-dC (A) bright, (B) at Ex = 370 nm, (C) merge; and TPE-dU (D) bright, (E) at Ex = 370 nm, (F) merge; The incubation concentration of 10 μmol/L using TPE-dC or TPE-dU in the PBS buffer at pH 7.4 for 4 h, and scale bar = 10 μm. | |
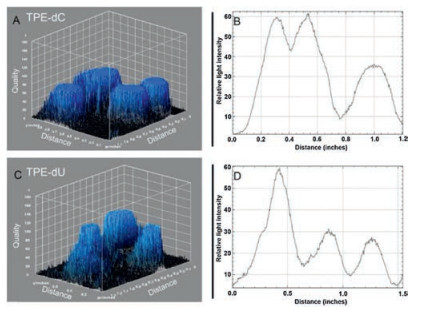
The contour plot shows the intermolecular AIE phenomenon. The bio-probes were used to exhibit the fluorescent quality scores of the stained nucleus in L929 cells, and the four cells were located and calculate by Image J (Fig. 4). The density of sharp peaks on the plot represented fluorescence intensity of TPE-dC is much higher than that of TPE-dU, which reveals the AIE efficiency is stronger for the L929 cells incubated in TPE-dC (Figs. 4A and C). Two distance dispersion diagrams show that the effective numbers of TPE-dC binding with the DNA/RNA of the nucleus in living cells is more than that of TPE-dU, counting the integrated area of peaks (Figs. 4B and D).

|
Download:
|
| Fig. 4. The 3D surface plot was analyzed by Image J software. In vitro confocal laser scanning microscopy (CLSM) images of L929 cells treated with 10 μmol/L of TPE-dC (A, B) or TPE-Du (C, D) for 4 h at 37 ℃. | |
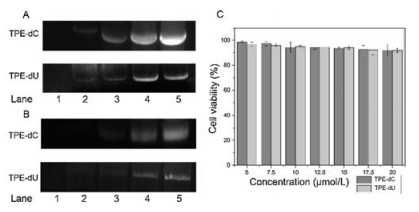
To further explore the possibility of whether the probes can be performed in gel electrophoresis, the gel was stained in TPE-dC or TPE-dU buffer (10 μmol/L). It shows the detection limit of DNA for TPE-dC is low as 250 ng per lane, and TPE-dU is around 500 ng per lane (Figs. 5A and B). The DNA gel imaging of TPE-dC shows a higher resolution due to its stronger binding affinity with the nucleic acid. The result demonstrates this methodology can be applied for the detection and quantification of both DNA and RNA. In aqueous solutions, TPE-dC or TPE-dU form complexes with nucleic acid are mainly driven by molecule affinity forces. In-gel electrophoresis, the intramolecular motions between TPE-dC or TPE-dU and nucleic acid are restricted, and the fluorescence emission of the binding complex is enhanced with increasing DNA or RNA concentration in the gel state. It directly reveals that the AIE process is caused by their gelation aggregate and agrees with previous literature [30, 31]. Relative survival rates of cells are almost identical both in TPE-dC and TPE-dU, and the survival rate of fibroblast cells L929 keep above 90% even at a high concentration (Fig. 5B). The MTT assay for cell viability revealed that these AIEgens bio-probes are noncytotoxic in living cells.

|
Download:
|
| Fig. 5. (A) Staining of DNA (human Histone H3 DNA chain) on PAGE by TPE-dC (up) and TPE-dU (down). The amount of DNA in lanes 1–5: 0, 100, 250, 500, 1000ng; concentrations of TPE-dC or TPE-dU: 10 μmol/L. Staining time: 45 min. (B) Staining of yeast tRNA (Invitrogen, 15401029) on PAGE by TPE-dC (up) and TPE-dU (down). The amount of RNA in lanes 1–5: 0, 1, 2.5, 5, 10 μg concentration of TPE-dC or TPE-dU: 10 μmol/L. Staining time: 45 min. (C) Cell viability assay was treated with the different concentrations of TPE-dC or TPE-dU for 12 h. | |
To our knowledge, this work is the first example of the AIEgens sensor based on 2′-deoxycytosine or 2′-deoxyuridine conjugating tetraphenylethene as AIEgens bio-probes and their biological applications were also investigated. When TPE-dC or TPE-dU binds to the negatively charged DNA or RNA with the affinity interaction, the emission of the binding complexes is turned on due to the restriction of their intramolecular motions. Such an AIE process enables quantitative analysis or visualization of nucleic acids in solution or gels state. Unlike conventional nucleic acid stains, aggregates of TPE-dC and TPE-dU show a high affinity for the nucleus in living cells, and they exhibit intense fluorescence and superior stability. The AIEgens probes can easily penetrate cells with compromised plasma membranes and enter the nucleus of live cells, which indicates that TPE-dC and TPE-dU have a strong nuclear targeting ability. That may because the probes' affinity for DNA is much more similar to the natural structure of DNA biosynthesis, which would minimize the damage to DNA. It is remarkable that TPE-dC has better AIE performance than TPE-dU in the most of above cases. It is possible that cytidine has a better affinity with DNA/RNA sequences or chromosome compared with uridine due to their different chemical structures or pKa values. Furthermore, the biocompatibility and safety of chiral TPE-dC and TPE-dU analogues are being investigated by cell culture assay with potential applications in the delivery of nuclear-targeted drugs or the development of time-lapse microscopy.
Declaration of competing interestThe authors declare that they have no known competing financial interests or personal relationships that could have appeared to influence the work reported in this paper.
AcknowledgmentThis work is supported by the Science and Technology Innovation Commission of Shenzhen, China (Nos. KQJSCX20180328095517269 and JCYJ20170818143131729).
Appendix A. Supplementary dataSupplementary material related to this article canbefound, in the online version, at doi: https://doi.org/10.1016/j.cclet.2021.02.038.
| [1] |
K.G. Chernov, T.A. Redchuk, E.S. Omelina, V.V. Verkhushaa, Chem. Rev. 117 (2017) 6423-6446. DOI:10.1021/acs.chemrev.6b00700 |
| [2] |
X. Wu, W. Shi, X. Li, H. Ma, Acc. Chem. Res. 52 (2019) 1892-1904. DOI:10.1021/acs.accounts.9b00214 |
| [3] |
P. Yang, S. Zhang, X.F. Chen, X.H. Liu, Z. Wang, Y.W. Li, Mater. Horiz. 7 (2020) 746-761. DOI:10.1039/C9MH01197H |
| [4] |
Y.V. Suseela, N. Narayanaswamy, S. Pratihar, T. Govindaraju, Chem. Soc. Rev. 47 (2018) 1098-1131. DOI:10.1039/C7CS00774D |
| [5] |
H.W. Liu, L. Chen, C. Xu, et al., Chem. Soc. Rev. 47 (2018) 7140-7180. DOI:10.1039/C7CS00862G |
| [6] |
L. Yu, P. He, Y.C. Xu, et al., Sens. Actuators B: Chem. 313 (2020) 128015. DOI:10.1016/j.snb.2020.128015 |
| [7] |
H.X. Wu, S.C. Alexander, S.J. Jin, N.K. Devaraj, J. Am. Chem. Soc. 138 (2016) 11429-11432. DOI:10.1021/jacs.6b01625 |
| [8] |
Y.H. He, M. Tsutsui, R.H. Scheicher, X.S. Miao, M. Taniguchi, ACS Sens. 1 (2016) 807-816. DOI:10.1021/acssensors.6b00176 |
| [9] |
K. Deng, L. Wang, Q. Xia, R. Liu, J. Qu, Talanta 192 (2019) 212-219. DOI:10.1016/j.talanta.2018.09.022 |
| [10] |
W.J. Song, R.L. Strack, N. Svensen, S.R. Jaffrey, J. Am. Chem. Soc. 136 (2014) 1198-1201. DOI:10.1021/ja410819x |
| [11] |
C.Y. Cao, P. Wei, R.H. Li, et al., ACS Sens. 4 (2019) 1409-1416. DOI:10.1021/acssensors.9b00464 |
| [12] |
X.J. Chen, D.S. Zhang, N. Su, et al., Nat. Biotechnol. 37 (2019) 1287-1293. DOI:10.1038/s41587-019-0249-1 |
| [13] |
J.H. Wu, S. Zaccara, D. Khuperkar, et al., Nat. Methods 16 (2019) 862-865. DOI:10.1038/s41592-019-0531-7 |
| [14] |
H.M. Wang, Z.Q.Q. Feng, W.Y. Tan, B. Xu, Bioconjugate Chem. 30 (2019) 2528-2532. DOI:10.1021/acs.bioconjchem.9b00524 |
| [15] |
C. Liu, X. Zhang, X. Han, et al., ACS Appl. Bio Mater. 3 (2020) 1934-1943. |
| [16] |
X.W. Hua, Y.W. Bao, F.G. Wee, ACS Appl. Mater. Interfaces 10 (2018) 10664-10677. DOI:10.1021/acsami.7b19549 |
| [17] |
H. Liu, J. Yang, Z. Li, et al., Anal. Chem. 91 (2019) 9259-9265. DOI:10.1021/acs.analchem.9b02147 |
| [18] |
J. Shelton, X. Lu, J.A. Hollenbaugh, et al., Chem. Rev. 116 (2016) 14379-14455. DOI:10.1021/acs.chemrev.6b00209 |
| [19] |
G. Mata, O.P. Schmidt, N.W. Luedtke, Chem. Commun. 52 (2016) 4718-4721. DOI:10.1039/C5CC09552B |
| [20] |
W. Xu, K.M. Chan, E.T. Kool, Nat. Chem. 9 (2017) 1043-1055. DOI:10.1038/nchem.2859 |
| [21] |
K. Nguyen, M. Fazio, M. Kubota, et al., J. Am. Chem. Soc. 139 (2017) 2148-2151. DOI:10.1021/jacs.6b11401 |
| [22] |
O.A. Zasedateleva, V.A. Vasiliskov, S.A. Surzhikov, et al., Nucleic Acids Res. 46 (2018) 17. DOI:10.1093/nar/gky247 |
| [23] |
Y.X. Hu, X.T. Hao, L. Xu, et al., J. Am. Chem. Soc. 142 (2020) 6285-6294. DOI:10.1021/jacs.0c00698 |
| [24] |
S.W. Wang, H. Chen, J. Liu, C.J. Chen, B. Liu, Adv. Funct. Mater. 30 (2020) 2002546. DOI:10.1002/adfm.202002546 |
| [25] |
Z. Zhao, H.K. Zhang, J.W.Y. Lam, B.Z. Tang, Angew Chem. Int. Ed. 59 (2020) 9888-9907. DOI:10.1002/anie.201916729 |
| [26] |
W. Zhu, M.M. Kang, Q. Wu, et al., Adv. Funct. Mater. 30 (2020) 2007026. |
| [27] |
W.H. Liang, Y. Zhao, W.Z. Huang, et al., Theranostics 9 (2019) 2056-2070. DOI:10.7150/thno.28119 |
| [28] |
C.D. Drenberg, A.A. Gibson, S.B. Pounds, et al., Cancer Res. 77 (2017) 2102-2111. DOI:10.1158/0008-5472.CAN-16-2548 |
| [29] |
Z. Zawada, A. Tatar, P. Mocilac, M. Budesinsky, T. Kraus, Angew. Chem. Int. Ed. 57 (2018) 9891-9895. DOI:10.1002/anie.201801306 |
| [30] |
Z.K. Wang, J.Y. Nie, W. Qin, Q.L. Hu, B.Z. Tang, Nat. Commun. 7 (2016) 12033. DOI:10.1038/ncomms12033 |
| [31] |
X. Zhao, L. Zhao, Q. Xiao, H. Xiong, Chin. Chem. Lett. (2020). DOI:10.1016/j.cclet.2020.10.008 |