 2021, Vol. 32


b Engineering Technology Research Institute of PetroChina Xinjiang Oilfield Company, Karamay 834000, China
Petroleum plays a crucial role in global economics and is served as the major energy sources. The oil consumption accounts for about 34% of the world's total fuel consumption in 2016 and 2017, and the Brent spot crude price is 54.19 $ per barrel in 2017 [1]. The depletion in the world's supply of light crude oil and the oil supply shifting to heavy crudes have made these heavy crude oils became important feedstocks [2]. The world heavy oil resource is comprised of about 210 billion barrels of unproved reserves and 299 billion barrels of original reserves [3]. Heavy crudes have poor properties and are more difficult to be processed through conventional technologies such as catalytic cracking, hydrocracking [4-8]. The selective utilization of heavy oil fraction through a prior solvent separation process is widely concerned in refining industry, including solvent deasphalting (SDA) [7-9], the supercritical fluid extraction (SFE) [10, 11] and selective asphaltene extraction (SELEX-Asp) process [12] developed by our research group. Although the processability of extracted fractions were significantly increased, SDA produces a large amount of low value-added de-oil asphalt (DOA), which can be produced in the form of solid particles through granulation [13]. Asphalt consists of larger molecules with high aromaticity and abundant heteroatom (nitrogen, oxygen, and sulfur) [14] and metal (notably nickel and vanadium) contents. The chemical characteristics lead to many upgrading problems such as high yields of coke and catalyst poisoning during processing [7, 15, 16]. It is therefore to seen that high-valued processing and utilization of asphalt are still an important problem facing the petrochemical industry.
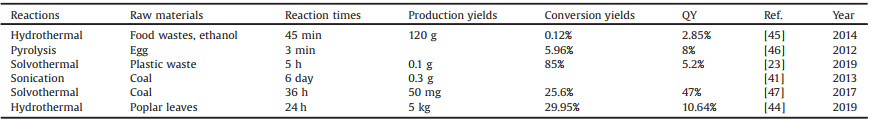
In the view point of traditional refining market, heavy oil is an undesirable feedstock due to the low yield of fuel products. However, its rich natural aromatic structure and heteroatom compounds make it possible to become a precursor for massive carbon materials production. In recent years, since the development of grapheme [17] and carbon dots [18, 19], carbon dots have widely application in W-LEDs [20-23], photocatalysis [24-27], photovoltaic devices [28], water splitting to hydrogen [29-31], fluorescent probes [32-34], solar cells [35], energy storage and conversion [36] and bioimaging [37-40]. The price to produce CDs become the threshold of bring CDs into reality and industry applications. Although precursors from coal [41] and lignin have been reported, the unsimilarity and nonrepeatability make the mass production of CDs impossible. For example, Qiu [42] prepared cheap coal into fluorescent CDs by combining carbonization and acid oxidation corrosion and applied it to copper ion detection. Heavy oils, especially the large produced asphalt after solvent extraction, are rich in high aromatic compounds and heteroatoms, making them potentially become the CDs precursors. Wu [43] prepared petroleum coke into green fluorescent CDs by acid oxidation corrosion and applied it in the field of photocatalysis. We have focused on new approaches to fast, mass production of CDs, as shown inTable 1 [23, 41, 44-47]. In the reported synthesis methods of large-scale production of CDs using coal or petroleum coke as raw materials, the raw materials need to be obtained by neutralization after reflux treatment in the presence of concentrated sulfuric acid and concentrated nitric acid, and the size of the fragments is difficult to control accurately. After the neutral mixture is filtered, the filtrate needs to be dialyzed in a dialysis bag for a few days to remove the salt from the liquid [41]. During acid reflux, neutralization and sneak attack, the preparation cost is increased. In this study, we overcame the disadvantage of obtaining small-molecule raw materials through acid treatment in the conventional method. Petroleum coke was decomposed by supercritical carbon dioxide, and then different sizes of raw materials were obtained through filtration, and then different colors of CDs were obtained through hydrothermal treatment. In previous studies, CDs obtained by mass production usually have blue or green photoluminescence [44], with emission wavelength less than 600 nm, which limits the biological application of CDs.
|
|
Table 1 Methods for large-scale production of CDs. |
Here, for the first time, we successfully fabricated multi-color CDs from the heavy oil and its three SDA products (light deasphalted oil (LDAO), heavy deasphalted oil (HDAO) and asphalt). The CDs from the asphalt has the maximum yield, up to 64% compared to other precursors, the highest so far. The CDs has the benefit of high stability over long time, stability on extreme pH conditions and super low price. The photoluminescence wavelength can be precisely controlled from 350−650 nm covering almost all the fluorescence. Besides pH and time stability, it also shows great potential for cell imaging. When incubated in THP-1 macrophages, the CDs not only exhibit high biocompatibility, but also largely enhance the cell imaging quality. Given the simple synthetic method and excellent performance for various applications, our findings directly contribute to advancing the knowledge of both petroleum based CDs synthesis and applications.
In order to make full use of heavy oils, the heavy oils were pre-separated into three products (LDAO, HDAO and Asphalt) through SDA process. The schematic flow sheet of the solvent deasphalting (SDA) process was shown in Fig. S1 (Supporting information). The operation conditions and yields of three products were shown in Table S1 (Supporting information). The yield of LDAO was the highest, almost 64%, indicating that the quality of the heavy oil has been greatly improved after the SDA process. At the same time, the yield of DOA was not low, about 23.5%, as well. In the petroleum refining industry, the LDAO and HDAO were easily processed fractions compared to heavy oils, which reduced many difficulties in the process of refining. The large amount of low value-added de-oil asphalt in refining industry have great potential in the manufacture of carbon materials. Fig. 1 shows the flow chart of the brief SDA process of heavy oil and the multicolor CDs production from asphalt. In the production of carbon dots, only asphalt has the highest yield compared to other three precursors. The bulk properties of the four precursors including elemental analysis, molecular weight and the average structure parameters based on the 1H NMR spectra [48-50] were summarized in Table S2 (Supporting information). Compared to heavy oil, LDAO and HDAO, the asphalt had higher molecular weight, more oxygen, nitrogen and sulfur contents, and higher carbon/hydrogen atomic ratio. The number of structural units n increased in the order of LDAO (HDAO), VTB and asphalt. Also, the asphalt had the highest aromatic carbon ratio and the lowest naphthenic carbon ratio and alkyl carbon ratio. This indicated that asphalt has more condensed aromatic structures and less naphthenic and aliphatic carbon fraction compared to other three precursors as the average molecular structure depicted inFig. 1.

|
Download:
|
| Fig. 1. Flow chart of the brief SDA process of heavy oil and the multicolor CDs production from asphalt. | |
The molecular composition was investigated by Fourier transform ion cyclotron resonance mass spectrometry (FT-ICR MS). The broadband positive-ion electrospray ionization (ESI) FT-ICR mass spectra of the four precursors were shown in Fig. S2 (Supporting information). The peaks with high intensity in the asphalt mass spectrum were vanadium porphyrins, corresponding to the high vanadium content (957 μg/g shown in Table S1) in the asphalt. Whereas in other three precursors the high intensity peaks were N1 class species (refers there is 1 nitrogen atom in the molecules). The double bond equivalent (DBE) distribution illustrated in Fig. 2A showed that the N1 class species and N1S1 class species (refers there are 1 nitrogen atom and 1 sulfur atom in the molecules) in both negative-ion ESI and positive-ion ESI mode have higher DBE in asphalt. The relative abundance distribution of assigned class species by negative-ion ESI FT-ICR MS (Fig. 2B) reveals that the class species were similar during the four precursors, but the asphalt has higher abundance of multi-heteroatom species. The wide-angle X-ray diffraction (XRD) patterns (Fig. 2C) showed that the LDAO, HDAO and heavy oil have characteristic diffraction γ peak at about 2θ = 19° and almost none graphene layer stacking peak or (002) peak at about 2θ = 25°, illustrating that the three precursors have higher proportion of saturated structures, including aliphatic chains and/or condensed saturated rings. While in asphalt, the doublet of the γ peak and the (002) peak indicated that the asphalt had great quantity of graphite-like ordered structures. This result is consistent with the FT-ICR MS and the 1H-NMR results.

|
Download:
|
| Fig. 2. Characterization of the four precursors. (A) The DBE distribution of four precursors from FT-ICR mass spectra. (B) The relative abundance distribution of assigned class species by negative-ion ESI FT-ICR MS. (C) XRD patterns of four precursors. γ peak and (002) peak are labeled at 2θ = 25° and 19°, respectively. | |
It is obviously to see that the carbon dots yield is closely related to the structure of the precursors. The precursors such as asphalt containing higher molecular weight, more heteroatoms, more aromatic structures, smaller naphthenic structures and aliphatic chains were more conducive to the production of CDs. On the other hand, this structural demand also solves the problem of high value-added utilization of asphalt.
A TEM image of the freshly obtained four color CDs has been acquired. Fig. S3 (Supporting information) showed the high dispersity of the obtained CDs. The TEM image and the diameter size distribution of the acquired CDs directly proved the formation of homogeneous CDs. The size distribution was calculated by counting 200 particles and the lateral sizes of the CDs were directly measured from the TEM images. The average lateral size was found to be 2.39 (R-CDs), 1.77 (Y-CDs), 1.21 (G-CDs) and 1.18 nm (B-CDs), showing a gradual increasing size among the different CDs. The red shift of emission wavelength of CDs may be caused by size effect. The reduction of the band gap caused by π-electron delocalization leads to a redshift in the photoluminescence spectra as the transverse size increases. It is expected that the size distribution and surface heterogeneity have a considerable influence on the emission wavelength.
The four color CDs were irradiated at different excitation wavelengths and the emission characteristics were analyzed using a fluorescence spectrometer. Their photoluminescence spectra were shown in Figs. 3A-D. Fig. 3A shows the emission spectra of B-CDs excited with the range light from 320 nm to 390 nm. The strong emission of B-CDs is at 440 nm with excitation of 350 nm. From Fig. 3B, it is found that the strong emission of G-CDs is at 510 nm when excited at 410 nm. The emission peak of Y-CDs appear at 560 nm when excited at 420 nm (Fig. 3C). The R-CDs demonstrate maximum peak at 610 nm within the range of excitation wavelength from 410 nm to 510 nm (Fig. 3D), while the strong excitation wavelength is at 475 nm. Interestingly, the photoluminescence spectra of four color CDs show that the peak position were not changed and only the intensity of λem altered along with the λex varied. These results showed that multiple excitation bands contribute to one emission, the all of as-prepared CDs have excitement wavelength independent properties, which owe to cross-band interactions exist in the these CDs and the highly homogeneous surface structures and uniform size distributions [ 51]. The yield of blue CDs is the highest, which is 64%, green CDs is 28.3%, yellow CDs is 17.7%, and red CDs is 11.5%. The specific surface area of carbon points increases with the decrease of particle size. The doping of nitrogen changes the surface passivation and local defects. In this way, the surface passivation of CDs with smaller particle size is enhanced, the proportion of oxygen element is reduced, and the internal structure can absorb and emit more fluorescence, so as to improve the photoluminescence quantum yield (PLQY).

|
Download:
|
| Fig. 3. Photoluminescence spectrum of four color CDs (A-D). Optical absorption spectrum (E) and lifetime (F) of the CDs. High-resolution XPS C 1s (G), N 1s (H) and S 2p (I) spectra of the B-CDs, G-CDs, Y-CDs and R-CDs samples. | |
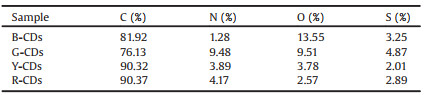
Fig. 3E showed the UV–vis absorption spectra recorded from an aqueous solution of the four color CDs. It should be noted that the UV–vis absorption spectra recorded of the all color CDs had peaks at 235−240 nm due to the π-π* transition of sp2 core carbon. In the case of The Y-CDs and R-CDs, another absorption band was observed at 280−320 nm due to the n-π* transition of carbon functional groups (conjugated C=O and C=N) of the CDs samples [52, 53]. In addition, we found that distinct absorption band appeared at 420 nm and 475 nm in the Y-CDs and R-CDs, respectively. The obvious broadband was attributed to the trapping of excited state energy by the surface states. These peak indicated these two samples possessed n-π* transitions of the aromatic sp2 transition of the conjugated C=N and C=S bonds [51, 54]. On the other hand, it exhibit that UV light cannot excite the Y-CDs and R-CDs emission. In particular, the redshift peak of R-CDs near 450 nm was much wider than that of Y-CDs, which indicates that there were different kinds of surface state transitions on the surface of CDs. Fluorescence decay of the four color CDs (Fig. 3F) are all monoexponential lifetime, the average lifetimes of these CDs emission were 3.8 ns (B-CDs), 3.7 ns (G-CDs), 4.5 ns (Y-CDs) and 3.7 ns (R-CDs) ns for excitations at 350 nm, respectively, which also proved that the as-prepared four color CDs are homogeneous. This was ascribed to the different chemical surface states of pyridinic N and pyrrolic N as discrete excitation trapping centers for the fluorescence emission. Detailed surface chemical state analysis is performed in the XPS spectrum in Figs. 3G-I. The O content in R-CDs was the lowest of the four CDs (Table 2). Previous studies found that the pyrlic N content in R-CDs was relatively low, while the C=O content in R-CDs was higher than C-O [55].
|
|
Table 2 Element compositions of the four color CDs samples as determined via XPS. |
X-ray photoelectron spectroscopy (XPS) findings were used to investigate the surfaces and chemical structures of these samples and gather insights into the PL emission red shift of the samples from blue to red CDs. The four samples consisted of the C, N, O, and S elements. These samples were further analyzed in the high-resolution spectra. In the high-resolution spectra of C 1s [56-58] (Fig. S4 in Supporting information), the peak at 284.6 eV corresponds to the characteristic peak of the sp2 graphitic C-C/C=C. The appearance of peaks centered at 285.5–286.1 eV can be owing to the formation of the sp3 carbon C-O/C-N/C-S. The carbonyl carbons C=O (286.5–287.0 eV) were found in B-CDs, G-CDs and Y-CDs. The peak at 288.8 eV corresponding to carboxyl carbons COOH was found in B-CDs, G-CDs. Previous studies have shown that the effect of carbon oxidation on CDs redshift is negligible [55]. The Nitrogen element was further confirmed by the high resolution N 1s spectrum. Fig. S5 (Supporting information) showed three components suggesting that the nitrogen was integrated into the peaks at pyridinic N (398.4 eV), amino N (399.1 eV), and pyrrolic N (400.2 eV) [58, 59]. The XPS of N 1s indicated that almost all N was doped in the carbon skeleton, resulting in chemical sites. In G-CDs and B-CDs, the content of pyridinic N and pyrrolic N was relatively stable, while the content of pyrrolic N was relatively stable, and N was the main dopant of R-CDs. Since pyrrolidine at the edge of the carbon dots was an important component of the surface defect as the fluorescence center [60], demonstrating that the reduction of pyridinic and the addition of amino N are the reasons for the red shift of R-CDs emission. Two distinct peaks centered at 531.7 and 533.0 eV in the O 1s spectra (Fig. S6 in Supporting information) again confirmed the presence of C=O and C − O [61, 62], respectively. Oxidized surface of the four CDs pointing to that the PL red shift were related to the degree of oxidation of these CDs. The S 2p spectrum was another indicator for the forms of functional groups in the structure. The S 2p spectrum of these findings consisted of two peaks (Fig. S7 in Supporting information) centred at 160.2 eV (S 2p3/2) and 164.3 eV (S 2p1/2) [57, 63], respectively. The result displayed the form of C-S groups covalent bond of S structure.
To further gain insight into how the functional groups or chromosphere influence on the photoluminescence and the PL red shift for these CDs, the C 1s (Fig. 3G), N 1s (Fig. 3H), O 1s (Fig. S8 in Supporting information) and S 2p (Fig. 3I) XPS spectra for four color CDs were carefully examined. In the C 1s (Fig. 3G) XPS spectrum, the four color CDs have obvious change in the peaks of 288.8 eV, the blue CDs has a distinct peak at 288.8 eV (COOH), while there was no peak found in red CDs, indicating that the carboxyl carbons was related to photoluminescence and the PL red shift of the CDs. In the N 1s (Fig. 3H) XPS spectrum, the peaks of the B-CDs to R-CDs had outstanding shifted from 340.2 eV to 398.4 eV, indicating the change in the chemical state of nitrogen element from pyrrolic N to pyridinic N. The results confirmed that the pyrrolic N structure was formed through intramolecular dehydroxylation of carboxyl groups according to the previous research [55]. In this case, it clearly exhibited that pyridinic nitrogen played a dominant factor controlling the photoluminescence and the PL red shift of the CDs. The O 1s XPS spectrum (Fig. S8) of the four color CDs were consistent with C 1s analysis. The XPS intensity at 536.8 eV gradually decreased from sample B-CDs to sample R-CDs, implying a corresponding decrease in the content of carboxyl groups in the CDs. Furthermore, the O atomic content decreased from 13.55% to 2.57% for sample B-CDs to sample R-CDs (Table 2). It is showed that the low degree of oxidation of CDs contributed to the PL red shift. In the S 2p XPS spectrum (Fig. 3I) all peaks were centered at around 164.3 eV (S 2p1/2), while there was no peak found at 160 eV (S 2p3/2, sulfide) in Y-CDs and R-CDs, indicating that the change in the chemical state of sulfur can also lead to the photoluminescence and the PL red shift. In the present work, the PL features can undoubtedly be attributed to the surface states of the CDs.
The results from neutral red uptake assay indicated a significant decrease of cellular viability after exposure to 100μg/mL R-CDs (P < 0.05). At the concentrations lower than 100 μg/mL, treatment with R-CDs did not significantly affect the viability of THP-1 macrophages (Fig. 4A). The results from flow cytometry indicated that after the treatment with R-CDs, THP-1 macrophages were stained with red fluorescence, although there was no obvious concentration-dependent relationship (Fig. 4B). The results from confocal microscopy further confirmed that THP-1 macrophages treated with R-CDs were labeled with red fluorescence (Fig. 4C).

|
Download:
|
| Fig. 4. The toxicity and labeling of RCDs to THP-1 macrophages. (A) THP-1 macrophages were exposed to various concentrations of R-CDs for 24h. After exposure, the cellular viability was measured by using neutral red uptake assay. *P < 0.05, compared with control. (B) THP-1 macrophages were exposed to 12.5 and 25μg/mL R-CDs for 24h and then the fluorescence was analyzed by flow cytometry. (C) THP-1 macrophages were labeled with 25μg/mL R-CDs and then imaged with confocal microscope. Scale bar: 20 μm. | |
In a word, highly fluorescent multi-color petroleum based CDs of four colors were synthesized by simple hydrothermal method using four components obtained from the separation of heavy oil. Our CDs fluorescence emission was strong, and had the advantages of easy preparation, low toxicity and high yield. The highest quantum yield was 64%. The red petroleum-based quantum dots were successfully applied to the imaging of macrophages. Therefore, this work proposes an easily adaptable fluorescency-based solution that can be applied to the environmental, energy and biomedical fields, and also solves the problem of high value-added utilization of asphalt.
Declaration of competing interestThe authors report no declarations of interest.
AcknowledgmentsWe thank Beijing Nova Program Interdisciplinary Studies Cooperative Project (No. Z181100006218138), Science Foundation of China University of Petroleum (Nos. 2462020YXZZ018, 2462019QNXZ02, 2462018BJC004) for the support.
Appendix A. Supplementary dataSupplementarymaterial related to this article canbefound, in the online version, at doi: https://doi.org/10.1016/j.cclet.2020.09.053.
| [1] |
B. Dudley, BP Statistical Review of World Energy 2018 (http://www.environmentportal.in/files/file/bp-stats-review-2018-full-report.pdf).
|
| [2] |
A.M. Alrashoud, Process. Heavy Crude Oils 2015 (https://doi.org/10.2118/175328-MS).
|
| [3] |
R.F. Meyer, World Heavy Crude Oil Resources, The 15th World Petroleum Congress, World Petroleum Congress, 1997 (https://www.onepetro.org/conference-paper/WPC-29196).
|
| [4] |
J.G. Speight, Annu. Rev. Energy 11 (1986) 253-274. DOI:10.1146/annurev.eg.11.110186.001345 |
| [5] |
A.M. McKenna, J.M. Purcell, R.P. Rodgers, A.G. Marshall, Energy Fuels 23 (2009) 2122-2128. DOI:10.1021/ef800999e |
| [6] |
K.H. Altgelt, Fuel Abstr, Curr. Titles 36 (1995) 20. |
| [7] |
G. Brons, J.M. Yu, Energy Fuels 9 (1995) 641-647. DOI:10.1021/ef00052a011 |
| [8] |
R.L. Hood, P.B. Rettger, Patent, CA2265596 A1, 1999.
|
| [9] |
S.L. Chen, S.S. Jia, Y.H. Luo, S.Q. Zhao, Fuel 73 (1994) 439-442. DOI:10.1016/0016-2361(94)90100-7 |
| [10] |
G. Yang, R.A. Wang, J. Pet. Sci. Eng. 22 (1999) 47-52. DOI:10.1016/S0920-4105(98)00056-4 |
| [11] |
S.Q. Zhao, Z.M. Zu, R.A. Wang, Chin. J. Chem. Eng. 11 (2003) 691-695. |
| [12] |
S. Zhao, C. Xu, X. Sun, et al., Oil Gas J. 108 (2010) 52-59. |
| [13] |
S. Zhao, C. Xu, R.A. Wang, et al., Patent, US7597794 B2, 2009.
|
| [14] |
S.K. Panda, J.T. Andersson, W. Schrader, Angew. Chem. Int. Ed. 48 (2009) 1788-1791. DOI:10.1002/anie.200803403 |
| [15] |
K. Qian, R.P. Rodgers, C.L. Hendrickson, M.R. Emmett, A.G. Marshall, Energy Fuels 15 (2001) 492-498. DOI:10.1021/ef000255y |
| [16] |
K. Qian, D.C. Tomczak, E.F. Rakiewicz, R.H. Harding, A.W. Peters, Energy Fuels 11 (1997) 596-601. DOI:10.1021/ef960204u |
| [17] |
K.S. Novoselov, A.K. Geim, S.V. Morozov, Science 306 (2004) 666-669. DOI:10.1126/science.1102896 |
| [18] |
X. Sun, Y. Li, Angew. Chem. Int. Ed. 43 (2004) 597-601. DOI:10.1002/anie.200352386 |
| [19] |
X.Y. Du, C.F. Wang, G. Wu, S. Chen, Angew. Chem. Int. Ed. (2020) 10.1002/anie.202004109. DOI:10.1002/anie.202004109 |
| [20] |
L. Ma, W. Xiang, H. Gao, et al., J. Mater. Chem. C 3 (2015) 6764-6770. DOI:10.1039/C5TC00918A |
| [21] |
Y. Liu, M. Zhang, Y. Wu, et al., Chem. Commu. 55 (2019) 12164-12167. DOI:10.1039/c9cc05581a |
| [22] |
S. Lu, L. Sui, J. Liu, et al., Adv. Mater. 29 (2017) 1603443. DOI:10.1002/adma.201603443 |
| [23] |
H.Q. Song, X.J. Liu, B.Y. Wang, Z.Y. Tang, S.Y. Lu, Sci. Bull. 64 (2019) 1788-1794. DOI:10.1016/j.scib.2019.10.006 |
| [24] |
J. Hou, H. Cheng, C. Yang, O. Takeda, H. Zhu, Nano Energy 18 (2015) 143-153. DOI:10.1016/j.nanoen.2015.09.005 |
| [25] |
S. Fang, Y. Xia, K. Lv, et al., Appl. Catal. B 185 (2016) 225-232. DOI:10.1145/2993148.2993201 |
| [26] |
R. Wang, K.Q. Lu, Z.R. Tang, Y.J. Xu, J. Mater. Chem. A 5 (2017) 3717-3734. DOI:10.1039/C6TA08660H |
| [27] |
W. Wu, Q. Zhang, R. Wang, et al., ACS Catal. 8 (2018) 747-753. DOI:10.1021/acscatal.7b03423 |
| [28] |
Y.Q. Zhang, D.K. Ma, Y.G. Zhang, W. Chen, S.M. Huang, Nano Energy 2 (2013) 545-552. DOI:10.1016/j.nanoen.2013.07.010 |
| [29] |
J. Liu, Y. Liu, N. Liu, et al., Science 347 (2015) 970-974. DOI:10.1126/science.aaa3145 |
| [30] |
T.F. Yeh, C.Y. Teng, S.J. Chen, H. Teng, Adv. Mater. 26 (2014) 3297-3303. DOI:10.1002/adma.201305299 |
| [31] |
B.C.M. Martindale, G.A.M. Hutton, C.A. Caputo, E. Reisner, J. Am. Chem. Soc. 137 (2015) 6018-6025. DOI:10.1021/jacs.5b01650 |
| [32] |
Y. Liu, J.F. Wei, W.D. Xiang, et al., Chin. Chem. Lett. (2020) 10.1016/j.cclet.2020.05.037. DOI:10.1016/j.cclet.2020.05.037 |
| [33] |
C. Yu, Y. Wu, F. Zeng, S. Wu, J. Mater. Chem. B 1 (2013) 4152-4159. DOI:10.1039/c3tb20686f |
| [34] |
C. Yu, X. Li, F. Zeng, F. Zheng, S. Wu, Chem. Commun. 49 (2013) 403-405. DOI:10.1039/C2CC37329G |
| [35] |
W. Hui, Y. Yang, Q. Xu, et al., Adv. Mater. 32 (2020) 1906374. DOI:10.1002/adma.201906374 |
| [36] |
L. Cao, S. Sahu, P. Anilkumar, et al., J. Am. Chem. Soc. 133 (2011) 4754-4757. DOI:10.1021/ja200804h |
| [37] |
A.L. Antaris, J.T. Robinson, O.K. Yaghi, et al., ACS Nano 7 (2013) 3644-3652. DOI:10.1021/nn4006472 |
| [38] |
B.Y. Wang, J. Li, Z.Y. Tang, B. Yang, S.Y. Lu, Sci. Bull. 64 (2019) 1285-1292. DOI:10.1016/j.scib.2019.07.021 |
| [39] |
H. Wang, J. Wei, C.H. Zhang, et al., Chin. Chem. Lett. 31 (2020) 759-763. DOI:10.1016/j.cclet.2019.09.021 |
| [40] |
J. Zhong, X.M. Chen, M.R. Zhang, et al., Chin. Chem. Lett. 31 (2020) 769-773. DOI:10.1016/j.cclet.2020.01.007 |
| [41] |
R. Ye, C. Xiang, J. Lin, et al., Nat. Commun. 4 (2013) 2943. DOI:10.1038/ncomms3943 |
| [42] |
C. Hu, C. Yu, M. Li, et al., Small 10 (2014) 4926-4933. DOI:10.1002/smll.201401328 |
| [43] |
X. Shao, W. Wu, R. Wang, et al., J. Catal. 344 (2016) 236-241. DOI:10.1016/j.jcat.2016.09.006 |
| [44] |
W.D. Li, Y. Liu, B.Y. Wang, et al., Chin. Chem. Lett. 30 (2019) 2323-2327. DOI:10.1016/j.cclet.2019.06.040 |
| [45] |
S.Y. Park, H.U. Lee, E.S. Park, et al., ACS Appl. Mater. Interfaces 6 (2014) 3365-3370. DOI:10.1021/am500159p |
| [46] |
J. Wang, C.F. Wang, S. Chen, Angew. Chem. Int. Ed. 51 (2012) 9297-9301. DOI:10.1002/anie.201204381 |
| [47] |
M.Y. Li, C. Yu, C. Hu, et al., Chem. Eng. J. 320 (2017) 570-575. DOI:10.3390/e19110570 |
| [48] |
E.M. Dickinson, Fuel 59 (1980) 290-294. DOI:10.1016/0016-2361(80)90211-2 |
| [49] |
J.K. Brown, W.R. Ladner, Fuel 39 (1960) 87-96. |
| [50] |
L. Rongbao, S. Zengmin, L. Bailing, Fuel 67 (1988) 565-569. DOI:10.1016/0016-2361(88)90355-9 |
| [51] |
D. Qu, Z. Sun, M. Zheng, et al., Adv. Opt. Mater. 3 (2015) 360-367. DOI:10.1002/adom.201400549 |
| [52] |
D. Qu, M. Zheng, L. Zhang, et al., Sci. Rep. 4 (2014) 5294. DOI:10.1038/srep05294 |
| [53] |
X. Miao, D. Qu, D. Yang, et al., Adv. Mater. 30 (2018) 1704740. DOI:10.1002/adma.201704740 |
| [54] |
D. Qu, M. Zheng, P. Du, et al., Nanoscale 5 (2013) 12272-12277. DOI:10.1039/c3nr04402e |
| [55] |
W. Cai, T. Zhang, M. Xu, et al., J. Mater. Chem. C 7 (2019) 2212-2218. DOI:10.1039/c9tc00274j |
| [56] |
H. Ding, S.B. Yu, J.S. Wei, H.M. Xiong, ACS Nano 10 (2016) 484-491. DOI:10.1021/acsnano.5b05406 |
| [57] |
Q. Xu, Y. Liu, C. Gao, et al., J. Mater. Chem. C 3 (2015) 9885-9893. DOI:10.1039/C5TC01912E |
| [58] |
K. Jiang, S. Sun, L. Zhang, et al., Angew. Chem. Int. Ed. 54 (2015) 5360-5363. DOI:10.1002/anie.201501193 |
| [59] |
Y. Wang, S.H. Kim, L. Feng, Anal. Chim. Acta 890 (2015) 134-142. DOI:10.1016/j.aca.2015.07.051 |
| [60] |
M. Zhao, F. Yang, Y. Xue, D. Xiao, Y. Guo, ChemPhysChem 15 (2014) 950-957. DOI:10.1002/cphc.201301137 |
| [61] |
Y. Xu, M. Wu, Y. Liu, et al., Chem. Eur. J. 19 (2013) 2276-2283. DOI:10.1002/chem.201203641 |
| [62] |
H. Ding, J.S. Wei, H.M. Xiong, Nanoscale 6 (2014) 13817-13823. DOI:10.1039/C4NR04267K |
| [63] |
Q. Xu, P. Pu, J. Zhao, et al., J. Mater. Chem. A 3 (2015) 542-546. DOI:10.1039/C4TA05483K |