 2021, Vol. 32


Combining two properties into one molecule is an effective way to obtain bifunctional molecular materials. Lanthanide compounds are excellent candidates for the construction of luminescent single-molecule magnets (SMMs) because they exhibit characteristic luminescence with well-resolved emission bands and long lifetimes and, meanwhile, show large single-ion magnetic anisotropy due to the presence of large unquenched orbital angular momentum and strong spin-orbit coupling [1-3]. While a number of lanthanide complexes were synthesized showing coexistence of luminescence and SMM behavior, manipulation of the two functions in a synergistic manner remains to be a challenging task. Only a few dysprosium complexes were reported exhibiting simultaneous switch of luminescence and magnetic dynamics through mechanical force [4, 5], light irradiation [6-8] and thermal treatment [9-11]. The erbium and ytterbium complexes are similar to the dysprosium ones in some way because they also possess Kramers ground states with strong magnetic anisotropy [12-16]. They further distinct themselves from the dysprosium ones in their characteristic emission in near infrared (NIR) instead of visible region which feature is appealing for applications in material science and biotechnologies [17]. However, although luminescent Er- and Yb-SMMs are not uncommon [1-3, 18-22], synergistic switching of magnetic and optical properties has never been documented for Er- and Yb-based compounds.
Herein we report two isostructural dinuclear complexes Ln2L2(depma2)Cl2 (1-Ln, Ln=Yb and Er) incorporating a thermo-responsive pre-photodimerized 9-diethyl-phosphonomethylanthracene (depma2) as bridging ligand, and N1, N3-bis(salicylideneimino)diethylenetriamine (H2L) as terminal ligand, as an extension of our previous work on dysprosium complex [11]. Upon heating, the depma2 ligand in 1-Ln undergoes thermo-induced de-dimerization at ca. 170 ℃ forming mononuclear species LnL(depma)Cl (2-Ln), followed by thermo-induced elimination of CH3CH2Cl at about 250 ℃ forming LnL(epma) (3-Ln, epma=9-ethylphosphonomethylanthrancene). The two consecutive structural transformations are accompanied with the turn-on of photoluminescence in visible and/or NIR regions originating from the anthracene excimer and lanthanide ion, respectively, and acceleration of magnetic relaxation at low temperature. To our knowledge, 1-Ln are the first examples of Yb- and Er-based compounds showing synergetic switching of magnetic and optical properties upon external stimulus.
Complexes 1-Ln were synthesized by reacting LnCl3·6H2O with depma2, H2L and Et3N in methanol solution at room temperature. The two complexes are isostructural and crystallize in the orthorhombic space group Pbca (Table S1 in Supporting information, ESI†). 1-Yb is selected as a representative for a detailed structural description. The asymmetric unit of 1-Yb consists of one YbⅢ, one L2−, one Cl− and half depma2. The YbⅢ ion is ligated by two oxygen (O4, O5) and three nitrogen (N1, N2, N3) atoms from L2− in the equatorial plane [Yb1-O: 2.156(3)-2.163(3) Å, Yb1-N: 2.486(3)-2.517(3) Å], and one oxygen (O1) from depma2 and one Cl− (Cl1) anion in the axial positions [Yb1-O1: 2.233(2) Å, Yb1-Cl: 2.604(1) Å] (Fig. 1, Fig. S3 and Table S2 in Supporting information). The geometry of the {YbN3O3Cl} core is best described as a pentagonal bipyramid, according to the Continuous Shape Measure (CShM=0.498) analyses (Table S3 in Supporting information) [23]. The metal centers are related through a center of crystallographic inversion symmetry to form a dinuclear molecule (Fig. 1a). The Yb⋯Yb distance within the dimer is 15.193(1) Å. Neighboring dimers are linked by N-H⋯Cl hydrogen bonds (N⋯Cl: 3.399Å) to form a supramolecular layer (Fig. 1b and Table S4 in Supporting information). These layers are further stacked in staggered manner along the b-axis and stabilized by van der Waals interactions (Fig. S3). The shortest intermolecular Yb···Yb distance is 7.003(5) Å.

|
Download:
|
| Fig. 1. (a) Molecular structure of complex 1-Yb with an atomic labelling scheme (50% probability). (b) Supramolecular layer structure of 1-Yb formed by hydrogen bonds. | |
The coordination geometry of Er in 1-Er is identical to that of Yb. The geometry of the {ErN3O3Cl} core is also best described as a pentagonal bipyramid (CShM=0.487) (Table S3). The bond distances are Er1-O: 2.160(3)-2.236(3) Å, Er1-N: 2.486(3)-2.517(4) Å and Er1-Cl: 2.605(1) Å, respectively. The shortest intermolecular Er···Er distance is 7.030(7) Å (Fig. S4 and Table S2 in Supporting information).
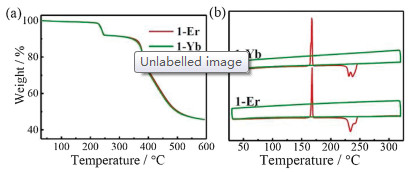
As the pre-photodimerized dianthracene derivatives can cleave to monomers upon heating, thermal analyses were conducted for 1-Ln. Although the weight keeps almost constant in the TG curves below 200 ℃ (Fig. 2a), the DSC curves show an exothermic peak at 168 ℃ for 1-Yb (ΔH=47.79 kJ/mol) and 1-Er (ΔH=44.27 kJ/mol) (Fig. 2b). This is ascribed to the dissociation of depma2 in 1-Ln, proved by in-situ variable temperature infrared (IR) spectra. As shown in Figs. S5 and S6 (Supporting information), upon heating 1-Ln to 175 ℃, peaks at 1250 and 878 cm−1 emerge corresponding to the C-H in-plane and out-of-plane bending vibrations of anthracene [24]. The dissociation of depma2 in 1-Ln leads to the formation of monomeric species LnL(depma)Cl (2-Ln). Moreover, the DSC curves show another endothermic doublet peak at 231 and 237 ℃ for 1-Yb and 234 and 240 ℃ for 1-Er, with the total enthalpy values of 35.3 and 32.8 kJ/mol, respectively. TG analyses suggest the release of one molecule of CH 3CH2Cl in the range of 200–250 ℃ for both 1-Yb and 1-Er (obs. 7.4%, calcd. 7.8%) (Fig. 2a), which is further confirmed by the TG-MS analysis (Fig. S7 in Supporting information). The release of CH3CH2Cl is a result of intramolecular solid-state reaction between the ethyl group of depma and the coordinated Cl− anion at elevated temperature, which phenomenon is unusual and was previously observed only in rare cases of coordination systems [11, 25]. The elimination of chloroethane in 2-Ln is associated with the broken of one C-O(P) bond of depma, leading to LnL(epma) (3-Ln, epma−=9-ethylphosphonomethylanthracene anion). This process can be monitored byin-situ IR spectra of 1-Ln. Indeed, the peak intensity of the P-O stretching vibration at 1016 cm−1 decreases with increasing temperature, and finally the peak disappears above 200 ℃ (Figs. S5 and S6). The molecular formulae of 2-Ln and 3-Ln were confirmed by elemental analyses. The powder XRD measurements corroborate that the structures of 1-Ln, 2-Ln and 3-Ln are different from each other (Fig. S8 in Supporting information), but identical to the corresponding Dy and Gd analogues [11]. The single crystallinity of 1-Ln is not retained after thermal treatment.

|
Download:
|
| Fig. 2. (a) TG and (b) DSC curves for complexes 1-Yb and 1-Er, measured under nitrogen atmosphere at a heating rate of 5 ℃/min. | |
The diffuse reflectance spectra of all of the complexes show absorption bands in the range of 200–450 nm, originating from theπ–π* transitions of the ligands (Figs. S9 and S10 in Supporting information). Besides, 1-Yb, 2-Yb and 3-Yb show the Yb3+ f-f absorption peaks appearing at 912 and 968 nm, ascribed to the transition of2F7/2-2F5/2 [24]. For 1-Yb and 2-Yb, the peak at 912 nm is more intensive, while for 3-Yb, the peak at 968 nm is more intensive (Fig. S9). For 1-Er and 2-Er, similar Er3+ f-f absorption peaks appear at 453 (4I15/2-4F5/2), 490 (4I15/2-4F7/2), 521 (4I15/2-2H11/2), 530, 544, 548 (4I15/2-4S3/2), 646, 656, 664, 675 (4I15/2-4F9/2) and 796 nm (4I15/2-4I9/2) [26]. Notably, 3-Er shows the same transition but the absorption intensities are slightly changed (Fig. S10). The slight differences in absorption bands of 3-Ln from those of 1-Ln and 2-Ln are related to the change in the coordination environment of Ln in 3-Ln due to the release of coordination Cl−.
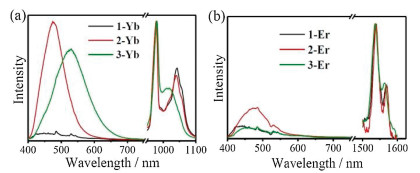
Luminescence spectra of all complexes were measured in order to study the effect of structural changes on the photophysical properties. For Yb-complexes, when excited at 310 nm, 1-Yb is not emissive in the visible region, but emissive in the NIR region (Fig. 3a). It exhibits well-resolved multiline emission bands at 979 and 1041 nm, in which the former is the most intensive one. The emission bands are attributed to the transition from the first excited state2F5/2 to the manifold ± m sublevels of the ground state 2F7/2 of the YbⅢ ion as a consequence of ligand-field effect [27]. The quench of the ligand emission together with the observation of the characteristic NIR emission of YbⅢ ion suggest an efficient energy transfer from the ligand to YbⅢ ion. For 2-Yb, characteristic NIR emission is again observed. Unlike 1-Yb, however, it also shows a broad emission at 476 nm, attributed to the formation of excimer of staggeredπ−πstacked anthracene groups in the structure [28]. The quantum yield (QY) and average lifetime (τav) are 1.57% and 4.34ns, respectively (Fig. S13a and Table S5 in Supporting information). Complex 3-Yb also exhibits dual emissions in the visible and NIR regions. In this case, the ligand-centered emission peak is red-shifted to 530 nm (QY=1.40%, τav=10.84ns) (Fig. S13b in Supporting information), corresponding to the excimer of face-to-faceπ−πstacked anthracene groups [6, 11]. In the NIR region, 3-Yb shows the emission at 981 and 1011 nm, also ascribed to the2F5/2→2F7/2 transition of YbⅢ. The results indicate that energy transfer occurs from the triplet state of ligand to both the YbⅢ ion and the anthracene excimer in 2-Yb and 3-Yb. The 2F5/2 (Yb) lifetimes are explored for 1-Yb, 2-Yb and 3-Yb. The emission decay profiles can be well fitted with single exponential functions, yielding lifetime of 4.2–4.4μs (Fig. S16 and Table S6 in Supporting information).

|
Download:
|
| Fig. 3. The solid-state emission spectra (excited at 310 nm) for complexes 1-Ln, 2-Ln and 3-Ln at visible and NIR regions. | |
For Er-complexes, although weak emission bands are observed in visible region for all three complexes, their quantum yields are close to zero. However, they exhibit emission in NIR region at 1538 and 1564 nm (Fig. 3b and Fig. S12 in Supporting information), corresponding to the 4I13/2→4I15/2 transition of ErⅢ ion [27]. Noting that emission in visible region is found for 2-Yb and 3-Yb but not for 2-Er and 3-Er, an efficient energy transfer from the π−πstacked anthracene excimer to ErⅢ ion could occur. This is in agreement with the fact that the energy gap between the ground and excited state of ErⅢ ion (4I13/2 to 4I15/2) is lower than that of YbⅢ ion (2F5/2 to 2F7/2). However, the 4I13/2 (Er) lifetime is not detectable for all Er complexes (Fig. S17 in Supporting information).
The structural transformation of 1-Ln upon heating is also reflected by their magnetic properties. The temperature dependent dc magnetic susceptibilities (Fig. S18 in Supporting information) reveal that the room temperature χMT values (per Ln) of 2.50 (1-Yb), 2.50 (2-Yb), 2.49 (2-Yb), 11.18 (1-Er), 11.18 (2-Er), and 11.19 (3-Er) cm3 K mol−1 agree well with the theoretical values of 2.57 cm3 K mol−1 for YbⅢ and 11.48 cm3 K mol−1 for ErⅢ. In all cases, the χMT decreases progressively upon cooling, attributed to the depopulation of the MJ levels and possible weak antiferromagnetic interactions. The unsaturation of the magnetization as well as the non-superimposition of M vs. H/T plots suggest the presence of significant magnetic anisotropy and/or low-lying excited states in 1-Ln, 2-Ln and 3-Ln (Figs. S19–S24 in Supporting information).
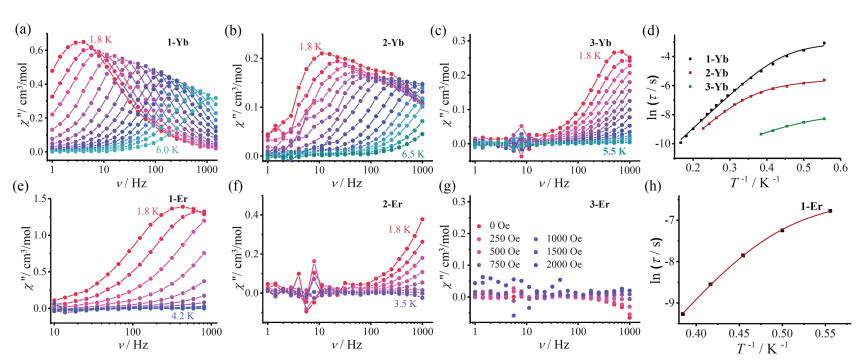
To investigate the magnetic dynamics of these complexes, ac magnetic susceptibilities were performed at low temperatures. All show field-induced magnetic relaxations except 3-Er which does not show any in-phase (χ') and out-of-phase (χ") signals even under an external field of 2kOe (Fig. 4 and Figs. S25–S30 in Supporting information). For Yb-complexes, the χ' and χ" vs. frequency plots were measured under a dc field of 1kOe. The relaxation time (τ) was extracted by fitting the Cole-Cole plots using a generalized Debye model (Tables S7–S9 in Supporting information). The lnτ vs. T−1 curve can be best fit by considering the direct and Orbach processes using Eq. 1 (Fig. 4d) [29], whereUeff represents the energy barrier. The resulted parameters are Ueff=23.5K, τ0=1.2×10⁻⁶ s and A=13.5 s−1K−1 for 1-Yb, Ueff=22.3K, τ0=9.1×10⁻⁷ s and A=161.9s−1K−1 for 2-Yb and Ueff=13.1K, τ0=9.4×10⁻⁷ s and A=1787.2 s−1K−1 for 3-Yb. Compared with 1-Yb, the energy barrier of 2-Yb is quite close indicating that the dissociation of dianthracene poses little influence on the coordination geometry of YbⅢ ion. However, the energy barrier of 3-Yb drops nearly a half, which is consistent with the change of coordination geometry of YbⅢ ion due to the release of coordination Cl− anion. These Ueff values are comparable to those of the other YbⅢ-based complexes showing field-induced SMM behavior (2.0–54.7K) [1, 2, 13, 18-22, 30].

|
(1) |

|
Download:
|
| Fig. 4. Frequency dependence of χ′′ signals measured at 1kOe dc field for (a)1-Yb, (b) 2-Yb and (c) 3-Yb at the depicted temperatures. (d) Plots of ln τ vs. T−1 for 1-Yb, 2-Yb and 3-Yb. Frequency dependence of χ" signals measured at 0.75kOe dc field for (e)1-Er and (f) 2-Er at the depicted temperatures. (g) Frequency dependence of χ" signals of 3-Er in the indicated dc fields at 2.0K. (h) Plots of lnτ vs. T−1 for 1-Er. | |
For 1-Er, clear frequency dependent peaks for χ" were observed under a dc field of 0.75kOe (Fig. 4e and Fig. S28). The lnτ vs. T−1 curve can also be fitted by Eq. 1 (Fig. 4h), with the parameters ofUeff=24.6K, τ0=7.9×10⁻⁹ s and A=415.3 s−1K−1. The energy barrier is within the range of those previously reported for field-induced ErⅢ SMM complexes (7.5–34.8K) [1, 2, 18, 20, 30]. For 2-Er, the out of phase ac susceptibility data exhibit the frequency dependence below 3.5K, but no maximum appears (Fig. 4f and Fig. S29 in Supporting information). Therefore, we cannot obtain the energy barrier of 2-Er from the Eq. 1. Moreover, complex 3-Er does not show any ac signals (Fig. 4g and Fig. S30). The significant decrease of energy barrier of 2-Er comparing to that of 1-Er and the switch-off of slow magnetic relaxation behavior of 3-Er suggest that the structural transformations associated with the dissociation of dianthracene moieties and the release of CH3CH2Cl could have more significant influence on the magnetic anisotropy of ErⅢ than that of YbⅢ ion.
In summary, we report the first examples of Yb- and Er-complexes incorporating a pre-photodimerized dianthracene ligand, Ln2L2(depma2)Cl2 (1-Ln, Ln=Yb and Er). Both experience a two-step thermo-induced structural transformation, first the dissociation of dianthracene and then the release of CH3CH2Cl. The consecutive phase transitions are accompanied by simultaneous change of the photoluminescence in the visible and NIR regions at room temperature and also magnetic dynamics at low temperature. This work provides a feasible route to the design of bifunctional Yb- and Er-based materials with synergetic and switchable magneto-optical properties. These properties together with their ability in emitting NIR luminescence may have potential applications in material science and biotechnology.
Declaration of competing interestThe authors report no declarations of interest.
AcknowledgmentsThis work was supported by grants from the National Key R & D Program of China (Nos. 2017YFA0303203, 2018YFA0306004) and the National Natural Science Foundation of China (No. 21731003). We thank Prof. Xi-Zhang Wang for his kind assistance in TG-MS measurements.
Appendix A. Supplementary dataSupplementarymaterial related to this article canbefound, in the online version, at doi:https://doi.org/10.1016/j.cclet.2020.10.019.
| [1] |
J. Long, Y. Guari, R.A.S. Ferreira, L.D. Carlos, J. Larionova, Coord. Chem. Rev. 363 (2018) 57-70. |
| [2] |
J.H. Jia, Q.W. Li, Y.C. Chen, J.L. Liu, M.L. Tong, Coord. Chem. Rev. 378 (2019) 365-381. |
| [3] |
(a) J. Long, Front. Chem. 7 (2019) 63; (b) F. Pointillart, B. le Guennic, O. Cador, et al., Acc. Chem. Res. 48 (2015) 2834-2842. |
| [4] |
X.D. Huang, M. Kurmoo, S.S. Bao, et al., Chem. Commun. 54 (2018) 3278-3281. |
| [5] |
W.B. Chen, Y.C. Chen, J.L. Liu, et al., Inorg. Chem. 56 (2017) 8730-8734. DOI:10.1021/acs.inorgchem.7b01059 |
| [6] |
X.D. Huang, Y. Xu, K. Fan, et al., Angew. Chem. Int. Ed. 57 (2018) 8577-8581. DOI:10.1002/anie.201804102 |
| [7] |
X.D. Huang, J.G. Jia, M. Kurmoo, S.S. Bao, L.M. Zheng, Dalton Trans. 48 (2019) 13769-13779. DOI:10.1039/c9dt02854d |
| [8] |
Y.J. Ma, J.X. Hu, S.D. Han, et al., J. Am. Chem. Soc. 142 (2020) 2682-2689. DOI:10.1021/jacs.9b13461 |
| [9] |
S. Mohapatra, B. Rajeswaran, A. Chakraborty, A. Sundaresan, T.K. Maji, Chem. Mater. 25 (2013) 1673-1679. DOI:10.1021/cm400116h |
| [10] |
Y. Xin, J. Wang, M. Zychowicz, et al., J. Am. Chem. Soc. 141 (2019) 18211-18220. DOI:10.1021/jacs.9b09103 |
| [11] |
J.C. Liu, X.D. Huang, Q. Zou, et al., J. Mater. Chem. C 8 (2020) 7369-7377. DOI:10.1039/d0tc01111h |
| [12] |
J.D. Rinehart, J.R. Long, Chem. Sci. 2 (2011) 2078-2085. DOI:10.1039/c1sc00513h |
| [13] |
F. Pointillart, O. Cador, B. Le Guennic, L. Ouahab, Coord. Chem. Rev. 346 (2017) 150-175. |
| [14] |
S.M. Chen, J. Xiong, Y.Q. Zhang, et al., Chem. Sci. 9 (2018) 7540-7545. DOI:10.1039/c8sc01626g |
| [15] |
J.D. Hilgar, M.G. Bernbeck, J.D. Rinehart, J. Am. Chem. Soc. 141 (2019) 1913-1917. DOI:10.1021/jacs.8b13514 |
| [16] |
J. Li, M. Kong, L. Yin, et al., Inorg. Chem. 58 (2019) 14440-14448. DOI:10.1021/acs.inorgchem.9b01831 |
| [17] |
(a) J.C.G. Bünzli, C. Piguet, Chem. Soc. Rev. 34 (2005) 1048-1077; (b) X. Yang, X. Lin, Y. Zhao, et al., Angew. Chem. Int. Ed. 56 (2017) 7853-7857; (c) Y. Yang, K. Wang, D. Yan, ACS Appl. Mater. Interfaces 9 (2017) 17399-17407; (d) Y. Yang, K. Wang, D. Yan, Chem. Commun. 53 (2017) 7752-7755. |
| [18] |
B. Casanovas, S. Speed, O. Maury, M. Font-Bardía, R. Vicente, Polyhedron 169 (2019) 187-194. |
| [19] |
J.J. Zakrzewski, S. Chorazy, K. Nakabayashi, S. Ohkoshi, B. Sieklucka, Chem. Eur. J. 25 (2019) 11820-11825. DOI:10.1002/chem.201902420 |
| [20] |
(a) D. Zeng, K. Fan, L.P. Wang, et al., J. Mag. Mag. Mater. 484 (2019) 139-145; (b) K. Fan, S.S. Bao, R. Huo, et al., Inorg. Chem. Front. (2020). |
| [21] |
M. Fondo, J. Corredoira-Vázquez, A.M. García-Deibe, et al., Inorg. Chem. Front. 7 (2020) 3019-3029. DOI:10.1039/d0qi00637h |
| [22] |
W.B. Chen, L. Zhong, Y.J. Zhong, et al., Inorg. Chem. Front. 7 (2020) 3136-3145. DOI:10.1039/d0qi00628a |
| [23] |
M. Pinsky, D. Avnir, Inorg. Chem. 37 (1998) 5575-5582. |
| [24] |
D.J. De Frees, M.D. Miller, D. Talbi, F. Pauzat, Y. Ellinger, Astrophys. J. 408 (1993) 530-538. |
| [25] |
D. Mansfeld, C. Dietz, T. Rüffer, et al., Main Group Met. Chem. 36 (2013) 193-208. |
| [26] |
K.B. Yatsimirskii, N.K. Davidenko, Coord. Chem. Rev. 27 (1979) 223-273. |
| [27] |
(a) M. Ren, Z.L. Xu, S.S. Bao, et al., Dalton Trans. 45 (2016) 2974-2982; (b) M.R. Silva, P. Martín-Ramos, J.T. Coutinho, et al., Dalton Trans. 43 (2014) 6752-6761; (c) F. Pointillart, B. Le Guennic, S. Golhen, et al., Chem. Commun. 49 (2013) 615-617; (d) Y. Xu, S.S. Bao, X.D. Huang, et al., Cryst. Growth Des. 18 (2018) 4045-4053. |
| [28] |
H.C. Liu, Y. Gao, B. Yang, Chin. Sci. Bull. 62 (2017) 4099-4112. |
| [29] |
K.R. Meihaus, S.G. Minasian, et al., J. Am. Chem. Soc. 136 (2014) 6056-6068. DOI:10.1021/ja501569t |
| [30] |
Q. Zou, X.D. Huang, J.C. Liu, S.S. Bao, L.M. Zheng, Dalton Trans. 48 (2019) 2735-2740. DOI:10.1039/c9dt00073a |