 2021, Vol. 32


b School of Chemistry, Beijing Advanced Innovation Center for Biomedical Engineering, Beihang University, Beijing 100191, China;
c Beijing Key Laboratory of Functional Materials for Building Structure and Environment Remediation, Beijing University of Civil Engineering and Architecture, Beijing 100044, China;
d College of Chemistry, Beijing Normal University, Beijing 100875, China;
e Department of Chemistry and Biochemistry, University of California, Santa Cruz, United States
Surface-enhanced Raman scattering (SERS) has been recognized as an effective spectroscopic tool for trace analysis, where the performance is largely dictated by the substrate [1-4]. Plasmonic metal nanoparticles and assemblies have been attracting extensive interest, thanks to the localized surface plasmon (LSP) of metal nanoparticles and surface plasmon polariton (SPP) of nanoensembles that lead to the generation of unique hot spots [5-7]. In a previous study [7], it was observed that metal nanoparticles/polyelectrolyte/metal film sandwich assemblies could serve as a powerful SERS substrate, with an enhancement factor (EF) of 1011, due to the LSP-SPP coupling effect. Note that LSP-LSP coupling can produce another type of hot spots, when the distance between two neighboring nanoparticles is less than 10 nm [8]. Theoretical studies have shown that the coupling effect can enhance the SERS efficiency by one to two orders of magnitude. Indeed, LSP-LSP coupling has been achieved with substrates prepared by the drop-coating deposition Raman (DCDR) method and exploited for qualitative and quantitative analysis [9, 10]. With the formation of ring-shaped nanoparticle aggregates (i.e., the coffee ring effect), the EF was ca. 5.06×10⁷ [11].
In an earlier study [12], we prepared a Ag nanocubes/polyelectrolyte/Au film substrate, where Ag nanocubes were randomly adsorbed on the polyelectrolyte surface without obvious agglomeration and the thickness of the polyelectrolyte spacer was varied systematically for optimal SPP-LSP coupling and hence quantitative analysis. However, because of uncontrollable agglomeration of the nanoparticles, the point-to-point repeatability was relatively low, and the Ag nanocubes had to be kept away from each other, leading to minimal LSP-LSP coupling and compromised SERS efficiency [13]. In fact, the limit of quantitation (LOQ) of rhodamine 6G (R6G) on this substrate was determined to be 10-8 mol/L, in comparison to that (10-8-10-9 mol/L) of conventional techniques (e.g., portable headspace/gas chromatography mass spectrometry) [14-16]. An immediate question arises. Can the detection sensitivity be further enhanced with additional contributions from the LSP-LSP coupling by controlled deposition of the nanoparticles [17]?
Indeed, uniform and strong hot spots can be produced by the formation of close-packed monolayers of plasmonic nanoparticles [18]. For instance, Yu's group developed a room-temperature liquid/liquid interfacial assembly method to prepare large-area self-assembled nanofilms composed of various nanosized building blocks, such as nanowires, nanocubes, nanoparticles and nanosheets, and observed high SERS intensity [19]. Liebig's prepared large-scale close-packed monolayers of ultrathin gold nanotriangles on silicon wafers or quartz glass by transferring these nanotriangles to the air/liquid interface after the addition of an ethanol-toluene mixture without subsequent surface functionalization. The edge-to-edge ordered arrangement of the nanotriangles rendered the monolayers a SERS-active substrate [20].
In the present study, we demonstrate a simple and direct method to produce a Ag nanocubes/polyelectrolyte/Au film sandwich structure by large-scale, edge-to-edge ordered deposition of Ag nanocubes onto the polyelectrolyte layer. Experimentally, a drop of silver sol was deposited onto the polyelectrolyte surface, and a 1-dodecanethiol-ethanol mixture was added to the droplet. As water and ethanol were evaporated at room temperature and subsequently 1-dodecanethiol at 100 ℃, a closely packed monolayer of Ag nanocubes was formed. Crystal violet (CV) was used as the probe molecule to evaluate the point-to-point and sample-to-sample repeatability on this substrate. The limit of detection (LOD) was determined to be 10-11 mol/L and the LOQ was estimated to be 10-10 mol/L. In addition, when R6G and CV, both important biomarkers, were co-adsorbed onto the sandwich substrate, their SERS features remained well resolved and separated, suggesting the application of the sandwich substrate in the accurate detection of complex molecule systems.
The synthesis of Ag nanocubes has been detailed previously [21]. The resulting Ag sol was washed with acetone and water to remove excess EG and PVP. The concentration of the as-obtained Ag nanocubes was calibrated to be 2.1×10⁹ particles/mL by UV-vis absorption measurements. The sandwich substrate was prepared by following a layer-by-layer deposition method [22]. A polystyrene sulfonate (PSS, Mw =70 kDa, Aldrich) layer was then deposited on the resulting poly(allylamine) hydrochloride (PAH, Mw=70 kDa, Aldrich)-coated slide. This cycle was repeated to increase the number of PSS-PAH layers on the glass slide surface and obtained PAH-PSS-PAH-PSS-PAH-Au film silde. A mixture of the Ag nanocube sol prepared above and ethanol (volume ratio 1:1) was dropcast on the polyelectrolyte/gold (PE/Au) film surface, then a mixture of 1-dodecanethiol and ethanol (volume ratio 1:5) was added into water-ethanol droplet. After being placed at room temperature for 10min, the oil phase was completely evaporated by transferring the slide into an oven at 100 ℃. For the testing of probe molecules, dye molecules were added to the Ag nanocube sol and mixed for 1 h, prior to deposition onto the polyelectrolyte layer surface.
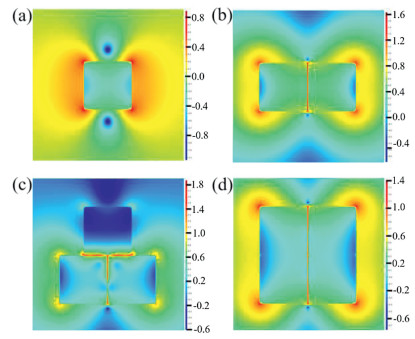
Finite-difference time-domain (FDTD) simulations were carried out with a Ag nanocubes/polyelectrolyte/Au film sandwich structure. The edge length of the Ag nanocube was set at 70 nm. The gap between the Ag nanocubes was fixed at 1 nm. The complex refractive indexes of Ag were adopted from the tabulated values measured by Johnson and Christy [23]. The simulated electric field distribution of the Ag nanocubes/polyelectrolyte/Au film sandwich structures was obtained by the field monitor on the z=0 plane (excitation wavelength 532 nm)
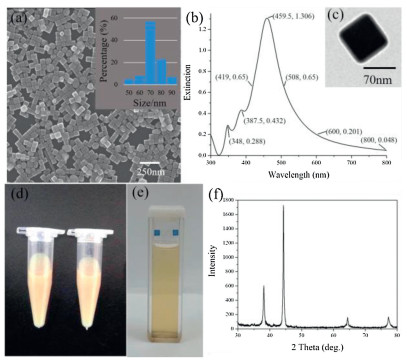
The structure of the Ag nanocubes was first characterized by SEM and UV-vis absorption measurements. From the SEM image in Fig. 1a, one can see that Ag nanocubes were indeed successfully produced, with an edge length of 70±10 nm (inset to panel a). In UV-vis absorption measurements (Fig. 1b), the Ag nano cubes can be seen to exhibit a major peak at 459 nm, along with two minor ones at 348 nm and 387 nm, consistent with the formation of Ag nanocubes with sharp corners and edges (Fig. 1c) [24]. The small full width at half maxima (FWHM < 90 nm) of the 459 peak indicates good uniformity of the dimensions of the Ag nanocubes, again, consistent with the narrow size distribution obtained in SEM measurements (Fig. 1a inset). The as-prepared Ag nanocube sol exhibited a milky yellow color (Fig. 1d), and became transparently yellow when diluted with water (O.D.=1.0, Fig. 1e). Fig. 1f shows the XRD patterns of the silver nanocubes, where four major diffraction peaks can be identified at 2 θ=38.1°, 44.3°, 64.4° and 77.5°, corresponding to the (111), (200), (220) and (311) facets of face-centered cubic (fcc) Ag (JCPDS, No. 04-0783). Again, this is consistent with the formation of silver nanocubes.

|
Download:
|
| Fig. 1. (a) SEM image of Ag nanocubes. Inset is the corresponding size distribution. (b) UV-vis absorption spectra of Ag nanocubes sol samples. (c) TEM image of Ag nanocubes. (d) Photograph of the as-synthesized Ag nanocube sol at the concentration of 2.98×10⁹ particles/mL. (e) Photograph of the Ag nanocube sol at the concentration is 9.62×10⁸ particles/mL. (f) XRD patterns of the as-synthesized Ag nanocubes. | |
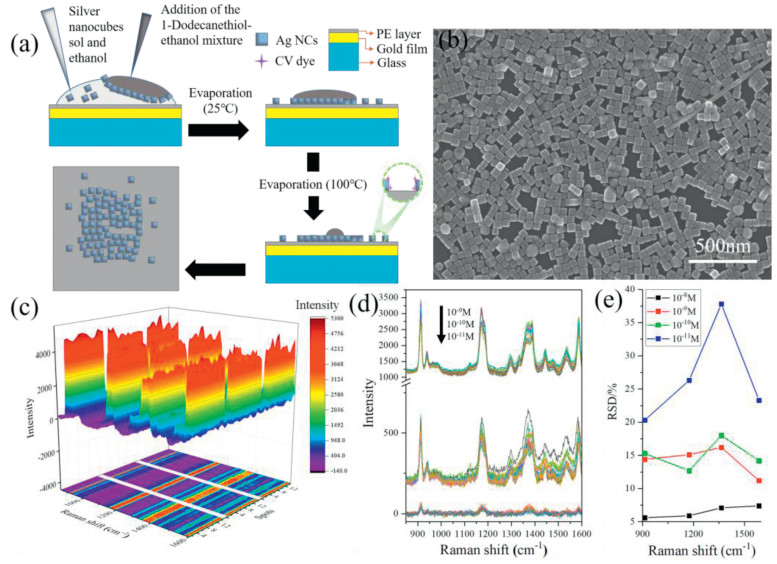
The obtained Ag nanocubes were then used to prepare Ag nanocubes/polyelectrolyte/Au film sandwich structures. When the Ag nanocube sol was directly dropcast onto the polyelectrolyte/Au film surface, the nanocubes were mostly aggregated in the coffee rings after solvent evaporation, as manifested in laser scanning confocal microscopic Raman measurements (Fig. S1 in Supporting information) [25-27]. A more uniform distribution of the nanocubes could be obtained by adding ethanol into the sol before dropcasting on the polyelectrolyte surface (Fig. S2 in Supporting information) [28], due to the reduced surface tension and rapid evaporation of ethanol at room temperature [29-31]. However, the spacing between neighboring nanocubes generally remains too big to achieve apparent LSP-LSP coupling, which compromised the enhancement factor and LOQ. Interestingly, the addition of an ethanolic solution of 1-dodecanethiol, instead of pure ethanol, into the Ag nanocube sol before dropcasting onto the polyelectrolyte layer resulted in the formation of a highly ordered edge-to-edge monolayer after solvent evaporation (Fig. 2a) [32], as manifested clearly in SEM measurements where the edge-to-edge spacing was estimated to be ca. 1 nm (Fig. 2b). The SERS performance of the resulting Ag nanocubes/polyelectrolyte/Au film sandwich structures was then evaluated by using CV as the probe molecule. To evaluate the LOD and LOQ of the sandwich substrate, Fig. 2c shows the SERS profiles of CV at the concentration of 10-8 mol/L collected from 15 repeated measurements on three substrates prepared in the same manner. The CV concentration was lowered to 10-9, 10-10 and 10-11 mol/L, and the corresponding SERS profiles were depicted in Fig. 2d. In general, relative standard deviations (RSD) of the intensity of the four main vibrational peaks less than 20% is needed for quantitative analysis by SERS [33, 34]. Significantly, from Fig. S3 (Supporting information), one can also see that the four Raman peaks all showed a consistent variation trend of the intensity in 45 acquisitions on the three monolayer substrates. This means that any of the peaks can be used for the quantitative analysis of the target molecule (CV in the present measurement), which is particularly important when multiple molecules co-adsorb onto the substrate surface and some of the spectral features overlap. One can see that apparent SERS signals remained well resolved at concentration above 10-10 mol/L, with the RSD values (Fig. 2e) lower than 20%, suggesting an LOQ of 10-10 mol/L, which is lower than that of traditional Ag nanocubes-based sandwich substrates prepared by simple dropcast (10-8 mol/L) and coffee ring Ag nanocube substrates (5×10⁻⁸ mol/L) [11, 12]. This suggests a remarkable performance of the sandwich substrate with good point-to-point and sample-to-sample repeatability. Such a compact, ordered structure may lead to strong LSP-LSP coupling, as manifested in FDTD simulation (Fig. 3). From the FDTD simulations, one can see that the LSP-LSP resonance enhances the electromagnetic field in the gap (1 nm) between neighboring nanocubes (Fig. 3). As linearly polarized light (1 V/m) was used along the X direction, there was no LSP-LSP resonance along the Y direction in the tetramer (Fig. 3d). That is why the electric field strength of the tetramer is less than that of the trimer. In general, the LSP-LSP effect becomes intensified with an increasing number of nanocubes in the assembly. In contrast to the substrate prepared by the addition of pure ethanol (Fig. S4 in Supporting information), the LOD of the substrate prepared with the addition of an ethanolic solution of 1-docanethiol was found to be only ca. 10-11 mol/L for CV (Fig. 4a).

|
Download:
|
| Fig. 2. (a) Schematic illustration of 1-dodecanethiol-ethanol-water dropcasting deposition method. (b) SEM micrograph of edge-to-edge arrangement of Ag nanocubes in a monolayer. (c) SERS spectra of CV (10-8 mol/L) on three sandwich substrates in 15 repeated measurements. (d) SERS spectra of CV at different concentrations (from 10-9 mol/L to 10-11 mol/L). (e) The RSD values of the four main Raman peaks (912 cm-1, 1174 cm-1, 1364 cm-1 and 1586 cm-1) of CV (from 10-8 mol/L to 10-11 mol/L). | |

|
Download:
|
| Fig. 3. Simulations of the electric field in the gap (1 nm) with a different number of Ag nanocubes: (a) one, (b) two, (c) three and (d) four. The localized electric field distribution of the Ag/PE/Au structures on the z=0 plane (excitation wavelength 532 nm) is collected by the field monitor. | |

|
Download:
|
| Fig. 4. (a) SERS spectra of CV at different concentrations (from 10-7 mol/L to 10-12 mol/L) on Ag nanocubes-based sandwich substrates prepared by the addition of a 1-dodecanethiol-ethanol-water (D-E-W) mixture. (b) SERS spectra of CV (10-8 mol/L), R6G (10-9 mol/L) and co-adsorbed CV (#, 10-8 mol/L) and R6G (*, 10-9 mol/L). (c) SERS spectra of co-adsorbed CV and R6G at different molar ratios. (d) Relationship between the intensity of the characteristic peaks (609 cm-1 and 912 cm-1) and the concentration (M: mol/L) of the probe molecules (CV; R6G). | |
In practical applications, multiple analytes often coexist. It is highly desired that SERS can be used for the detection without separation of the various components, despite possible spectral overlap with non-target molecules [35]. In the present study, the pair of CV and R6G was used as the illustrating example (Fig. S5 in Supporting information). R6G can be seen to exhibit much more intense SERS signals than CV (Fig. S6 in Supporting information). As the absorption peak of R6G is located at 524 nm, while that of CV at 590 nm, excitation at 532 nm can intensify the R6G Raman signals. Consequently, when R6G (10-9 mol/L) and CV (10-8 mol/L) were co-adsorbed onto the sandwich substrate, the Raman profiles became an oblique line (Fig. S7 in Supporting information). Repetitive tests (Fig. S7) show a uniform adsorption of the two molecules on the silver nanocube arrays.
After the baseline of the original SERS spectra in Fig. S7 were adjusted, one can see more intuitively the changes of the peak intensity before and after the mixing of the two probe molecules (Fig. 4b). The peaks at 609 and 912 cm-1 are independent of the other probe molecule (Tables S1 and S2 in Supporting information). This suggests that these two peaks can be used to quantify the concentration of the corresponding probe (Figs. 4c and d). The concentration of R6G was varied from 0.8×10⁻⁹ mol/L to 0.2×10⁻⁹ mol/L, and from 0.2×10⁻⁸ mol/L to 0.8×10⁻⁸ mol/L for CV. Fig. 4c shows the SERS profiles of the two molecules at different molar ratios. One can see that with the decrease of R6G concentration, the intensity of the R6G peak at 609 cm-1 decreases, and concurrently the intensity of the CV peak at 912 cm-1 increases. Linear regression of the peak intensities yields an R2 coefficient of 0.99 for R6G and 0.98 for CV, suggesting high feasibility of using the sandwich substrate for simultaneous detection of multiple analytes.
In this study, a Ag nanocubes/polyelectrolyte/Au film sandwich structure with a monolayer of large-scale edge-to-edge ordered arrangement of Ag nanocubes was prepared by the addition of an ethanolic solution of 1-dodecanethiol into the Ag nanocube sol, and could be used as an effective substrate for SERS quantitative detection of probe molecules. The substrate showed high SERS intensity for CV with a low LOD of 10-11 mol/L and LOQ of 10-10 mol/L, at least one order of magnitude better than that with Ag nanocubes-based sandwich substrates prepared by the conventional dropcast method or with the addition of an ethanol-water mixture. Notably, the sandwich substrates also exhibited high point-to-point and sample-to-sample reproducibility, with RSD lower than 20%. Significantly, the sandwich substrate could be used to for simultaneous detection of dual analytes (e.g., CV and R6G). Results from the present study demonstrate that with a uniform edge-to-edge arrangement of Ag nanocubes, the sandwich structure can be used as a high-performance Raman substrate due to strong LSP-LSP coupling, and can be used for the practical detection of complex molecular systems.
Declaration of competing interestThe authors declare that they have no known competing financial interests or personal relationships that could have appeared to influence the work reported in this paper
AcknowledgmentsThis work was supported by the Natural Science Foundation of China (NSFC, Nos. 21471103, 51631001, 11574173 and 21603014), the Scientific Research Base Development Program and the science and technology innovation service ability construction project of the Beijing Municipal Commission of Education.
Appendix A. Supplementary dataSupplementary material related to this article canbefound, in the online version, at doi:https://doi.org/10.1016/j.cclet.2020.10.021.
| [1] |
M.L. Mekonnen, C.H. Chen, M. Osada, W.N. Su, B.J. Hwang, Spectrochim. Acta A 225 (2020) 117484. DOI:10.1016/j.saa.2019.117484 |
| [2] |
Y. Xu, F.Y.H. Kutsanedzie, M.M. Hassan, H.H. Li, Q.S. Chen, Spectrochim. Acta A 206 (2019) 405-412. DOI:10.1016/j.saa.2018.08.035 |
| [3] |
C. Li, A. Liu, C. Zhang, et al., Opt. Express 25 (2017) 20631-20641. DOI:10.1364/OE.25.020631 |
| [4] |
M. Rycenga, X. Xia, C.H. Moran, et al., Angew. Chem. Int. Ed. 50 (2011) 5473-5477. DOI:10.1002/anie.201101632 |
| [5] |
J.J. Mock, R.T. Hill, A. Degiron, et al., Nano Lett. 8 (2008) 2245-2252. DOI:10.1021/nl080872f |
| [6] |
G. Leveque, O.J.F. Martin, Opt. Express 14 (2006) 9971-9981. DOI:10.1364/OE.14.009971 |
| [7] |
S.K. Srivastava, A.R. Li, S.Z. Li, I. Abdulhalim, J. Phys. Chem. C 120 (2016) 28735-28742. DOI:10.1021/acs.jpcc.6b08276 |
| [8] |
M. Yi, D. Zhang, P. Wang, et al., Plasmonics 6 (2011) 515-519. DOI:10.1007/s11468-011-9230-7 |
| [9] |
E. Kocisova, M. Petr, H. Sipova, O. Kylian, M. Prochazka, Phys. Chem. Chem. Phys. 19 (2016) 388-393. |
| [10] |
R.A. Halvorson, P.J. Vikesland, Environ. Sci. Technol. 45 (2011) 5644-5651. DOI:10.1021/es200255y |
| [11] |
B. Wang, L. Zhang, X. Zhou, Spectrochim. Acta A. Mol. Biomol. Spectrosc. 121 (2014) 63-69. DOI:10.1016/j.saa.2013.10.013 |
| [12] |
Q. Wang, X.H. Bai, Y. Zhang, Z. Zhou, et al., ACS Appl. Nano Mater. 3 (2020) 1934-1941. |
| [13] |
Y. Nishijima, J.B. Khurgin, L. Rosa, H. Fujiwara, S. Juodkazis, Opt. Express 21 (2013) 13502-13514. DOI:10.1364/OE.21.013502 |
| [14] |
C.I. Ng, X.M. Zhang, Talanta 85 (2011) 1766-1771. DOI:10.1016/j.talanta.2011.06.074 |
| [15] |
X. Yang, H. Zhang, Y. Liu, et al., Food Chem. 127 (2011) 855-865. DOI:10.1016/j.foodchem.2011.01.024 |
| [16] |
A.R. Restrepo, A.F.G. Ortiz, D.E.H. Ossa, G.A.P. Mesa, Food Chem. 158 (2014) 153-161. DOI:10.1016/j.foodchem.2014.02.121 |
| [17] |
B.B. Rajeeva, L.H. Lin, Y.B. Zheng, Nano Res. 11 (2018) 4423-4440. DOI:10.1007/s12274-017-1909-4 |
| [18] |
Y.J. Yang, Y.H. Lee, I.Y. Phang, et al., Nano Lett. 16 (2016) 3872-3878. DOI:10.1021/acs.nanolett.6b01388 |
| [19] |
J.W. Liu, S.Y. Zhang, H. Qi, W.C. Wen, S.H. Yu, Small 8 (2012) 2412-2420. DOI:10.1002/smll.201200172 |
| [20] |
F. Liebig, R.M. Sarhan, M. Sander, et al., ACS Appl. Mater. Inter. 9 (2017) 20247-20253. DOI:10.1021/acsami.7b07231 |
| [21] |
Q. Zhang, W. Li, L.P. Wen, J. Chen, Y. Xia, Chem. Eur. J. 16 (2010) 10234-10239. DOI:10.1002/chem.201000341 |
| [22] |
G. Decher, Science 277 (1997) 1232-1237. DOI:10.1126/science.277.5330.1232 |
| [23] |
P.B. Johnson, R.W. Christy, Phys. Rev. B 6 (1972) 4370-4379. DOI:10.1103/PhysRevB.6.4370 |
| [24] |
W. Haiss, N.T.K. Thanh, J. Aveyard, D.G. Fernig, Anal. Chem. 79 (2007) 4215-4221. DOI:10.1021/ac0702084 |
| [25] |
D. Soltman, V. Subramanian, Langmuir 24 (2008) 2224-2231. DOI:10.1021/la7026847 |
| [26] |
P.J. Yunker, T. Still, M.A. Lohr, A.G. Yodh, Nature 476 (2011) 308-311. DOI:10.1038/nature10344 |
| [27] |
R. Savino, R. Monti, J. Crystal Growth 165 (1996) 308-318. DOI:10.1016/0022-0248(96)00151-0 |
| [28] |
K.H. Kang, S.J. Lee, C.M. Lee, I.S. Kang, Measure. Sci. Technol. 15 (2004) 1104-1112. DOI:10.1088/0957-0233/15/6/009 |
| [29] |
A. Moreau, C. Ciraci, J.J. Mock, et al., Nature 492 (2012) 86-89. DOI:10.1038/nature11615 |
| [30] |
J.B. Lassiter, F. McGuire, J.J. Mock, et al., Nano Lett. 13 (2013) 5866-5872. DOI:10.1021/nl402660s |
| [31] |
H.X. Gu, K. Hu, D.W. Li, Y.T. Long, Analyst 141 (2016) 4359-4365. DOI:10.1039/C6AN00319B |
| [32] |
I.H. Kim, J.H. Kim, J.Y. Choi, et al., Chem. Phys. Lett. 715 (2019) 91-99. DOI:10.1016/j.cplett.2018.11.024 |
| [33] |
R.H. Que, M.W. Shao, S.J. Zhuo, et al., Adv. Funct. Mater. 21 (2011) 3337-3343. DOI:10.1002/adfm.201100641 |
| [34] |
S.O. Kucheyev, J.R. Hayes, J. Biener, et al., Appl. Phys. Lett. 89 (2006) 053102. DOI:10.1063/1.2260828 |
| [35] |
Y.X. Fan, K.Q. Lai, B.A. Rasco, Y.Q. Huang, Food Control 37 (2014) 153-157. DOI:10.1016/j.foodcont.2013.09.014 |