 2021, Vol. 32


b Southeast University Jiangbei New Area Innovation Institute, Nanjing 210096, China;
c School of Chemical Engineering, Nanjing University of Science and Technology, Nanjing 210094, China
Action as a novel two-dimensional material composed of sp2 hybrid carbon atoms, graphene has drawn growing attentions, since they were found by mechanical exfoliation [1]. Its excellent properties such as high thermal conductivity and high electronic conductivity generated from π-conjunction of graphene. Because of the excellent properties of its structure, graphene has a good prospect in many fields, such as personal wearable thermal management [2, 3], application in phase change materials (PCMs) [4-6] and thermal interface materials (TIM) [7, 8]. How to prepare large area graphene in a simple way and make it have advanced thermal property were attracted more attentions in current scientific research. Thermal performance analysis and thermal effects of graphene will be very important to study for improvement of graphene properties.
As a nonmetallic material, the heat in graphene should be mostly carried by phonon rather than by electrons [9, 10]. From the view of quantum mechanics, energy of the simple harmonic oscillator that represents the collective movement of atoms is quantized. The quantum of different lattice vibration is called the phonon, it is the smallest unit of energy wi. However, integrated graphene film cannot be prepared at present. Phonons will collide at the defects with losing energy, which will lead to the decrease of thermal conductivity of graphene. A. Carlos et al. studied the phonon scattering caused by point defects by ab initio Green's function methodology, and obtained the conclusion that the thermal conductivity of graphene decreased due to point defects [11]. Furthermore, it was found that the symmetry of graphene with double carbon vacancy is lower than that of single carbon vacancy, and the change of scattering rate with wave vector is obviously larger than that of single carbon vacancy, which leads to the decrease of thermal conductivity. H. K. Liu et al. further explored the thermal conductivity (κ) of polycrystalline graphene, and simulated the dependence of thermal conductivity on grain boundary (GB) energy and grain size by using molecular dynamics simulations model [12]. The result illuminated that the thermal conductivity is inversely proportional to grain boundary energy and directly proportional to grain size. It can be concluded that the energy of grain boundary can induce phonon scattering, which is not conducive to improving the thermal conductivity of graphene. The above examples show that phonon propagation in graphene is very complex. Any defect will change the transmission energy of phonon, and the thermal conductivity will be influenced. The investigation of relations between phonon dispersion and vibrational density defect of states will be very important for understanding the thermal properties of graphene.
Phonon transport has been incorporated into important heat carriers process in graphene studied. In this review, we outline different types of theoretical approaches that developed for phonon transport in graphene and paves the way for further research. We concentrate on the phonon motion characteristics in defect of graphene and try to structure a physical description of phonons transfer their energy in nanostructures with lattice mismatches. In the second part, we briefly learn different theoretical models for description of phonon in single layer graphene and simulation methods on heat conduction. In the third part, we investigate the theoretical and experimental results for the thermal transport properties of graphene and the influences of structural defects, strain and substrate adsorption. In the last part, we summarize and outlook.
2. Theoretical models of thermal conductivityMany interesting phenomena were discovered when researchers made effort in the thermal transfer in graphene, such as thermal rectification (TR) [13-15], thermophoresis [16, 17] and negative differential thermal resistance (NDTR) [18, 19]. Therefore, researchers are committed to developing various models for prediction the thermal conductivity of graphene nano-system [20, 21]. At present, three different models were set up. (1) non-equilibrium Green function (NEGF) theory, (2) molecular dynamics (MD) simulations and (3) Boltzmann transport equation (BTE). We will introduce these methods in detail.
2.1. Non-equilibrium Green functionNEGF theory is commonly used for electronic transport, but can be extended to thermal counterpart in nanostructure. It is efficient to use NEGF method to deal with many problems, when the mechanical properties of anisotropy are weak in objects and materials, when interactions are weak, especially in ballistic thermal transport, which obtain the maximum thermal conductance of graphene [22-25]. Generally, this system investigated is assumed as dividing into three parts, called, the left lead (L), the central region (C) and the right lead (R). The classical Hamiltonian is given by

|
(1) |
in which 

|
(2) |
when η→0. The left/right lead retarded self-energies can be calculated by:

|
(3) |
For the central scattering area retarded Green's function, it can be expressed as:

|
(4) |
in which ΣLr, ΣRr represent the retarded self-energies of the left and right lead, respectively.
The phonon transport function τi can be used to predict the thermal conductivity of graphene, which is described as:

|
(5) |
here ΓL, i and ΓR, i are taken as the contact correlation function of the left terminal and right terminal for simple, and Gir or Gia is the retarded Green's function of the center section. More detailed description of the calculation process can refer to other literature.
The NEGF method is initially used to handle electrical transport, originating from the quantum field theory. With the further research, this method is suitable for the study of ballistic phonon transport at low temperature. Theoretically, combining NEGF and first principle calculation explains relationship of the phonon and electron interactions at low-temperature. However, introduction of external parameters to accurately describe the characteristics of phonon scattering should further be considered in NEGF method.
2.2. Molecular dynamics simulationsMD simulations are ideal for addressing such issues since they can be used to study individual microstructural elements and can be combined with Newton's mechanical equations to deal with atomic level complex structures. The advantage of MD simulation is that there are few variables to be added. Only the structural parameters of graphene and the empirical force field are needed as the known conditions, and the simulation results can be quite accurate. With the development of MD simulations for many years, equilibrium molecular dynamics (EMD) and non-equilibrium molecular dynamics (NEMD) have been derived. EMD mainly relies on the fluctuation–dissipation theorem simulation to calculate the thermal conductivity of graphene, which is slow but accurate. The NEMD establishes the heat transfer equilibrium by disturbing the system, and obtains the thermal conductivity by solving the heat conduction equation. The algorithm is fast, but it is disturbed greatly and its reliability is not high [26]. In NEMD methods, two thermostats with different temperatures are applied on both sides of the sample, and a temperature gradient is applied on the simulation unit, thus a heat flow closer to the actual experimental measurement is generated in the simulation unit. By running for a long time, the simulation system achieves the non-equilibrium steady state with constant heat flow and temperature gradient. Therefore, the thermal conductivity of the system can be calculated according to the Fourier heat conduction law:

|
(6) |
where J is the density of heat flow and ∇T is the temperature gradient along the heat transport direction. According to the external injected energy, J is calculated, and ∇T is extracted by linear fitting of temperature distribution.
As mentioned before, EMD method is more accurate than NEMD method, so the thermal conductivity of graphene nanostructures is simulated based on Green-Kubo formula [27]:

|
(7) |
where λ represents the heat conductivity, V as the system volume, T acts the issue temperature, kB is Boltzmann's constant, t is the time, and the symbol of " < > " denotes the system average value. J(t) is the density of heat flow in the system during the t moment and is calculation as:

|
(8) |
in which ri, vi and Ei represent the coordinate, velocity and total energy of atom i in the system. In addition, the large number of tests has proved that the Brenner et al. [28] is very good in testing the mechanical properties, thermal conductivity and chemical properties of carbon materials, and has high accuracy.
The Molecular dynamics, as the most widely used method to study the thermal transport properties of carbon materials, is involved in different nanostructures, such as the defect [29, 30], strain [31], chemisorption [32], interface [33, 34] and substrate [35], and the thermal conductivity of carbon materials can be more accurately inferred by combining different calculation models.
2.3. Boltzmann transport equationIn order to describe the transport of phonons in the crystals of graphene materials and balance the relative relationship of phonon population n, the first term diffusive drift and scattering of phonon. Based on the perturbation theory, linearized BTE is defined as follow [36]:

|
(9) |
in which ηi represents number of phonons involved in transport and 

|
(10) |
in which ηi, 0 is the phonon occupation number mode i under thermal equilibrium, namely, the Bose-Einstein distribution. And the τi is the time constant which represents phonon return to its equilibrium occupation from a nonequilibrium. As shown in formula (10), the SMRTA method is a first-order approximation to the phonon BTE, it neglects the deviation of τ from equilibrium values when the system is in nonequilibrium states. By introducing RTA, we can correct system deviation for the SMRTA method. On this basis, Omini et al. [37] developed a set of solutions to the linearized Boltzmann equation by iteration. This scheme was adopted by Broido who calculated of phonon thermal transport in graphene [38]. This method takes into account τ (correction factor) by the non-equilibrium layout of each phonons in different collision process, thus this method is wider range of applications than SMRTA. For high κ nano-materials like graphene and carbon nanotubes, the relaxation time of umklapp (U) process is closely related to the changing of equilibrium phonon population caused by strong normal process. The experimental results show that for high κ materials with nitrogen (N)-doped, linear iterative scheme is more precise than SMRTA scheme [39].
3. Thermal transport in graphene sheetThe ultra-high thermal conductivity of graphene is closely related to the fast propagation of phonon. The phonon propagation is susceptible to changing of graphene structure. Fig. 1 illustrates that different structural defects can affect phonon transport.

|
Download:
|
| Fig. 1. Various graphene defect structure. | |
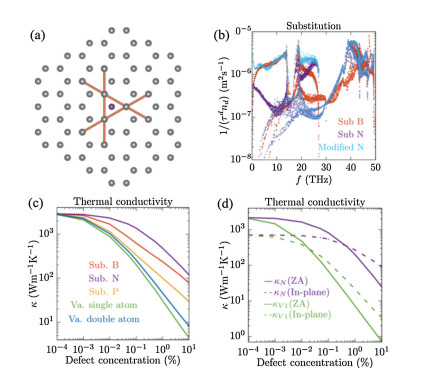
Doping graphene with different elements, the carbon atom is replaced by other atoms, the bond length and bond angle are changed, the original structure and corresponding properties of graphene are preserved [40, 41], and the thermal conductivity of graphene can be changed by controlling the doping concentration. Therefore, many researchers artificially changed the carbon element in graphene sheet to other elements, such as nitrogen [42, 43], boron [44], silicon [45] and isotope. A. Carlos et al. [11] doped different element atoms in graphene, and calculated the corresponding thermal conductivity by ab initio Green's function method. They found that atomic mass is similar, the scattering degree of boron and nitrogen for graphene has changed greatly. They found that atomic mass is the similar, the scattering degree of boron and nitrogen for graphene has changed greatly. The scattering rate of out-of-plane acoustic (ZA) phonons from normal defects is almost one order of magnitude smaller than that from boron defects. As shown in Fig. 2a, the effect of defects on surrounding atoms is derived along the red line in Fig. 2a. Any tiny atomic substitution on graphene sheets different distribution of phonon density function and results in thermal conductivity change, Fig. 2b shows that replacing different atom makes τnitrogenZA≈τboronZA. At the same time, different levels of atomic doping lead to the change of thermal conductivity. Generally, doping of heteroatoms level provides a strategy for improving the energy density of materials but it is negative to the thermal conductivity (Figs. 2c and d). In term calculation, compared with first-order perturbation approaches, the ab initio Green's function methodology is more accurate to describe the phenomenon when scattering rate increased with ω0.

|
Download:
|
| Fig. 2. (a) Schematic diagram of atom doping; (b) T-matrix scattering rates for different substitution; (c) thermal conductivity of different substitution; (d) thermal conductivity of different plane. Reprint with permission [11]. Copyright 2018, American Physical Society Sites. | |
C.J. Li et al. [46] used different concentrations of doped hydrogen to study the thermal conductivity of graphene, and used non-equilibrium molecular dynamics simulations to simulate the propagation of phonon. They found that the thermal conductivity variation of graphene with patterned hydrogen doping with respect to doping coverage and doping stripe orientation. In addition, with different angle and hydrogen doping, the thermal conductivity is different. In general, the wider the coverage, the greater the angle change and the worse the thermal conductivity, as shown in Fig. 3.

|
Download:
|
| Fig. 3. Thermal conductivity with different coverage. Reprint with permission [46]. Copyright 2015, American Institute of Physics. | |
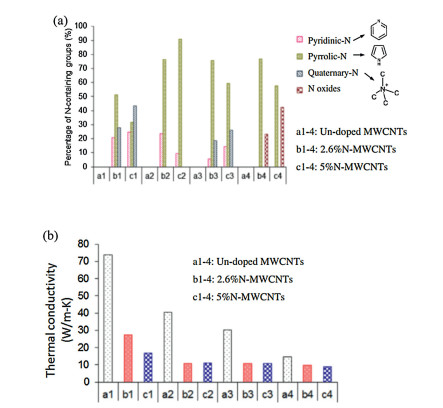
N-doped in graphene sheet was considered has high potential to application in sensors, electronic devices, catalysts, hydrogen storage and other systems. Unfortunately, the mechanisms of thermal conductivity for N-doped graphene sheet was not deeply understand, so we use carbon nanotubes as reference. L. Yuan et al. [47] used chemical vapor deposition to grow the N-doped carbon nanotube and studied its thermal conductivity characteristic. In addition, the thermal conductivity of plasma and acid treatment nitrogen doped carbon nanotube is compared. It can be seen that thermal conductivity of CNTs decreased with the increase of nitrogen content. Besides, the thermal conductivity of the materials is further reduced by the different sputtering strength and the changes of defects and nitrogen content after acidification. The reason is that the scattering of phonons in carbon nanotubes is further intensified, which improves the heat accumulation ability and reduces the thermal conductivity of the materials [48, 49], as shown in Fig. 4.

|
Download:
|
| Fig. 4. (a) The proportion of different forms of N element proportion after doping different concentrations of N-MWCNTs in a1~4 un-doped MWCNTs, b1~4 2.6% N-MWCNTs, c1~4 5%N-MWCNTs. (b) a1~4 Un-doped MWCNTs, b1~4 2.6% N-MWCNTs, c1~4 5%N-MWCNTs, after acidification and plasma, the thermal conductivity changes with the change of nitrogen content. Reprint with permission [47]. Copyright 2014, Elsevier. | |
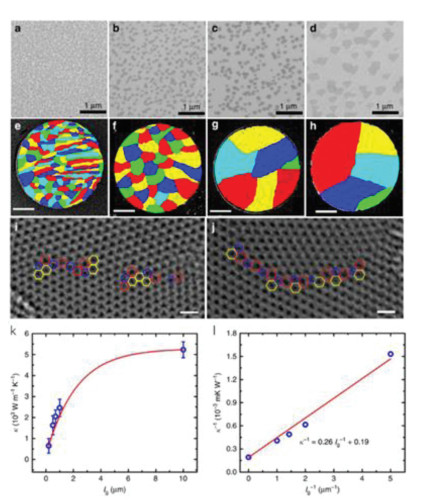
Large area graphene films are generally observed in polycrystalline form [50-52]. The interface between crystal graphene is commonly in the form of grain boundaries (GBs) [53-56]. Worth to mention, the different crystal size and morphology character of graphene films prepared by different methods will have a great influence on the thermal conductivity of graphene, so it is significant to observe the thermal conductivity of graphene by investigating the grain boundary of graphene [57, 58]. T. Ma et al. [59] synthesized polycrystalline graphene with maximum nucleation density by segregation-adsorption CVD (SACVD) on Pt foil.
As shown in Fig. 5, it can be concluded that with the increase of CVD processing temperature, carbon atoms at the edge can obtain more energy to form large area graphene, the scattering density of phonon edge decreases, and the thermal conductivity of graphene is further improved. When the grain size reaches 10 μm, the thermal of graphene reaches 5230W m-1K-1. Therefore, increasing the preparation temperature can effectively reduce the grain boundary density of graphene, thus improving the thermal conductivity of graphene.

|
Download:
|
| Fig. 5. (a~d) The SEM of graphene with different grain size. (e~h) Grain size of graphene under different preparation conditions. Scale bars: 500 nm. (i, j) Graphene films with grain size of ~200 and ~700 nm, respectively under HRTEM. (k, l) Effect of size on thermal conductivity of graphene. Reprint with permission [59]. Copyright 2017, Nature Publishing Group. | |
The curvature of the grain boundary and the out of plane structural deformation at the boundary also affect the thermal conductivity of graphene [60, 61]. Y. Lu et al. [62] applied the non-equilibrium Green function method to the heat conduction calculation of graphene crystal. The results show that grain boundary offer excellent thermal conductivity independence, which is difference with electron transport dependence structure. The zigzag oriented symmetrical grain boundary has the highest thermal conductivity, which is less dependent on the orientation angle of graphene domain. The thermal conductivity of grain boundary increases with the temperature, and the thermal ballistic degree decreases with the increase of temperature. The thermal conductivity of graphene grain boundary is dominated by out-of-plane acoustic mode. In addition, L. M. Sandonas et al. [63] combined atomic Green's function technique with density functional tight-binding (DFTB) to study the structure and dynamical disorder for thermal conductivity of graphene. the result shows linear GBs have higher thermal conductance than curved GBs. Moreover, the increase of disorder in the grain boundary results in the decrease of phonon transmission in the plane and out of plane vibration modes, so the thermal conductivity and transport performance decrease sharply.
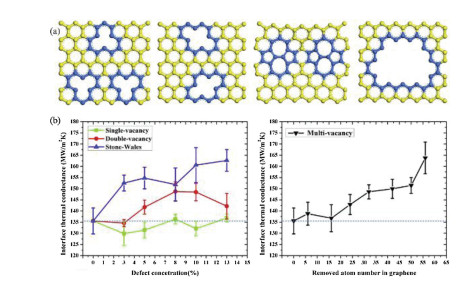
3.3. Defect of grapheneGraphene has a variety of defect structures, which can establish the relationship between different types of graphene defect structure and thermal conductivity, which helps us to better understand the thermal conductivity mechanism of graphene. At present, there are four types of structural defects in graphene, which are Single-vacancy, Double-vacancy, Stone-Wales, Multi-vacancy, as shown in Fig. 6a. in general, the inherent thermal conductivity of graphene is decreased with the structural defects increase. But when defect graphene combines with other materials, like epoxy [64], it can enhance entirety thermal conductivity, which due to defect graphene can well match the low frequency curve of epoxy resin, showing in Fig. 6b.

|
Download:
|
| Fig. 6. (a) Types of defect from left to right: single vacancy, double vacancy, Stone-wales defect, multi vacancy. (b) The whole thermal conductivity of composites is increase with the defect increases. Reprint with permission [64]. Copyright 2018, Elsevier. | |
Indeed, for pure graphene membrane, in the rapid transport of phonons mainly depends on the establishment of complete graphene structure. If the complete structure of graphene is destroyed, a large number of phonons will be scattered and the thermal conductivity will be decreased. Compared with grain boundary and layers number, the graphene thermal conductivity rises first then decreases with the density of point defect increase. The main reason for this phenomenon is that the Young's modulus of the material will be enhanced by the low density of defects [65]. In addition to the above two defects, there are other ways to reduce the transmission performance of phonons. Malekpour et al. [66]. used low-energy electron beam to introduced defects in graphene. Through the Raman test, we can clearly obvious that with the step of irradiation increase, the defect of graphene become more in Fig. 7a. The corresponding thermal conductivity is shown in Fig. 7b. In addition, the author thought that these three reasons lead to the decrease of thermal conductivity, which are Umklapp scattering due to lattice anharmonicity, mass-difference scattering and rough edge scattering.

|
Download:
|
| Fig. 7. (a) The Raman spectra of different step of irradiation. (b) Thermal conductivity of different defect density with single and double vacancy in graphene. Reprint with permission [66]. Copyright 2016, the Royal Society of Chemistry. | |
For monolayer graphene thermal conductivity, it is affected by the intrinsic thermal conductivity which limited by anharmonic crystal lattice and extrinsic thermal conductivity, such as phonon-rough-boundary or phonon-defect scattering. However, the thermal conductivity of few-layer-graphene (FLG) is related to the thickness, H or number of atomic planes, n. First of all, we should get the exact number of layers of graphene. Generally, the number of layers can be accurately determined by measuring the 2D peak intensity at ~2700 cm-1, and the thermal conductivity is decrease with the number of layers increase whatever the graphene is zigzag or armchair, as shown in Figs. 8a–c [67-69]. However, different layers will affect the main factors of graphene thermal conductivity. When the width and length of the flake are unified, the increase of the number layers makes graphene change from 2D structure to 3D structure. When the thin FLG atomic layers thickness (n < 4), the thickness is to thin and the scattering from top to bottom is too weak, so the influence on thermal conductivity is very limited, but there is still edge scattering [69]. At this time, the thermal conductivity of graphene is mainly affected by the by the intrinsic thermal conductivity, also called anharmonic crystal lattice. This theory about graphene heat conduction is described by the Fermi-Pasta-Ulam Hamiltonians with layers number varying from 1 to 4 [70]. When the number of graphene layers increasing (n < 4), the effect of bound scattering is gradually obvious. As shown in Fig. 8d, compared with bilayer graphene, the number of phonon states available for three-phonon Umklapp scattering in single layer graphene is only a quarter of that of bilayer graphene. besides, with the number of layers increasing, the degree of Umklapp scattering is deepening [71]. At this time, the scattering is the main reason for the decrease of thermal conductivity.

|
Download:
|
| Fig. 8. (a) The Raman spectra of different graphene layers at 488 nm wavelength. Reprint with permission [67] Copyright 2009, American Institute of Physics. (b) The thermal conductivity of few layer graphene decreases with number layer increasing, which is obtained by non-equilibrium molecular dynamics method. (c) The thermal conductivity of graphene sheet with a width of 5 μm varies with the thickness of graphene. Reprint with permission [68]. Copyright 2011, American Institute of Physics. (d) Compared with single layer graphene, bilayer graphene processes more state available for scattering to increase phonon branch. Reprint with permission [69]. Copyright 2010, Nature Publishing Group. | |
In this paper, on the one hand, we introduce a variety of heat conduction calculation methods, which have a good prospect in graphene heat conduction simulation, and can provide guidance for graphene heat conduction materials. On the other hand, thermal transport in graphene has been discussed. Fast propagation of phonon was proved related with the high structural Integrity of graphene. From MD, it was proved that replaced the carbon atom, different levels of doping graphene lead to the change of thermal conductivity. Umklapp scattering due to lattice anharmonicity, mass-difference scattering, and rough edge scattering were also been discussed by adopted BTE analysis and MD simulation. The most interesting part will be the grain boundary of graphene, when the grain size or the nucleation density increases it was proved that the thermal conductivity increased from ~610W m-1K-1 to ~5230W m-1K-1. It can be deduced that, synthesized polycrystalline graphene with large nucleation density will also give graphene high thermal conductivity. In conclusion, to explore new methods to prepare graphene with large grain size or high nucleus density other than CVD, will be the most potential development direction in the future.
Declaration of competing interestThe authors report no declarations of interest.
AcknowledgmentsThis research was supported by the National Natural Science Foundation of China (Nos. 11204033, 51773093); the Natural Science Foundation of Jiangsu Province (No. BK20141397); the Research Fund for the Doctoral Program of Higher Education of China (No. 20120092120042]; the CMA L'OREAL China Skin Grant 2015 (No. S2015121421) and the Open Research Fund of State Key Laboratory of Natural Medicines, China Pharmaceutical University (No. SKLNMKF201803), Southeast University and Nanjing Medical University Cooperation Project (No. 2242018K3DN14).
| [1] |
K.S. Novoselov, A.K. Geim, S.V. Morozov, et al., Science 306 (2004) 666-669. DOI:10.1126/science.1102896 |
| [2] |
F. Kargar, Z. Barani, M. Balinskiy, et al., Adv. Electron. Mater. 5 (2019) 1800558. DOI:10.1002/aelm.201800558 |
| [3] |
E. Pop, V. Varshney, A.K. Roy, MRS Bull. 37 (2012) 1273-1281. DOI:10.1557/mrs.2012.203 |
| [4] |
R. Prabakaran, J.P.N. Kumar, D.M. Lal, et al., J. Therm. Anal. Calorim. 139 (2020) 941-952. DOI:10.1007/s10973-019-08458-4 |
| [5] |
Y. Qu, S. Wang, D. Zhou, et al., Renew. Energ. 146 (2020) 2637-2645. DOI:10.1016/j.renene.2019.08.098 |
| [6] |
F. Xue, Y. Lu, X.D. Qi, et al., Chem. Eng. J. 365 (2019) 20-29. DOI:10.1016/j.cej.2019.02.023 |
| [7] |
K.M.F. Shahil, A.A. Balandin, Solid State Commun. 152 (2012) 1331-1340. DOI:10.1016/j.ssc.2012.04.034 |
| [8] |
K.M.F. Shahil, A.A. Balandin, Nano Lett. 12 (2012) 861-867. DOI:10.1021/nl203906r |
| [9] |
J.E. Parrott, A.D. Stuckes, Phys. Today 30 (1977) 60-61. DOI:10.1063/1.3037717 |
| [10] |
R.C. Weast, M.J. Astle, W.H. Beyer, et al., Am. J. Med. Sci. 257 (1982) 423. |
| [11] |
C.A. Polanco, L. Lindsay, Phys. Rev. B 97 (2018) 014303. DOI:10.1103/PhysRevB.97.014303 |
| [12] |
H.K. Liu, Y. Lin, S.N. Luo, J. Phys. Chem. C 118 (2014) 24797-24802. DOI:10.1021/jp508035b |
| [13] |
G. Wu, B. Li, Phys. Rev. B: Condens. Matter. 76 (2007) 085424. DOI:10.1103/PhysRevB.76.085424 |
| [14] |
N. Yang, G. Zhang, B. Li, Appl. Phys. Lett. 93 (2008) 190-192. |
| [15] |
G. Wu, B. Li, J. Phys. Condens. Matter 20 (2008) 075435. |
| [16] |
A. Barreiro, R. Rurali, E.R. Hernandez, et al., Science 320 (2008) 775-778. DOI:10.1126/science.1155559 |
| [17] |
T. Chang, H. Zhang, Z. Guo, et al., Phys. Rev. Lett. 114 (2015) 015504. DOI:10.1103/PhysRevLett.114.015504 |
| [18] |
Z.G. Shao, B.Q. Ai, W.R. Zhong, Appl. Phys. Lett. 104 (2014) 013106. DOI:10.1063/1.4861472 |
| [19] |
B.Q. Ai, W.R. Zhong, B.B. Hu, J. Phys. Chem. C 116 (2012) 13810-13815. DOI:10.1021/jp303431k |
| [20] |
Z.X. Xie, Y. Zhang, X. Yu, et al., J. Appl. Phys. 115 (2014) 104309. DOI:10.1063/1.4868595 |
| [21] |
Z.X. Xie, J.Z. Liu, X. Yu, et al., J. Appl. Phys. 117 (2015) 114308. DOI:10.1063/1.4915887 |
| [22] |
N. Mingo, Phys. Rev. B 74 (2006) 125402. DOI:10.1103/PhysRevB.74.125402 |
| [23] |
J.S. Wang, J. Wang, T. Lu, J. Eur. Phys. J. B 62 (2008) 381-404. DOI:10.1140/epjb/e2008-00195-8 |
| [24] |
Y. Xu, J.S. Wang, W.H. Duan, et al., Phys. Rev. B 78 (2008) 224303. DOI:10.1103/PhysRevB.78.224303 |
| [25] |
T. Yamamoto, K. Watanabe, Phys. Rev. Lett. 96 (2006) 255503. DOI:10.1103/PhysRevLett.96.255503 |
| [26] |
R.S. Ruoff, D.C. Lorents, Carbon 33 (1995) 925-930. DOI:10.1016/0008-6223(95)00021-5 |
| [27] |
R.L. Rowley, M.M. Painter, Int. J. Thermophys. 18 (1997) 1109-1121. DOI:10.1007/BF02575252 |
| [28] |
D.W. Brenner, Phys. Rev. B 42 (1990) 9458-9471. DOI:10.1103/PhysRevB.42.9458 |
| [29] |
T. Feng, X. Ruan, Z. Ye, et al., Phys. Rev. B 91 (2015) 224301. DOI:10.1103/PhysRevB.91.224301 |
| [30] |
X. Li, J. Chen, C. Yu, et al., Appl. Phys. Lett. 103 (2013) 2013. |
| [31] |
M. Hu, X. Zhang, D. Poulikakos, Phys. Rev. B 87 (2013) 195417. DOI:10.1103/PhysRevB.87.195417 |
| [32] |
J.Y. Kim, J.H. Lee, J.C. Grossman, ACS Nano 6 (2012) 9050-9057. DOI:10.1021/nn3031595 |
| [33] |
Y. Zhang, Q.X. Pei, C.M. Wang, et al., J. Phys. Chem. C 122 (2018) 22783-22789. DOI:10.1021/acs.jpcc.8b08015 |
| [34] |
F. Liu, R. Zou, N. Hu, et al., Nanoscale 11 (2019) 4067-4072. DOI:10.1039/C8NR10468A |
| [35] |
J. Chen, G. Zhang, B. Li, Nanoscale 5 (2013) 532-536. DOI:10.1039/C2NR32949B |
| [36] |
V.P. Carey, G. Chen, C. Grigoropoulos, et al., Nanoscale Microscale Thermophys. Eng. 12 (2008) 1-60. DOI:10.1080/15567260801917520 |
| [37] |
M. Omini, A. Sparavigna, B. Physica 212 (1995) 101-112. DOI:10.1016/0921-4526(95)00016-3 |
| [38] |
L. Lindsay, D.A. Broido, N. Mingo, Phys. Rev. 82 (2010) 115427. DOI:10.1103/PhysRevB.82.115427 |
| [39] |
L. Lindsay, D.A. Broido, N. Mingo, Phys. Rev. B 80 (2009) 125407. DOI:10.1103/PhysRevB.80.125407 |
| [40] |
Z.G. Wang, P.J. Li, Y.F. Chen, et al., J. Mater. Chem. C 3 (2015) 6301-6306. |
| [41] |
J.Y. Li, L. Lin, D.R. Rui, et al., ACS Nano 11 (2017) 4641-4650. DOI:10.1021/acsnano.7b00313 |
| [42] |
L.S. Panchokarla, K.S. Subrahmanyam, S.K. Saha, et al., Adv. Mater. 21 (2009) 4726-4730. |
| [43] |
H.B. Wang, T. Maiyalagan, X. Wang, ACS Catal. 2 (2012) 781-794. DOI:10.1021/cs200652y |
| [44] |
Z.H. Sheng, H.L. Gao, W.J. Bao, et al., J. Mater. Chem. 22 (2012) 390-395. DOI:10.1039/C1JM14694G |
| [45] |
S.J. Zhang, S.S. Lin, X.Q. Li, et al., Nanoscale 8 (2016) 226-232. DOI:10.1039/C5NR06345K |
| [46] |
C.J. Li, G. Li, H.J. Zhao, J. Appl. Phys. 118 (2015) 7. |
| [47] |
Y. Li, N. Chopra, Carbon 77 (2014) 675-687. DOI:10.1016/j.carbon.2014.05.073 |
| [48] |
A.N. Volkov, L.V. Zhigilei, Appl. Phys. Lett. 101 (2012) 203508. |
| [49] |
J. Yang, S. Waltermire, Y. Chen, et al., Appl. Phys. Lett. 96 (2010) 98-117. |
| [50] |
E. Loginova, S. Nie, K. Thuermer, et al., Phys. Rev. B 80 (2009) 085430. DOI:10.1103/PhysRevB.80.085430 |
| [51] |
H.J. Park, J. Meyer, S. Roth, et al., Carbon 48 (2010) 1088-1094. DOI:10.1016/j.carbon.2009.11.030 |
| [52] |
T.R. Albrecht, H.A. Mizes, J. Nogami, et al., Appl. Phys. Lett. 52 (1988) 362-364. DOI:10.1063/1.99465 |
| [53] |
R. Grantab, V.B. Shenoy, R.S. Ruoff, Science 330 (2010) 946-948. DOI:10.1126/science.1196893 |
| [54] |
Y. Liu, B.I. Yakobson, Nano Lett. 10 (2010) 2178-2183. DOI:10.1021/nl100988r |
| [55] |
O.V. Yazyev, S.G. Louie, Nat. Mater. 9 (2010) 806-809. DOI:10.1038/nmat2830 |
| [56] |
B.D. Kong, S. Paul, M.B. Nardelli, et al., Phys. Rev. B 80 (2009) 033406. |
| [57] |
A. Bagri, S.P. Kim, R.S. Ruoff, et al., Nano Lett. 11 (2011) 3917-3921. DOI:10.1021/nl202118d |
| [58] |
O.V. Yazyev, S.G. Louie, Phys. Rev. B 81 (2010) 195420. DOI:10.1103/PhysRevB.81.195420 |
| [59] |
T. Ma, Z. Liu, J. Wen, et al., Nat. Commun. 8 (2017) 14486. DOI:10.1038/ncomms14486 |
| [60] |
P.Y. Huang, C.S. Ruiz-Vargas, A.M. Van Der Zande, et al., Nature 469 (2011) 389-392. DOI:10.1038/nature09718 |
| [61] |
Z.L. Li, Z.M. Li, H.Y. Cao, et al., Nanoscale 6 (2014) 4309-4315. DOI:10.1039/C3NR06823D |
| [62] |
Y. Lu, J. Guo, Appl. Phys. Lett. 101 (2012) 5. |
| [63] |
E. Mervinetsky, I. Alshanski, Y. Hamo, et al., Sci. Rep.-UK 9498 (2017) 9498. |
| [64] |
M. Li, H. Zhou, Y. Zhang, et al., Carbon 130 (2018) 295-303. DOI:10.1016/j.carbon.2017.12.110 |
| [65] |
S.E. Krasavin, V.A. Osipov, EPL 113 (2016) 3. |
| [66] |
D. Yoon, Y.W. Son, H. Cheong, Phys. Rev. Lett. 106 (2011) 4. |
| [67] |
I. Calizo, I. Bejenari, M. Rahman, et al., J. Appl. Phys. 106 (2009) 666. |
| [68] |
W.R. Zhong, M.P. Zhang, B.Q. Ai, et al., Appl. Phys. Lett. 98 (2011) 202105. DOI:10.1063/1.3591173 |
| [69] |
D.L. Nika, E.P. Pokatilov, A.S. Askerov, et al., Phys. Rev. B 79 (2009) 12. |
| [70] |
M. Fujii, X. Zhang, H. Xie, et al., Phys. Rev. Lett. 95 (2005) 065502. DOI:10.1103/PhysRevLett.95.065502 |
| [71] |
S. Ghosh, W. Bao, D.L. Nika, et al., Nat. Mater. 9 (2010) 555-558. DOI:10.1038/nmat2753 |