 2021, Vol. 32


b PHI China Analytical Laboratory, CoreTech Integrated Limited, Nanjing 211102, China;
c Laboratory of Clean Energy Chemistry and Materials, State Key Laboratory of Solid Lubrication, Lanzhou Institute of Chemical Physics, Chinese of Academy of Sciences, Lanzhou 730000, China;
d CAS Key Laboratory of Molecular Nanostructure and Nanotechnology, Institute of Chemistry, Chinese Academy of Sciences, Beijing 100190, China
The solid-electrolyte interphase (SEI) is a passivation layer formed on the surface of a Li (ion) battery anode generated by the decomposition of the electrolyte at low reductive potentials of the anode [1]. An ideal SEI should be mechanically robust and electrically insulating while being ionically conductive, to inhibit further electrolyte decomposition and loss of anode capacity. The presence of a stable SEI is thus indispensable to the reversible and stable cycling performance of a battery [2]. For Li metal anodes, a stable SEI is even more critical due to the extremely low reductive potential of Li (-3.045 V versus the standard hydrogen electrode), which makes it highly reactive towards electrolytes. Moreover, the very high theoretical capacity of the Li metal anode (3860 mAh/g) is invariably associated with significant volume change, which can break the SEI and expose fresh Li to the electrolyte triggering the formation of a new SEI and dead Li, causing dendritic Li growth and rapid capacity decay. Considerable efforts have been made in recent times to achieve an optimal SEI. For example, it was noted that the introduction of some inorganic salts as additives to the electrolyte increased the chemical stability of the SEI by changing its composition and inhibiting side reactions to significantly improve the cycling performance of Li metal anodes [3, 4]. Recently, more approaches have been proposed to obtain a thinner and more stable SEI layer, such as the employment of special anions and highly concentrated electrolyte [5-7]. Moreover, artificial SEIs composed of carbon materials, polymers, inorganic conductive compounds, and electrochemically active metals have been reported to suppress parasitic reactions of Li metal in liquid electrolytes [8-11].
To obtain a stable SEI, it is vital to understand how its structure, composition, and more importantly, its mechanical properties evolve on an active anode surface. In this context, significant efforts have been made over the last few decades to elucidate the role of solvents and additives in the formation and evolution of SEI on different anode materials [12, 13]. However, understanding the SEI is very challenging due to its complexity in structure and composition, which are not fixed but evolve over time and during cycling. Although a variety of methods have been used to characterize the nature of the SEI [14, 15], much less is known about how its mechanical properties change during battery cycles, which is extremely important for its stability and consequently for the cycling stability of the electrode.
Electrochemical quartz-crystal microbalance with dissipation monitoring (EQCM-D) is a powerful tool for the in-situ measurement of interfacial behavior. This technique, although used initially for the quantitative characterization of the viscoelastic properties of polymeric coatings, has great potential for interface analysis in Li (ion) batteries [16]. When adsorbates begin to form on a test substrate (a Cu coated quartz plate in this case), the mass change (Δm) of the adsorbates on the substrate surface can be converted to change in resonant frequency (Δf) of the quartz crystal through the piezoelectric effect. The change in mass can be measured with an accuracy as high as nanogram per square centimeter [17]. This technique can thus be used to monitor the change in mass of a thin film without damaging it. In addition, by monitoring the energy dissipation (ΔD), which is essentially a physical quantity related to the rate of decay of the oscillation amplitude of the wafer once the applied electric field is turned off, a series of viscoelastic properties (including shear modulus and viscosity) can be measured [18]. Previous studies have demonstrated the efficacy of EQCM-D as an effective and reliable tool to detect changes in mechanical properties of battery electrodes [19-21].
In this work, we employed EQCM-D to in-situ monitor SEI formation when the electrode potential was decreased from open-circuit voltage (OCV) to 0 V (versus Li/Li+). The mass, shear modulus, and viscosity of the SEI were recorded in a time-resolved manner in three electrolytes and the results were compared. The masses of the SEIs formed in propylene carbonate (PC)-, ethylene carbonate/diethyl carbonate (EC/DEC)-, and tetraethylene glycol dimethyl ether (TEGDME)-based electrolytes were quantitatively measured to be 20.9, 4.7 and 2.4 μg/cm2, respectively, indicating the highly reactive nature of PC and the much more inert nature of TEGDME. The calculated values of the mass-change-per-mole-of-electron-transferred (mpe) point to the deposition of lithium carbonate and long-chain organic carbonates in PC- and EC/DEC-based electrolytes, while lithium oxide, lithium formate, and short-chain polyethers with -OLi edge groups are the major components in the TEGDME-based electrolytes; these results are in accordance with X-ray photoelectron spectroscopy (XPS) analysis. In PC- and EC/DEC-based electrolytes, SEI formation involves the initial deposition of a rigid layer followed by the growth of a viscoelastic layer on top. This is considerably different from the SEI formed in a TEGDME-based electrolyte, which remains rigid during the entire process. The estimated shear moduli of the SEIs formed in PC-, EC/DEC- and TEGDME-based electrolytes are 20, 26 and > 100 GPa, respectively. The thin yet much stiffer SEI formed in TEGDME or other ether-based electrolytes should be responsible for the improved electrochemical performance of Li metal anodes in these media.
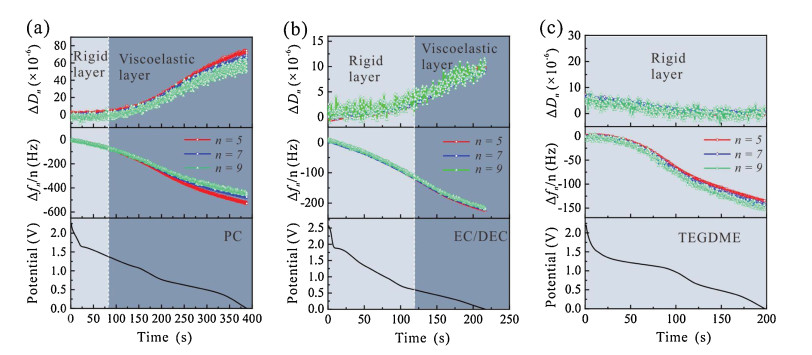
To study the effect of solvent on the SEI, EQCM-Danalyses were performed in a two-electrode cell with copper coated quartz plate (Cu/quartz) as the working electrode and a Li coated stainless steel plate functioned as the counter electrode (Fig. S1 in Supporting Information). The Δf and ΔD signals were generated due to the piezoelectric effect of the quartz substrate during the generation of the SEI at the Cu surface. EC/DEC mixture (1:1, v/v) is a widely used solvent in commercial Li-ion batteries as it can form a nearly ideal SEI on a graphite anode, while PC, though differing by only one methyl group from EC, does not form a protective SEI [22]. TEGDME, being relatively non-flammable, is a promising ether-based solvent for high-energy Li metal batteries to ensure safe long-term operation [23]. All the three solvents containing 1.0 mol/L LiClO4 were tested to study the effect of solvent on the formation of SEI. LiClO4 is applied instead of the LiPF6, a salt more widely used in commercial electrolytes, to avoid the formation of HF, which can etch away the 100 nm-thick Cu coating from the quartz substrate, leading to the electrode failure in about tens of minutes. Electrochemical measurements were performed in the voltage range from the open-circuit voltage (OCV) of the cell, which was then discharged to 0 V at a low current density (0.1 mA/cm2) to generate an initial SEI layer on the Cu/quartz substrate. The SEI formed in the initial discharge plays a key role in the electrode performance [24].Fig. 1 presents the time dependence of the change in dissipation (ΔDn) and the normalized frequency shift (Δfn/n) of the Cu/quartz electrode forvariousharmonics (n=5, 7, 9) along with the potential of the Cu/quartz electrode. ΔDn and Δfn/n are closely related to the elasticity and viscosity of the film deposited at the Cu/quartz substrate and are key parameters in the analysis of the physical properties of the SEI on the electrode surface. It is worth noting that the ΔDn and Δfn/n values measured at lower overtones (n=1, 3) were not selected for analysis due to their testing ranges being close to the boundary of the quartz plate, which may introduce uncertainties in the measured values. InFig. 1, it is observed that Δfn/n curves traced in different electrolytes show a downward trend with discharge time, indicating a monotonous increase in the mass deposited on the Cu/quartz surface. The ΔDn values measured in carbonate-based electrolytes (PC and EC/DEC) increase considerably to ΔDn > 10×10−6, while that measured in the ether-based electrolyte (TEGDME) shows only a very small variation. Combing ΔDn, Δfn/n, and the discharge potential (V), we can further analyze the mechanical properties of the SEI formed on the Cu/quartz electrodes.

|
Download:
|
| Fig. 1. Plots showing the shift in energy dissipation ΔDn and the normalized frequency shift Δfn/n acquired by EQCM-D, and the working electrode potential during the first discharge process at 0.1 mA/cm2 from OCV to 0 V in electrolytes containing (a) PC, (b) EC/DEC and (c) TEGDME as solvent and 1.0 mol/L LiClO4 as salt. | |
Two different models were applied to analyze the mechanical properties of the films deposited on the Cu/quartz surface in the different electrolytes. For a dense thin film that is rigid, we can use the Sauerbrey equation (Δf = −Cf Δm), where is the sensitivity factor of the crystal (Cf=0.056 Hz ng−1 cm-2), to describe the linear relationship between the frequency change (Δf) and the mass increase (Δm) of the thin film from which, the specific mass change can be estimated [25]. In contrast, a viscoelastic film on the quartz substrate has to be modeled using the Kelvin-Voigt model which combines viscous and elastic components in parallel using Δf and ΔD as input data. This analysis, after curve fitting, gives information on the mass, shear elasticity, and viscosity of the film [18]. There are various explanations for how to determine whether the viscoelastic model fits to the film deposited on the quartz surface in previous reports [19, 26]. One of the accepted methods is that a rigid film on a vibrating quartz substrate results in Δfn/n over ΔDn (n=5) of < −40×106 Hz [19]. On the contrary, if Δfn/n over ΔDn (n=5) is > −40×106 Hz, the film can be analyzed using the viscoelastic model (Fig. S2 in Supporting information). For the SEIs formed in the two carbonate-based electrolytes (Figs. 1a and b), a rigid layer is observed prior to the deposition of a viscoelastic layer, which is in accordance with previous reports on the two-layer structure of the SEI formed on a graphite anode in carbonate-based electrolytes [27]. However, in the ether-based electrolyte (Fig. 1c), a distinctly different process takes place with the formation of only a rigid layer.
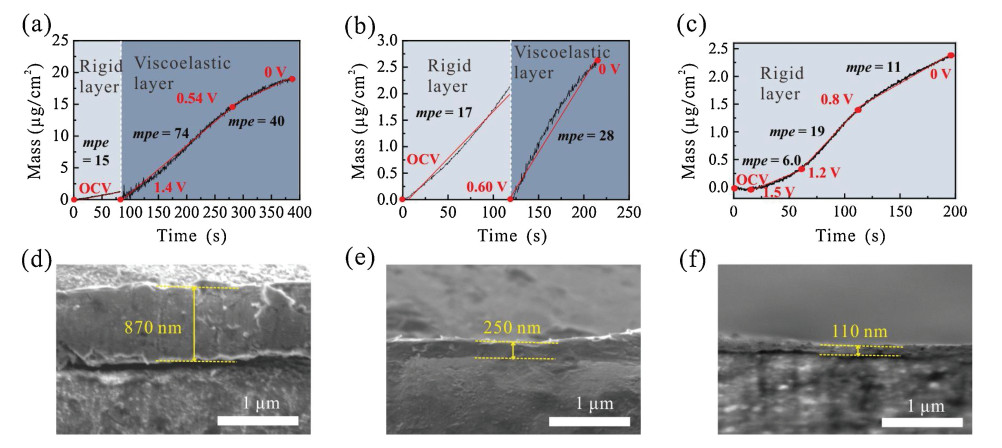
Fig. 2 shows the mass change of the Cu/quartz electrode with discharge time in PC-, EC/DEC- and TEGDME-based electrolytes, which are derived from the Sauerbrey equation and Kelvin-Voigt model for the rigid and viscoelastic layer, respectively. The details of the fitting parameters and results by Kelvin-Voigt model are given in Table S1 and Fig. S3 (Supporting information) to get optimized fitting results by minimizing the χ2.

|
Download:
|
| Fig. 2. Mass changes estimated from EQCM-D data modeling results during the first discharge process from OCV to 0 V in (a) PC-, (b) EC/DEC- and (c) TEGDME-based electrolytes. The first layer closest to the Cu electrode was fitted to the Sauerbrey equation and the second layer was fitted using the Kelvin-Voigt model; the values of mpe are shown along with for clarity. SEM images of the SEI cross sections on the copper electrode in (d) PC-, (e) EC/DEC- and (f) TEGDME-based electrolytes when charged to 0 V and held at 0 V for 10 min. The discharge current density was 0.1 mA/cm2 in all cases. | |
In PC-based electrolytes (Fig. 2a), the electrode potential decreases from OCV to 1.4 V in 82 s. During this stage, the adsorbates on the electrode surface can be modeled as a rigid layer, which has an areal mass density of 1.4 μg/cm2 and mpe of 15 g/mol calculated using the Sauerbrey equation. The detailed mpe calculation methods are shown in Note 1 (Supporting information). This low mpe detected by EQCM-D at potential > 1.4 V can be ascribed to the formation of lithium oxides on the surface of the copper substrate accompanied by the reduction of copper oxide [28]. When the electrode potential is < 1.4 V, the coating on the electrode surface changes to a viscoelastic layer, indicating that a "soft" SEI starts to be generated, the mass of which increases rapidly with discharge time to reach 19.5 μg/cm2 at the electrode potential of 0 V; this behavior is consistent with a previously reported conclusion that the SEI formation process starts from 1.4 V in PC [29]. The viscoelastic layer formation in the PC-based electrolyte (potential range of 1.4–0 V) can be divided into two regions according to the different mpe values (Fig. 2a). In the range of 1.4–0.54 V, the decomposition of PC generates high molecular weight species with mpe of 74, which we attribute to the formation of organic carbonates, e.g., (CH3)2CHOCO2Li. In contrast, in the voltage range of 0.54–0 V, low molecular weight species (mpe of 40), for example, lithium carbonate (Li2CO3), are the main reduction products [29]. Overall, the total mass of the rigid and viscoelastic layers formed at the electrode surface in the PC-based electrolyte is 20.9 μg/cm2.
In EC/DEC-based electrolyte (Fig. 2b), a rigid layer with an areal mass of 2.1 μg/cm2 and mpe of 17 is first formed (potential range of OCV–0.6 V), followed by the generation of a viscoelastic layer during the subsequent discharge process (potential < 0.6 V). The formation of the viscoelastic SEI layer in EC/DEC starts at the electrode potential of 0.6 V, which is much lower than the value (1.4 V) observed in the PC-based electrolyte, indicating delayed electrolyte decomposition. Furthermore, in the potential range of 0.6–0 V, the mpe value remains at about 28 g/mol, indicating that the chemical reaction occurring on the electrode surface is different from that in PC. Considering the conclusions from previous research of other groups, this process should involve the reduction of EC, and the formation of lithium ethylene dicarbonate (LEDC) and Li2CO3 [29, 30]. Note that the total mass of the rigid and viscoelastic layers formed in the EC/DEC-based electrolyte is 4.7 μg/cm2, which is only 22.5% of that formed in the PC-based electrolyte (20.9 μg/cm2), indicating a greatly reduced decomposition of EC/DEC than PC. Moreover, monitoring the change in mpe, we find that in PC, the principal component of the SEI is formed in the potential range of 1.4–0.54 V with a large mpe (Fig. 2a), which is absent in EC/DEC (Fig. 2b).
When the ether-based electrolyte TEGDME replaced the carbonate-based electrolyte, a completely different profile is observed in the mass-time curve (Fig. 2c). Dissipation (ΔDn) continuously approached zero during the whole discharge process, showing a rigid electrode surface throughout the SEI deposition process. When the electrode potential is reduced to 0 V, the overall increase in electrode mass is only ~2.4 μg/cm2, which is much smaller than those obtained in the PC- (20.9 μg/cm2) and EC/DEC- (4.7 μg/cm2) based electrolytes. Moreover, the lower average mpe in all the regions as compared to PC and EC/DEC shows that the degree of electrolyte decomposition is relatively low and the products are mostly small molecular compounds with short chains. These different SEI formation processes in ether and carbonate electrolytes result in significant differences in the final SEI composition and mass. The mass ratio of the SEIs generated in PC-, EC/DEC-, and TEGDME-based electrolytes is 9:2:1. Considering that these predicted possible SEI products have similar density (around 2 g/cm 3) [19, 31], we infer that the SEI is the thickest in PC and the thinnest in TEGDME. To obtain the cross sectional-thickness of the SEI, the electrode potential was reduced from OCV to 0 V and held at 0 V for 10 min to yield a thick SEI that is visible in SEM. The cross-sectional thicknesses of the SEI in PC-, EC/DEC- and TEGDME- based electrolytes are ~870, ~250 and ~110 nm, respectively. This trend of thickness variation is in accordance with the EQCM-D results.
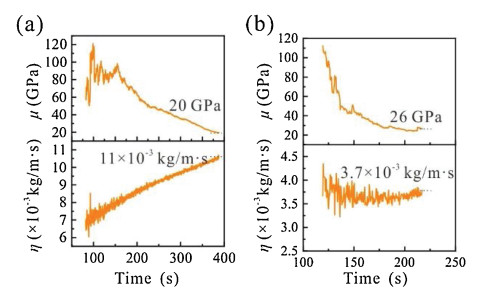
About the viscoelastic properties, fitting parameters are included only for PC and EC/DEC (Supporting Information Table S1), because the film in TEGDME is rigid enough to be characterized as a Sauerbrey layer. As shown in Fig. 3, in PC- and EC/DEC-based electrolytes, with the formation of SEI, the shear modulus ( μ) continues to decrease and the viscosity (η) continues to increase, indicating the formation of a "soft material" at the electrode/electrolyte interface [32]. The initial shear modulus derived from the viscoelastic model is ~100 GPa, indicating that prior to the deposition of the viscoelastic layer, the stiff SEI that covered the electrode still behaves like a rigid structure. It also means the shear modulus of SEI generated in TEGDME is larger than 100 GPa. When the potential is down to 0 V, the SEI in PC still preserves a certain rigidity ( μ =20 GPa) and the shear modulus is higher than the previously reported value, which could be due to the non-uniform distribution of Li2CO3 [33]. Besides, in the PC-based electrolyte, the viscosity increases to 11×10−3 kg m-1 s-1 with SEI formation (Fig. 3a). In contrast, using an EC/DEC-based electrolyte results in an SEI with a slightly higher shear modulus ( μ=26 GPa) and much lower viscosity (η = 3.7×10⁻³ kg m-1 s-1) than in a PC-based electrolyte, indicating the greater rigidity of the SEI formed in this electrolyte (Fig. 3b). It is worth noting that the mechanical properties as measured by QCM are averaged over the whole electrode interface. The actual SEI may not be homogeneous and the shear modulus in some regions may be relatively small.

|
Download:
|
| Fig. 3. The change in viscoelastic properties, shear modulus ( μ) and viscosity (η) in real-time during SEI formation in (a) PC- and (b) EC/DEC-based electrolytes calculated using the Kelvin-Voigt model. | |
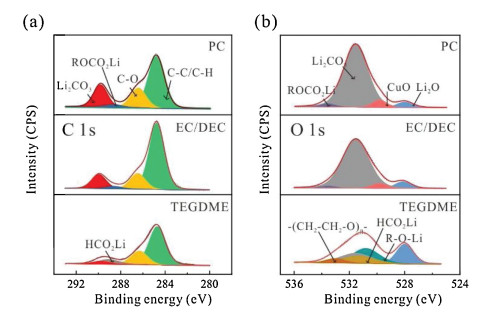
To understand the difference in mechanical properties of the SEIs formed in carbonate and ether-based electrolytes, the chemical compositions of the SEIs were analyzed by XPS (Fig. 4). The specimens for XPS analysis were transferred in an argon-filled tube to avoid exposure to moisture or oxygen. The atom ratios of the Li, C, O and Cl elements in the SEI formed in different electrolytes are shown in Table S2. The atom ratios of Cl detected from the SEI are about two orders of magnitude lower than Li, C and O, indicating that the SEI mass originated from the decomposition of LiClO4 is very low. Note that the SEI films formed in both PC- and EC/DEC-based electrolytes comprise a rigid layer covered by a viscoelastic layer. Though the total areal mass (thickness) of the SEI formed in PC is much larger than that in EC/DEC, the shear modulus of the SEI formed in the carbonate-based electrolytes are quite close (20 and 26 GPa for the SEIs formed in PC and EC/DEC, respectively). The C 1s (Fig. 4a) and O 1s (Fig. 4b) spectra of the SEIs formed in PC and EC/DEC are also very close, both presenting pronounced signals that can be assigned to Li2CO3 (289.8 eV in C 1s and 531.5 eV in O 1s), Li2O (528.1 eV in O 1s), and lithium alkyl carbonate (ROCO2Li, 288.6 eV in C 1s and 533.5 eV in O 1s spectra), which are commonly observed in carbonate-based electrolytes [34, 35]. Notably, a CuO peak (529.8 eV in O 1s) also appears (Fig. 4b), probably due to the partial oxidation of the Cu electrode. However, for the SEI formed in TEGDME-based electrolyte, small molecular species, such as Li formate (HCO2Li, 289.1 eV in C 1s and 531.3 eV in O 1s), short-chain polyethers with -OLi edge groups (530.8 and 533.0 eV in O 1s) and Li2O are the main components [36, 37]. These conclusions on the chemical composition of SEIs as revealed by XPS analysis are consistent with those determined from mpe analysis using the EQCM-D technique. Thus, the considerable difference in chemical composition between the SEIs formed in the carbonate- and ether-based electrolytes should be the reason for their different mechanical properties.

|
Download:
|
| Fig. 4. XPS of the SEIs on Cu surface in different electrolytes. (a) C 1s, (b) O 1s XPS spectra of the SEI at 0 V. | |
In conclusion, the mechanical properties of SEIs were monitored in-situ using EQCM-D, which provides quantitative values of the areal mass, shear modulus, and viscosity. The different trends in frequency (Δf) and dissipation changes (ΔD) as measured by EQCM-D indicate that SEIs in PC- and EC/DEC-based electrolytes are formed initially by growing a rigid layer followed by a viscoelastic overlayer. In contrast, a distinct "one-layer" rigid model is found to be applicable for the analysis of the SEI formed in the TEGDME-based electrolyte. This implies that the structure and composition of the SEIs formed in the TEGDME-based electrolyte cannot be reliably modeled using the widely accepted two-layer model. Moreover, SEI masses reached 20.9 and 4.7 μg/cm2 in PC- and EC/DEC-based electrolytes, respectively, compared to 2.4 μg/cm2 of SEI in TEGDME-based electrolyte. However, the shear modulus of the SEI in TEGDME is more than five times that in PC- and EC/DEC-based electrolytes and the shear modulus decreased and viscosity increasedcontinuously during the formation of the SEI. This in-situ technique will thus serve to advance our understanding of the SEI formation and its stability in other types of Li (ion) batteries and provide new ideas for SEI and electrolyte design in the future.
Declaration of competing interestThe authors declare that they have no known competing financial interests or personal relationships that could have appeared to influence the work reported in this paper.
AcknowledgmentsWe appreciate funding from the Natural Science Foundation of China (Nos. 51761145046, 21975243 and 51672262), support from the 100 Talents Program of the Chinese Academy of Sciences, the National Program for Support of Top-notch Young Professionals, and iChEM.
Appendix A. Supplementary dataSupplementary material related to this article can be found, in the online version, at doi:https://doi.org/10.1016/j.cclet.2020.09.008.
| [1] |
Y. Gao, Z. Yan, J.L. Gray, et al., Nat. Mater. 18 (2019) 384-389. DOI:10.1038/s41563-019-0305-8 |
| [2] |
X.B. Cheng, R. Zhang, C.Z. Zhao, Q. Zhang, Chem. Rev. 117 (2017) 10403-10473. DOI:10.1021/acs.chemrev.7b00115 |
| [3] |
S. Li, S. Fang, H. Dou, X. Zhang, ACS Appl. Mater. Interfaces 11 (2019) 20804-20811. DOI:10.1021/acsami.9b03940 |
| [4] |
Y. Ouyang, Y. Guo, D. Li, et al., ACS Appl. Mater. Interfaces 11 (2019) 11360-11368. DOI:10.1021/acsami.8b21420 |
| [5] |
Z. Wang, F. Qi, L. Yin, et al., Adv. Energy Mater. 10 (2020) 1903843. DOI:10.1002/aenm.201903843 |
| [6] |
X. Zhang, ACS Energy Lett. 4 (2019) 411-416. DOI:10.1021/acsenergylett.8b02376 |
| [7] |
Y. Zhou, M. Su, X. Yu, et al., Nat. Nanotechnol. 15 (2020) 224-230. DOI:10.1038/s41565-019-0618-4 |
| [8] |
G. Zheng, S.W. Lee, Z. Liang, et al., Nat. Nanotechnol. 9 (2014) 618-623. DOI:10.1038/nnano.2014.152 |
| [9] |
I.C. Jang, S. Ida, T. Ishihara, J. Electrochem. Soc. 161 (2014) A821-A826. DOI:10.1149/2.087405jes |
| [10] |
N.W. Li, Y.X. Yin, C.P. Yang, Y.G. Guo, Adv. Mater. 28 (2016) 1853-1858. DOI:10.1002/adma.201504526 |
| [11] |
L. Ma, M.S. Kim, L.A. Archer, Chem. Mater. 29 (2017) 4181-4189. DOI:10.1021/acs.chemmater.6b03687 |
| [12] |
S.S. Zhang, J. Power Sources 162 (2006) 1379-1394. DOI:10.1016/j.jpowsour.2006.07.074 |
| [13] |
R.W. Schmitz, P. Murmann, R. Schmitz, et al., Prog. Solid State Chem. 42 (2014) 65-84. DOI:10.1016/j.progsolidstchem.2014.04.003 |
| [14] |
K. Ni, X. Wang, Z. Tao, et al., Adv. Mater. 31 (2019) 1808091. DOI:10.1002/adma.201808091 |
| [15] |
A.M. Andersson, A. Henningson, H. Siegbahn, U. Jansson, K. Edström, J. Power Sources 119-121 (2003) 522-527. |
| [16] |
V. Dargel, N. Shpigel, S. Sigalov, et al., Nat. Commun. 8 (2017) 1389. DOI:10.1038/s41467-017-01722-x |
| [17] |
M.D. Levi, N. Shpigel, S. Sigalov, et al., Electrochim. Acta 232 (2017) 271-284. DOI:10.1016/j.electacta.2017.02.149 |
| [18] |
M.V. Voinova, M. Rodahl, M. Jonson, B. Kasemo, Phys. Scr. 59 (1999) 391-396. DOI:10.1238/Physica.Regular.059a00391 |
| [19] |
Z. Yang, M.C. Dixon, R.A. Erck, L. Trahey, ACS Appl. Mater. Interfaces 7 (2015) 26585-26594. DOI:10.1021/acsami.5b07966 |
| [20] |
V. Dargel, N. Jäckel, N. Shpigel, et al., ACS Appl. Mater. Interfaces 9 (2017) 27664-27675. DOI:10.1021/acsami.7b06243 |
| [21] |
P.G. Kitz, M.J. Lacey, P. Novák, E.J. Berg, Anal. Chem. 91 (2019) 2296-2303. DOI:10.1021/acs.analchem.8b04924 |
| [22] |
K. Xu, J. Electrochem. Soc. 156 (2009) A751. DOI:10.1149/1.3166182 |
| [23] |
C.Ó. Laoire, S. Mukerjee, E.J. Plichta, M.A. Hendrickson, K.M. Abraham, J. Electrochem. Soc. 158 (2011) A302-A308. DOI:10.1149/1.3531981 |
| [24] |
K. Leung, J.L. Budzien, Phys. Chem. Chem. Phys. 12 (2010) 6583. DOI:10.1039/b925853a |
| [25] |
G. Sauerbrey, Z. Für Phys. 155 (1959) 206-222. DOI:10.1007/BF01337937 |
| [26] |
C. Larsson, M. Rodahl, F. Höök, Anal. Chem. 75 (2003) 5080-5087. DOI:10.1021/ac034269n |
| [27] |
Cresce Av., S.M. Russell, D.R. Baker, K.J. Gaskell, K. Xu, Nano Lett. 14 (2014) 1405-1412. DOI:10.1021/nl404471v |
| [28] |
M. Zhao, S. Kariuki, H.D. Dewald, et al., J. Electrochem. Soc. 147 (2000) 2874. DOI:10.1149/1.1393619 |
| [29] |
S.J. An, J. Li, C. Daniel, et al., Carbon 105 (2016) 52-76. DOI:10.1016/j.carbon.2016.04.008 |
| [30] |
V.A. Agubra, J.W. Fergus, J. Power Sources 268 (2014) 153-162. DOI:10.1016/j.jpowsour.2014.06.024 |
| [31] |
K. Kwon, F. Kong, F. McLarnon, J.W. Evans, J. Electrochem. Soc. 150 (2003) A229. DOI:10.1149/1.1538223 |
| [32] |
V. Stavila, J. Volponi, A.M. Katzenmeyer, M.C. Dixon, M.D. Allendorf, Chem. Sci. 3 (2012) 1531. DOI:10.1039/c2sc20065a |
| [33] |
H. Shin, J. Park, S. Han, A.M. Sastry, W. Lu, J. Power Sources 277 (2015) 169-179. DOI:10.1016/j.jpowsour.2014.11.120 |
| [34] |
R. Younesi, M. Hahlin, K. Edström, ACS Appl. Mater. Interfaces 5 (2013) 1333-1341. DOI:10.1021/am3026129 |
| [35] |
P. Verma, P. Maire, P. Novák, Electrochim. Acta 55 (2010) 6332-6341. DOI:10.1016/j.electacta.2010.05.072 |
| [36] |
S. Jiao, X. Ren, R. Cao, et al., Nat. Energy 3 (2018) 739-746. DOI:10.1038/s41560-018-0199-8 |
| [37] |
Y. Yang, D.M. Davies, Y. Yin, et al., Joule 3 (2019) 2050-2052. DOI:10.1016/j.joule.2019.07.012 |