 2021, Vol. 32


Alzheimer's disease (AD) is a degenerative disease of the central nervous system, which seriously endangers the health of the elderly and has a huge impact on society and the economy [1-3]. With the aging of the world population, the incidence rate of AD has increased dramatically [4, 5]. In the early stage of AD, amyloid-beta (Aβ) gradually polymerized and deposited to form amyloid plaque, which led to tau protein phosphorylation and nerve fiber tangle, eventually leading to neuron loss, degeneration, and dementia [6-8]. Among them, amyloid positron emission tomography (PET) and cerebrospinal fluid (CSF) analyses for amyloid, tau, and phospho-tau have been utilized in the diagnosis of AD [9-11]. However, those diagnostic methods are invasive surgery and expensive [12]. Therefore, it is essential to develop new diagnostic methods to effectively diagnose AD and monitor its progression.
The process of the amyloid plagues' formation process is as follows. Firstly, Aβ containing 39–43 residues is produced by the action of amyloid precursor protein (APP) [13]. The main components of Aβ are Aβ40 and Aβ42. Secondly, the Aβ monomer is rich in β-sheet structure, so it is easy to form oligomer and fibril that will lead to the neuron dysfunction [14]. These oligomers and fibrils will gradually aggregate and lead to the formation of nanofibers (NFS). The accumulation of NFS will eventually produce amyloid plaque protein. Recent studies have shown that the level of Aβ oligomer in serum is significantly positively correlated with the level in CSF samples [15]. Therefore, Aβ oligomer and fibril in the blood are considered to be one of the most direct and relevant biomarkers for the diagnosis of AD [16-18].
Lys-Leu-Val-Phe-Phe (KLVFF), a peptide sequence of Aβ fragment, is considered to be the main driving factor of Aβ fibrosis. This fragment has been proved to target Aβ and inhibit its fibrosis process through strong H-bond co-assembly [19, 20]. Moreover, this fragment is considered to be the key fragment for Aβ aggregates detection. Therefore, in this study, the process of self-assembly and structural transformation of KLVFF peptides was utilized for the detection of Aβ in AD.
In our previous work, visible fluorescent self-assembled dipeptide fluorescent nanoparticles (dPNPs) with biocompatibility and photostability have been designed and prepared [21]. Previous studies have demonstrated the feasibility of dPNPs as a functional nanoprobe for targeted cancer cell imaging and real-time monitoring of drug release. DPNPs were prepared through hydrogen bonding, aromatic side chain stacking, and zinc coordination [22-24]. After that, the similar peptide self-assembled fluorescent nanoprobes have been utilized for the detection of Aβ for AD diagnosis [25]. However, due to the lack of specific recognition, the detection efficiency is not satisfactory. The functional peptide GHK-Cu has also been successfully self-assembled into fluorescent peptide nanoparticles, which demonstrated the capability of zinc coordinated peptide self-assembly strategy could be applied to general functional peptide sequences [26]. Moreover, many peptide self-assembled nanomaterials have been utilized for drug delivery applications [27-30]. Inspired by the above fluorescent peptide self-assembly, the important peptide sequence KLVFF in Aβ that contains phenylalanine with the aromatic ring was proposed for the self-assembly. The Fmoc protecting group in Fmoc-KLVFF contains three aromatic rings, which could provide more π-π stacking in the self-assembly and detecting processes. Therefore, in this study, KLVFF and Fmoc-KLVFF could be self-assembled into fluorescent nanoparticles (KNPs and FKNPs) though a similar principle. These nanoparticles have unique nanostructures and can bind to Aβ aggregates through hydrogen bonding and aromatic ring interaction due to the KLVFF sequence and the Fmoc fragment. The fluorescence intensity of KNPs and FKNPs was changed significantly due to the combination between those fluorescent nanoprobes and different formats of Aβ aggregates. Moreover, in cell experiments, KNPs and FKNPs have shown good biocompatibility and have a certain inhibitory effect on the process of Aβ fibrosis.
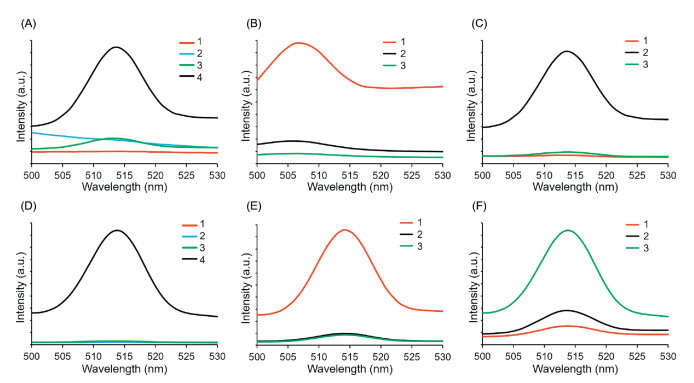
Detailed experimental procedures are shown in Supporting Information. To illustrate the molecular weight of the peptide and understand the KLVFF and Fmoc-KLVFF more intuitively, mass spectrograms of them were obtained (Figs. S1 and S2 in Supporting information). We started with the synthesis of zinc coordinated nanoparticles with fluorescence properties. The nano framework synthesized by zinc coordination is composed of a strong metal nitrogen bond, which has excellent chemical and thermal stability. In particular, phenylalanine can combine with Zn2+, thus maximizing the intermolecular interaction between peptides and forming ordered nanostructures. Moreover, phenylalanine and Fmoc protecting groups contain the aromatic ring, so π-π stacking interaction also can be used as a driving force of self-assembly. Based on the above principle of self-assembly, the peptide zinc complex was synthesized by using MeOH and NaOH as a solvent in a water bath at 85 ℃. The optical properties of nanoparticles were characterized by a fluorescence spectrometer. Before self-assembly, there was no obvious fluorescence emission peak in the range of 500−530 nm for KLVFF and Fmoc-KLVFF monomers. There are also no obvious fluorescence emission peaks in the range of 500−530 nm for KNPs and FKNPs that self-assembled without zinc ions or heating. After adding zinc ions and heating in the self-assembly process, obvious fluorescence emission signals were observed in KNPs and FKNPs. The highest fluorescence emission signal appeared at 515 nm, and the excitation wavelength was 370 nm (Figs. 1A and D). After that, the optimized conditions of the reaction system were investigated. The ratio of NaOH to MeOH is one of the key factors that can affect fluorescence intensity. Therefore, the ratio of 1:9, 2:8, and 9:1 was utilized for the self-assembly of KLVFF and Fmoc-KLVFF in 10 mL system respectively. Both of them have the strongest fluorescence intensity when the ratio is 1:9 (Figs. 1B and E). The higher amount of MeOH in the reaction system could decrease the reaction time and then induce more crystalline structure in the self-assembled nanoparticles, which is one of key factors for the fluorescence properties of KNPs and FKNPs. The concentration of NaOH is also very important to the fluorescence intensity. After determining the ratio of NaOH to MeOH, 1 mol/L, 0.1 mol/L, and 0.01 mol/L NaOH were selected for the self-assembly of KLVFF and Fmoc-KLVFF respectively. The experimental results have shown that KLVFF has the strongest fluorescence at the concentration of 0.1 mol/L NaOH (Fig. 1C), while Fmoc-KLVFF has the strongest fluorescence at the concentration of 0.01 mol/L NaOH (Fig. 1F). The different concentrations of NaOH in the reaction system can induce different pH values that could affect the self-assembly process through the zeta potential of KLVFF and Fmoc-KLVFF peptide sequences. Therefore, through the above experiments, the optimized self-assembly conditions for KNPs and FKNPs were achieved for the following detections.

|
Download:
|
| Fig. 1. Design and synthesis of the KNPs and FKNPs. (A) Fluorescence emission spectra of KLVFF in four different conditions with excitation wavelengths at 370 nm: 1. KLVFF monomers, 2. KNPs without Zn(Ⅱ), 3. KNPs room temperature, 4. KNPs. (B) Fluorescence emission spectra of KNPs under different NaOH: MeOH ratios: 1. KNPs (NaOH: MeOH = 1:9), 2. KNPs (NaOH: MeOH = 2:8), 3. KNPs (NaOH: MeOH = 5:5). (C) Fluorescence emission spectra of KNPs under different NaOH concentrations: 1. KNPs (1 mol/L NaOH), 2. KNPs (0.1 mol/L NaOH), 3. KNPs (0.01 mol/L NaOH). (D) Fluorescence emission spectra of Fmoc-KLVFF in four different conditions: 1. Fmoc-KLVFF monomers, 2. FKNPs without Zn(Ⅱ), 3. FKNPs room temperature, 4. FKNPs. (E) Fluorescence emission spectra of FKNPs under different NaOH: MeOH ratios: 1. FKNPs (NaOH: MeOH = 1:9), 2. FKNPs (NaOH: MeOH = 9:1), 3. FKNPs (NaOH: MeOH = 5:5). (F) Fluorescence emission spectra of FKNPs under different NaOH concentrations: 1. FKNPs (1 mol/L NaOH), 2. FKNPs (0.1 mol/L NaOH), 3. FKNPs (0.01 mol/L NaOH). | |
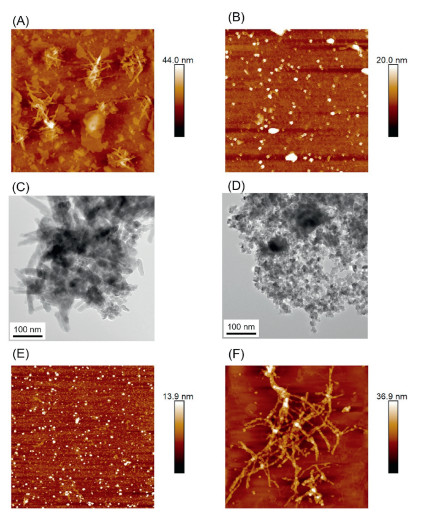
The morphological analysis of KNPs and FKNPs was operated by AFM and TEM. The results have shown that KNPs are irregular aggregations with a height of around 44 nm (Figs. 2A and C). FKNPs are spherical nanoparticles with more uniform dispersion and have a diameter of around 20 nm (Figs. 2B and D). The different self-assembled structures between KNPs and FKNPs could be the reason of the Fmoc group, which supplied more aromatic interactions for the uniform self-assembly. To verify the detecting ability of KNPs and FKNPs for AD diagnosis, different forms of Aβ42 aggregates were synthesized. The morphology of the Aβ oligomer (Fig. 2E) and Aβ fibrils (Fig. 2F) were characterized by AFM. The Aβ oligomer is a relatively uniform nanoparticle, and the Aβ fibrils show a nanofibrous structure, which are the typical formats of Aβ aggregates.

|
Download:
|
| Fig. 2. Morphological characterization of fluorescent nanoparticles and Aβ42 aggregates. AFM images of KNPs (A) and FKNPs (B). TEM images of KNPs (C) and FKNPs (D). AFM images of Aβ42 oligomers (E) and Aβ42 fibrils (F). | |
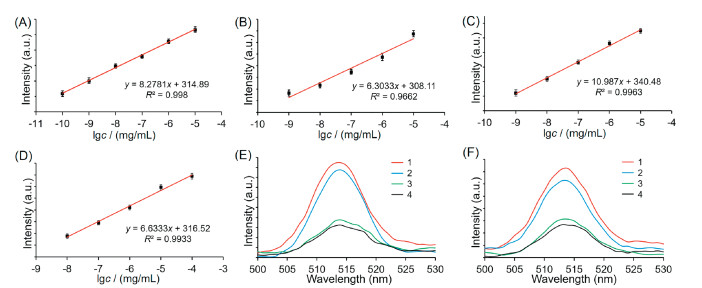
It is well known that Aβ42 in the brain of AD patients can gather together to form plaques and remain in the brain parenchyma, resulting in a decrease of Aβ42 protein level diffused into the blood. To verify that the fluorescent peptide nanoprobes can distinguish Aβ42 aggregates with different concentrations and forms, the concentration of Aβ42 close to its real value in human blood was selected to carry out the gradient verification. Researchers have summarized that the concentration of Aβ42 is around 2×10⁻⁸ mg/mL in the blood from AD patients [31]. Therefore, the concentration of synthetic Aβ42 aggregates with gradients of 10-4, 10-5, 10-6, 10-7, 10−8, 10-9, and 10-10 mg/mL was determined. Aβ42 aggregates with different morphology and fluorescent nanoparticles were mixed. Then the fluorescence intensity was recorded for the analysis. The results inFig. 3 showed obvious linear trends. When Aβ42 oligomer combined with FKNPs, the fitting curve is y=8.2781x + 314.89, R2=0.998 (Fig. 3A). When Aβ42 fibril combined with FKNPs, the fitting curve is y=10.987x + 340.48, R2=0.9963 (Fig. 3C). When Aβ42 oligomer combined with KNPs, the fitting curve is y=6.3033x + 308.11, R2=0.9662 (Fig. 3B). When Aβ42 fibril combined with KNPs, the fitting curve is y=6.6333x + 316.52, R2=0.9933 (Fig. 3D). The above results have demonstrated that KNPs and FKNPs both have the ability to distinguish different concentrations of Aβ42. Moreover, the FKNPs showed more sensitive detecting ability and more detecting ranges. The reason could be the morphology of the FKNPs, which have more uniform nanoparticles that can supply a larger specific surface area. Therefore, FKNPs could bind more Aβ aggregates and result in a better detecting result. Taking 10−8 mg/mL Aβ42 as the example that is close to the real value of Aβ aggregates in human blood, the fluorescence intensities of KNPs and FKNPs combined with Aβ42 monomers, fibril and oligomer are different (Figs. 3E and F). This result demonstrated that both FNPs and KFNPs can distinguish different forms of Aβ42 aggregates. Therefore, the KLVFF based fluorescent nanoparticles self-assembled in this study could be used to diagnose AD and monitor its progression due to their capacities to detect and distinguish different formats and concentrations of Aβ aggregates.

|
Download:
|
| Fig. 3. Fluorescent nanoparticles distinguish Aβ42 aggregates with different concentrations and forms. Correlation curve of lgc (Aβ42 oligomers) and fluorescence intensity of FKNPs (A) and KNPs (B) combined with Aβ42 oligomers. Correlation curve of lgc (Aβ42 fibrils) and fluorescence intensity of FKNPs (C) and KNPs (D) combined with Aβ42 fibrils. (E) Fluorescence emission spectra of FKNPs binding to Aβ42 with excitation wavelengths at 370 nm: 1. FKNPs + fibrils, 2. FKNPs + oligomers, 3. FKNPs + monomers, 4. FKNPs. (F) Fluorescence emission spectra of KNPs binding to Aβ42 with excitation wavelengths at 370 nm: 1. KNPs + fibrils, 2. KNPs + oligomers, 3. KNPs + monomers, 4. KNPs. | |
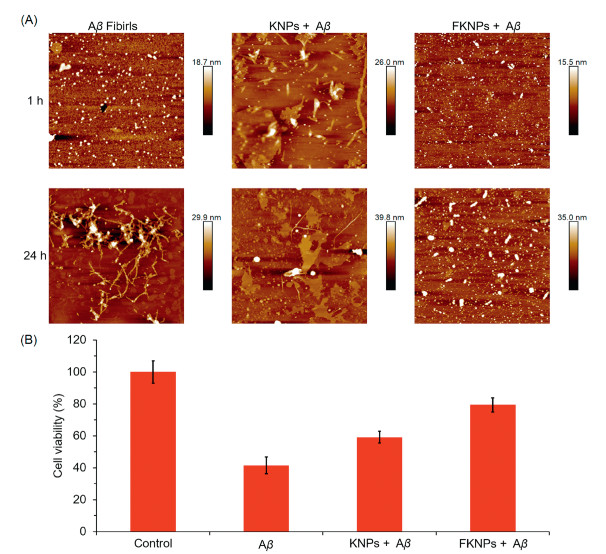
In order to verify the inhibiting ability of KNPs and FKNPs for Aβ aggregation, AFM was utilized to monitor the combination and self-assembly processes. KNPs and FKNPs were incubated with Aβ42 monomers for 24 h, and pure Aβ42 monomer was used as the control. As shown in Fig. 4A, the Aβ42 monomers were self-assembled into uniform nanoparticles with diameters around 18.7 nm after 1 h and continued aggregated to form fibrils with diameters around 29.9 nm after 24 h without any treatments. However, KNPs with Aβ42 were self-assembled into random nanostructures around 26 nm high after 1 h and changed to 39.8 nm after 24 h. FKNPs with Aβ42 were self-assembled into nanoparticles with a diameter of around 15.5 nm after 1 h and changed to 35 nm random nanoparticles after 24 h. It can be proved that KNPs and FKNPs can combine with Aβ42 and inhibit the process of fibrosis.

|
Download:
|
| Fig. 4. (A) Morphological characterization of the self-assembly process of fluorescent nanoparticles and Aβ42. (B) The anti-toxicity effects of Aβ42 by KNPs and FKNPs. | |
To detect the cytotoxicity of KNPs and FKNPs and their capacities to decrease the cytotoxicity of Aβ aggregates, PC12 cells with CCK-8 assay were utilized in this study. Compared with the control group without any treatment, the viability of PC12 cells added with pure Aβ42 was about 40%, the cell viability after treated with Aβ42 and KNPs was about 60%, and the viability of PC12 cells added with Aβ42 and FKNPs together was about 80% (Fig. 4B). Therefore, it is clear to see that KNPs and FKNPs not only have good biocompatibility but also can decrease the cytotoxicity of Aβ42 aggregates.
In conclusion, the KLVFF and Fmoc-KLVFF self-assembled fluorescent nanoparticles KNPs and FKNPs with good biocompatibility can recognize and combine with Aβ42 aggregates, induce changes in fluorescence intensity. Both KNPs and FKNPs can detect different concentrations of Aβ42 and distinguish different forms of Aβ42 (fibril and oligomer), which have the potential for AD diagnosis and accurately determine the pathological period of AD patients. Moreover, FKNPs are superior to KNPs no matter the size of nanoparticles to the ability to distinguish different concentrations and forms of Aβ42 aggregates. The main reason is that there are three aromatic rings in the Fmoc structure, which play a stronger role in the self-assembly process and the specific binding process with Aβ42. Another reason could be the electrostatic interaction as KNPs were negatively charged while FKNPs were positively charged (Figs. S3 and S4 in Supporting information). The surface charge of Aβ42 is negative so that it is easier to combine with FKNPs. Therefore, Fmoc-KLVFF self-assembled fluorescent nanoparticles FKNPs is the suitable biological nanoprobe that has the potential to diagnose AD and monitor its progression.
Declaration of competing interestThe authors declare that they have no known competing financial interests or personal relationships that could have appeared to influence the work reported in this paper.
AcknowledgmentsThis work was supported by the National Natural Science Foundation of China (Nos. 31900984 and 31971315), the Natural Science Basic Research Plan in Shaanxi Province of China (Nos. 2019JQ-231), the China Postdoctoral Science Foundation (No. 2018M631197), the Shaanxi Postdoctoral Science Foundation (No. 2018BSHQYXMZZ42), the Fundamental Research Funds for the Central Universities (No. 31020180QD063), and National Undergraduate Training Programs for Innovation and Entrepreneurship (No. 201810699343). We would like to thank the Analytical & Testing Center of Northwestern Polytechnical University for the AFM and TEM characterization.
Appendix A. Supplementary dataSupplementary material related to this article can be found, in the online version, at doi:https://doi.org/10.1016/j.cclet.2020.09.009.
| [1] |
M. Ono, H. Saji, Med. Chem. Res. 6 (2015) 391-402. |
| [2] |
Y. Liu, Y. Zheng, S. Li, et al., Chin. Chem. Lett. 31 (2020) 3113-3116. DOI:10.1016/j.cclet.2020.04.052 |
| [3] |
F. Mangialasche, A. Solomon, B. Winblad, P. Mecocci, M. Kivipelto, Lancet Neurol. 9 (2010) 702-716. DOI:10.1016/S1474-4422(10)70119-8 |
| [4] |
M. Lazo-Porras, M.A. Pesantes, J.J. Miranda, A. Bernabe-Ortiz, eNeurologicalSci 5 (2016) 35-40. DOI:10.1016/j.ensci.2016.11.012 |
| [5] |
Y. Li, X. Cao, C. Tian, J.S. Zheng, Chin. Chem. Lett. 31 (2020) 2365-2374. DOI:10.1016/j.cclet.2020.04.015 |
| [6] |
J.C. Lee, S.J. Kim, S. Hong, Y. Kim, Exp. Mol. Med. 51 (2019) 1-10. |
| [7] |
Z. Ou, L. Deng, Z. Lu, et al., Nutr. Diabetes 10 (2020) 12. DOI:10.1038/s41387-020-0115-8 |
| [8] |
P. Yang, C. Yang, K. Zhang, L. Wang, H. Wang, Chin. Chem. Lett. 29 (2018) 1811-1814. DOI:10.1016/j.cclet.2018.10.003 |
| [9] |
A. Boumenir, E. Cognat, S. Sabia, et al., Alzheimers Res. Ther. 1 (2019) 29. |
| [10] |
R. Malishev, E. Arad, S.K. Bhunia, et al., Chem. Comm. 54 (2018) 7762-7765. DOI:10.1039/C8CC03235A |
| [11] |
A. Belostozky, M. Richman, E. Lisniansky, et al., Chem. Comm. 54 (2018) 5980-5983. DOI:10.1039/C8CC01233D |
| [12] |
A.I. Bush, Trends Neurosci. 26 (2003) 207-214. DOI:10.1016/S0166-2236(03)00067-5 |
| [13] |
T. Iwatsubo, Curr. Opin. Neurobiol. 14 (2004) 379-383. DOI:10.1016/j.conb.2004.05.010 |
| [14] |
G. Bitan, S.S. Vollers, D.B. Teplow, J. Biol. Chem. 278 (2003) 34882-34889. DOI:10.1074/jbc.M300825200 |
| [15] |
T. Kasai, T. Tokuda, M. Taylor, et al., Neurosci. Lett. 551 (2013) 17-22. DOI:10.1016/j.neulet.2013.06.029 |
| [16] |
H. Duan, Y. Ding, C. Huang, et al., Chin. Chem. Lett. 30 (2019) 55-57. DOI:10.1016/j.cclet.2018.03.016 |
| [17] |
J.B. Toledo, L.M. Shaw, Trojanowski J.Q., Alzheimers Res. Ther. 5 (2013) 8. DOI:10.1186/alzrt162 |
| [18] |
H.M. Snyder, M.C. Carrillo, F. Grodstein, et al., Alzheimers Dement. 10 (2014) 109-114. DOI:10.1016/j.jalz.2013.10.007 |
| [19] |
Q. Luo, Y.X. Lin, P.P. Yang, et al., Nat. Commun. 9 (2018) 1802. DOI:10.1038/s41467-018-04255-z |
| [20] |
P. Li, Y. Chen, Y. Liu, Chin. Chem. Lett. 30 (2019) 1190-1197. DOI:10.1016/j.cclet.2019.03.035 |
| [21] |
Z. Fan, L. Sun, Y. Huang, Y. Wang, M. Zhang, Nat. Nanotechnol. 11 (2016) 388-394. DOI:10.1038/nnano.2015.312 |
| [22] |
Z. Fan, Y. Chang, C. Cui, et al., Nat. Commun. 9 (2018) 2605. DOI:10.1038/s41467-018-04763-y |
| [23] |
K. Tao, Z. Fan, L. Sun, et al., Nat. Commun. 9 (2018) 3217. DOI:10.1038/s41467-018-05568-9 |
| [24] |
D. Fu, D. Liu, L. Zhang, L. Sun, Chin. Chem. Lett. 31 (2020) 3195-3199. DOI:10.1016/j.cclet.2020.07.011 |
| [25] |
L. Sun, Z. Fan, T. Yue, et al., Bio-Des. Manuf. 1 (2018) 182-194. DOI:10.1007/s42242-018-0019-9 |
| [26] |
L. Sun, A. Li, Y. Hu, et al., Part. Part. Syst. Charact. 36 (2019) 1800420. DOI:10.1002/ppsc.201800420 |
| [27] |
M. Sun, H. Hu, L. Sun, Z. Fan, Chin. Chem. Lett. 31 (2020) 1729-1736. DOI:10.1016/j.cclet.2020.02.035 |
| [28] |
M. Yu, D. Su, Y. Yang, et al., ACS Appl. Mater. Interfaces 11 (2019) 176-186. DOI:10.1021/acsami.8b16219 |
| [29] |
Z. Yu, Q. Xu, C. Dong, et al., Curr. Pharm. Des. 21 (2015) 4342-4354. DOI:10.2174/1381612821666150901104821 |
| [30] |
W. Ma, S. Sha, P. Chen, et al., Adv. Healthc. Mater. 9 (2020) 1901100. DOI:10.1002/adhm.201901100 |
| [31] |
Y. Zhou, L. Liu, Y. Hao, M. Xu, Chem. Asian J. 11 (2016) 805-817. DOI:10.1002/asia.201501355 |